“The dangerous practice of stockjobbing would divert the genius of the nation from trade and industry. It would hold out a dangerous lure to decoy the unwary to their ruin, by making them part with the earnings of their labor for a prospect of imaginary wealth.” Charles MacKay, Extraordinary Popular Delusions & the Madness of Crowds
Intuition is one of the human mental resources.
What is it?
Intuition is knowing something without knowing why.
The best traders I have ever known use their intuition over their rational deductive processes.
They value their hard earned intuition over the canned heat of a “system”
How have they honed their intuition?
Mark Twain stated “Good judgement is the result of experiences and experiences the result of bad judgement.”
Intuition is the journey from A to Z without stopping all the letters on the way.
It’s coming to a conclusion quickly without necessarily taking the time at that moment to access why you came to that conclusion.
You can think of it as seeing an image before all the pieces of the puzzle are in place.
You figure out what it is.
The root of the word, intu, means to guide.
The truth is that logic is not for swing trading and day trading.
The reality is that in western cultures logic is unoriginal and far to slow to be useful in the volatility we call the trading markets because it is slow to accept reality and it is burdened by judgement.
Logic spends valuable time thinking about the way things ought to be or used to be or could be or might be.
In nature, an animal doesn’t spend any time doing that.
An animal threatened does not use logic, it uses intuition or instinct.
What is the difference: instinct is inbred, inherent.
Intuition is something that is constantly learned.
Like trading.
This is why patterns and pattern analysis is so important in trading.
We know we’ve seen it somewhere before…at least if we’re a student of history and have been through more than a few cycles.
Today I want to make some comparisons between 1929 and 2025.
Most market participants believe that the decade of the 1920’s was indeed the Roaring Twenties.
But the fact is the “roaring” part of the decade was really around 5 years—from late 1924 to late 1929.
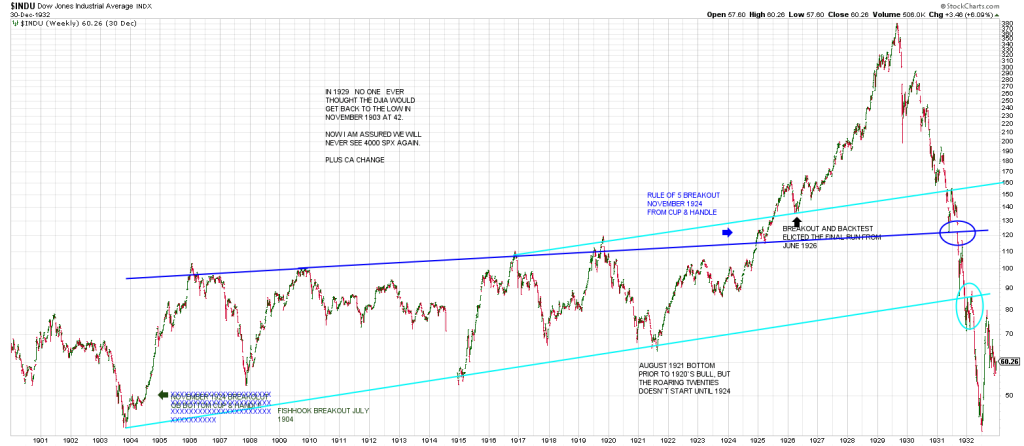
You can see the DJIA broke out of a Cup and Handle in late 1924.
The breakout of the Cup and handle came 5 years after the left side of the Cup in 1920.
Checking this decade, we see that the SPX broke out of a weekly Cup and Handle in November 2020.
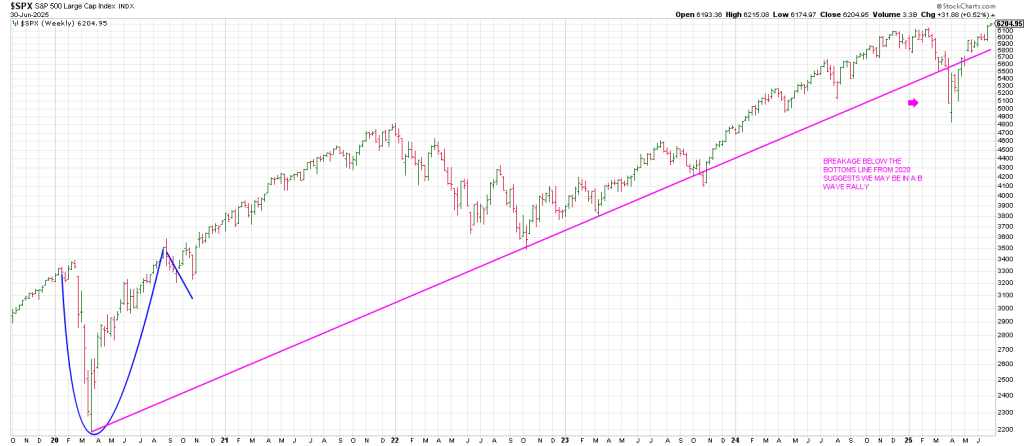
Five years later of course is November 2025.
The low prior to the 1920’s Bull Run was in August 1921 at 69.
The euphoric parabolic phase can be said to have started from a smaller Cup and Handle breakout in 1927.
From my perspective it mirrors the Cup and Handle breakout in November 2023.
Two years later takes us to November 2025.
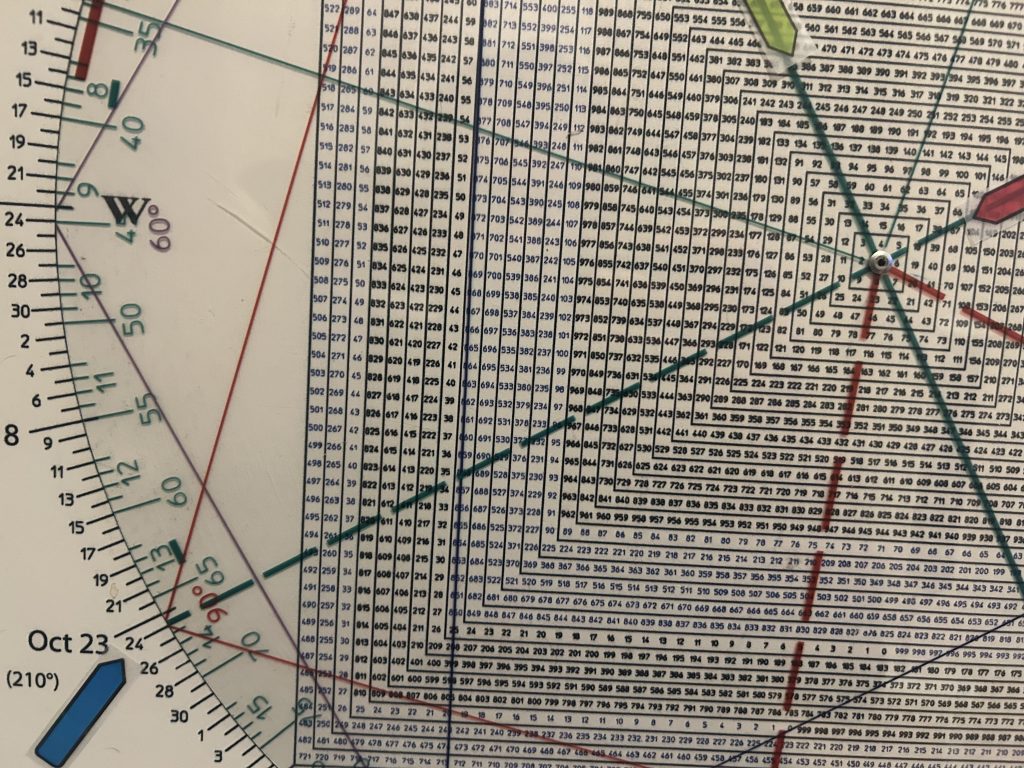
Let’s see if there is any time/price synchronicity between the two years, 1929 and 2025.
How big was the advance from 1921 to 1929 as to the Principle of Squares?
From 69 a full 6 price cycles up gives 411. That would have perfected a cube.
The top however was a tad shy culminating at 386.
1929 was 96 years ago.
96 aligns with the Summer Solstice and is opposite the big Jupiter/Saturn conjunction on December 21, 2020.
As well, the 69 low squares out with 96… a possible numerological mirror image foldback?
The SPY low in 2009 was 67.
67 is opposite Oct 24th, the day the crash started in 1929.
67 squares 386, the DJIA high in 1929.
How far has the SPY run from the 2009 low?
It drove thru 6 revs of 360 degrees up at 406 like a knife thru butter.
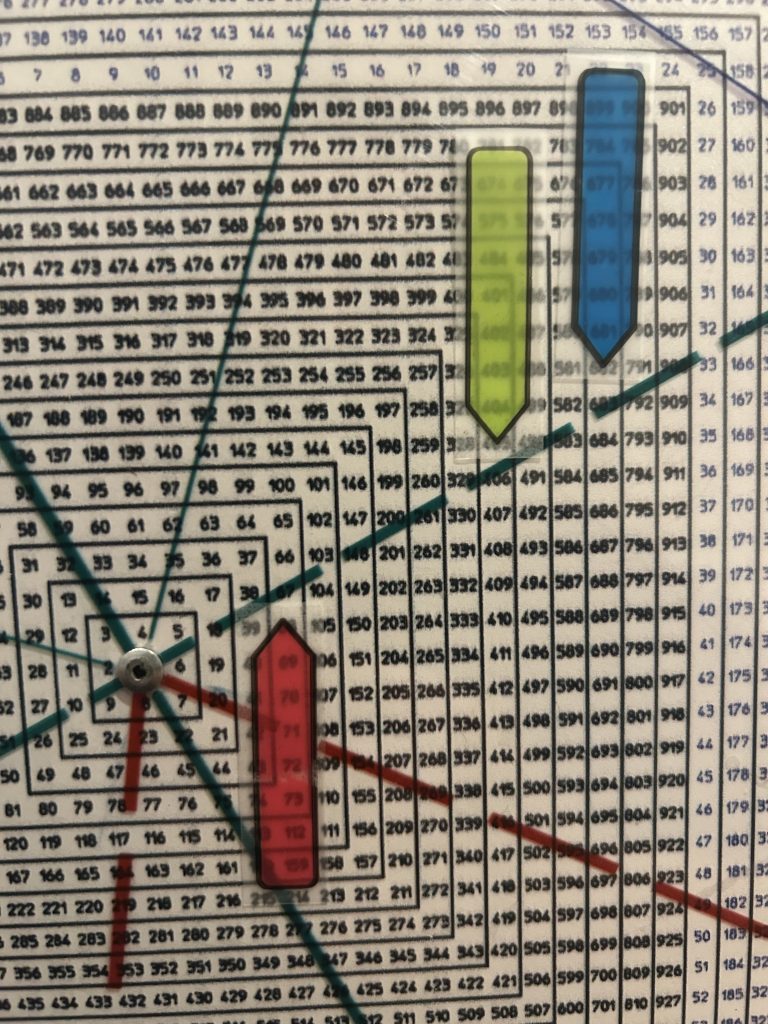
9 squares up from 67 is 683 or 6800 region on the SPX.
If we’re going to get a melt up (on top of the current melt up?) that’s a potential target.
That said my expectation is the market is so stretched that we get a solid correction first.
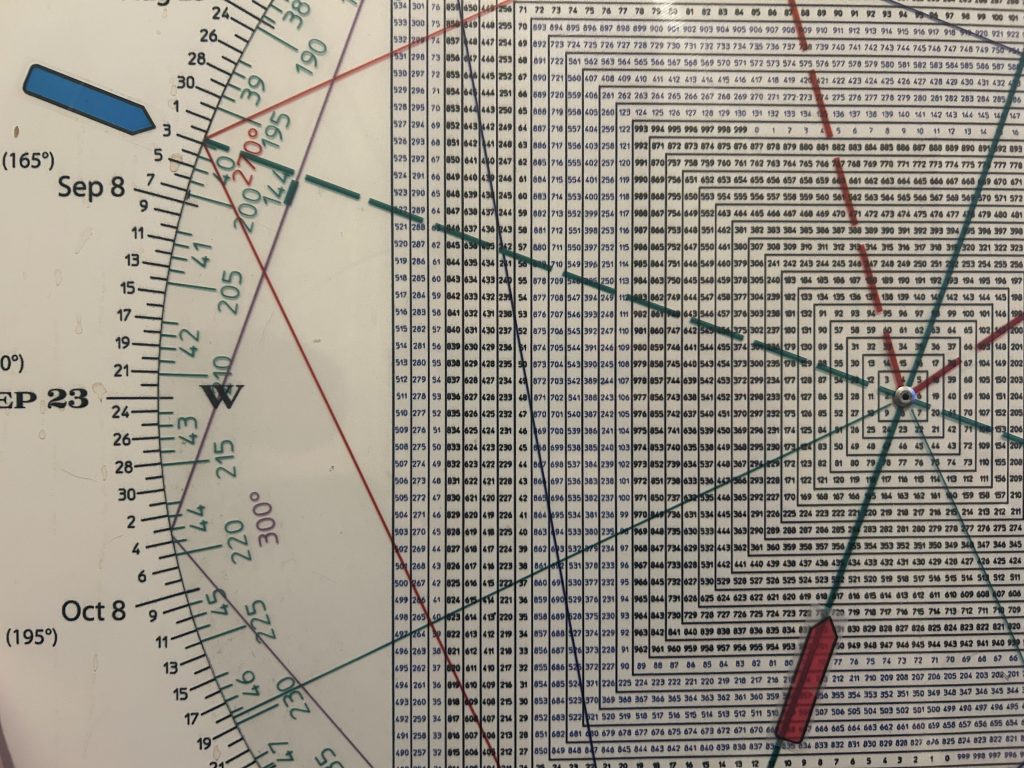
Interestingly 7 revs up from 67 is 490 (4900) which ties roughly to the 2021 peak and the April 2025 low.
8 Squares up from 67 is 583. If the long-awaited correction is on the table, the likelihood is that we pullback to 583.
Currently 583 is the 50/200 day ma Bowtie.
Breakage below 583 from this juncture is a warning that the top may already be in.
Lastly, while it clearly seems to pat to assume the market topped yesterday, as window dressing ended
(what do the retail marauders need with “mark-up”?), it is curious that yesterday’s SPY high of 617/618 squares out with September 3, the 1929 high.
More than intuition suggests that while the SPY likely ends the year higher than the 5982 level it closed at in 2024.
Synchronicity suggests a major top and unwinding in 2026.
Using the numbers 1932 as the year 1932 on the Sq of 9 shows that November 13 is opposition. 1932.
November 13 was the crash low in 1929.
In other words the date of the crash low points to the year of the Bear low, 1932.
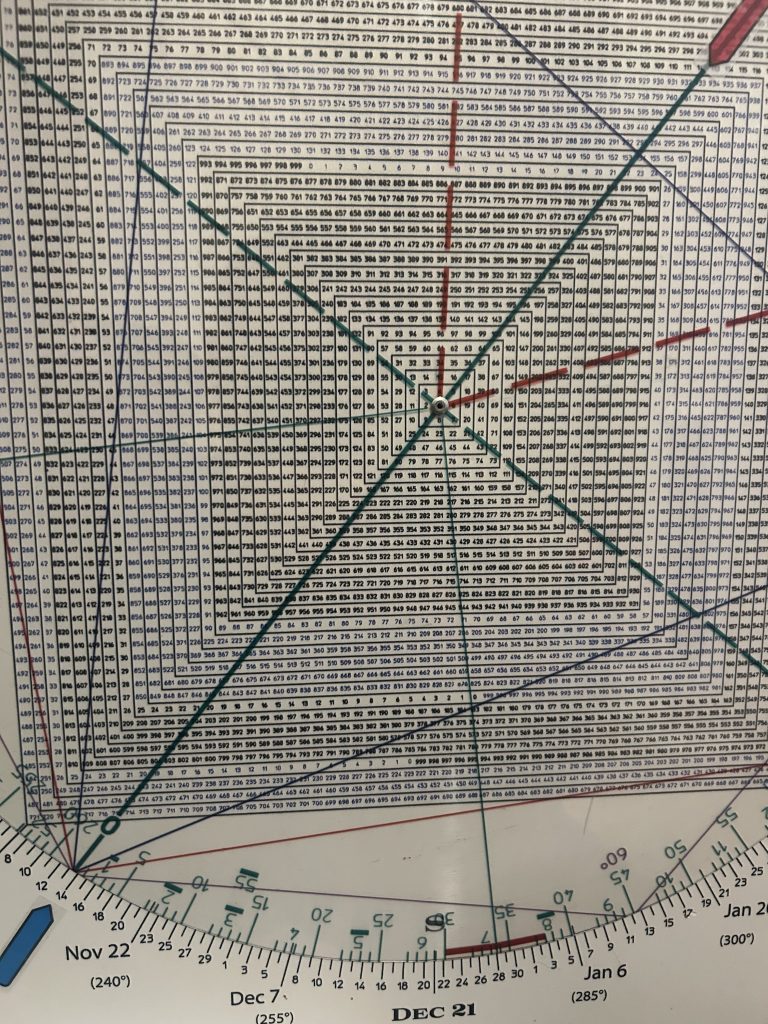
Amazing.
The year 2025 aligns with November 7th.
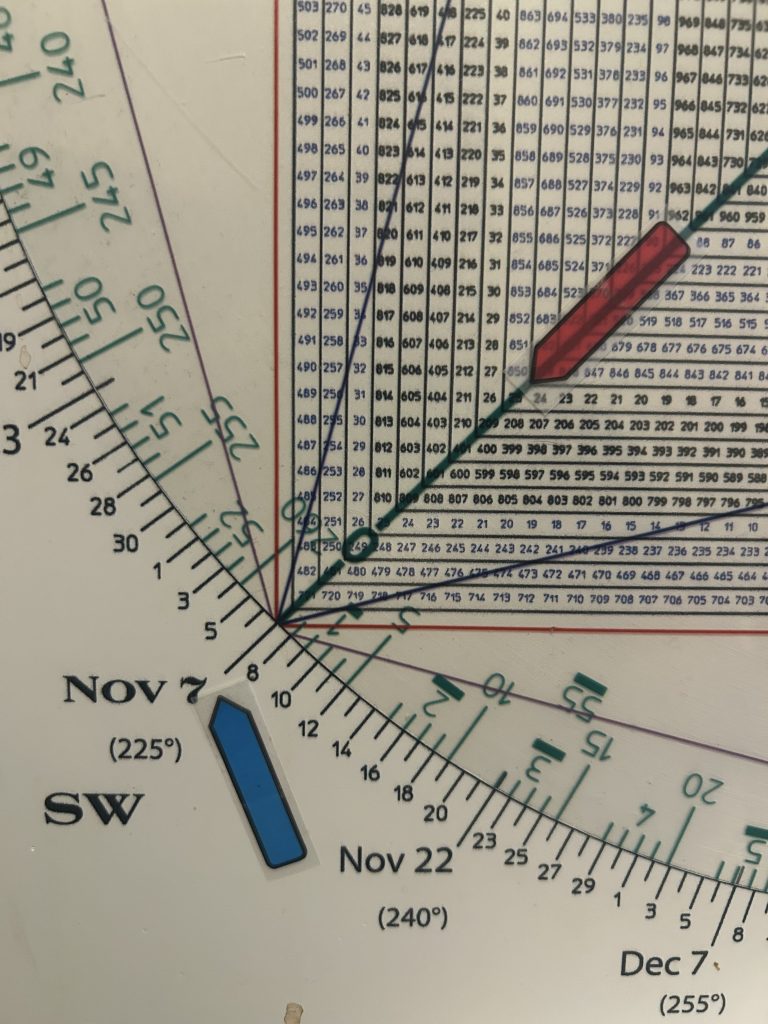
November should be interesting.
Last week we noted that mid-August is 180 days/degrees from the important February peak.
Mid-November is 90 degrees square mid-August.
In sum, the advance from 2009 to 2015 is far greater than that of the Bull Run of the 1920 in terms of Time and Price.
In price through the lens of the Principle of Squares the advance in the 1920’s was just shy of 6 full squares of 360 degrees.
From 2009, the SPY has advanced just shy of 8 ½ full revs.
9 squares is 683 and is opposite October. Is October/November a top this year in a mirror image fold back of 1929?
The 5 year roaring euphoria stage from Cup and Handle breakout starting in 1924 and lasting until 1929 is mirrored by the 5 year run following the Cup and Handle breakout in late 2020.
“Synchronicity is an ever present reality for those who have eyes to see.” Carl Jung
Do you see the synergy of 5 year cycles, a DNA that the market is riddled with in the last 100 years?
1932-1937
1937-1942
1982-1987
1995-2000
2002-2007
2020-2025?