“So look at me now
I’m just makin’ my play
Don’t try to pusk your luck, just get out of my way
Cause I’m back in black.” Back In Black, AC/DC
“We must remember that delusions swing between extremes, like pendulums. Delusions of grandeur and unending wealth give place to delusions of unending gloom. One is as unreal as the other.” Bernard Baruch
On Tuesday, the SPX closed at 6092 just 1% short of the Feb 19, 2025 all-time closing high of 6147.
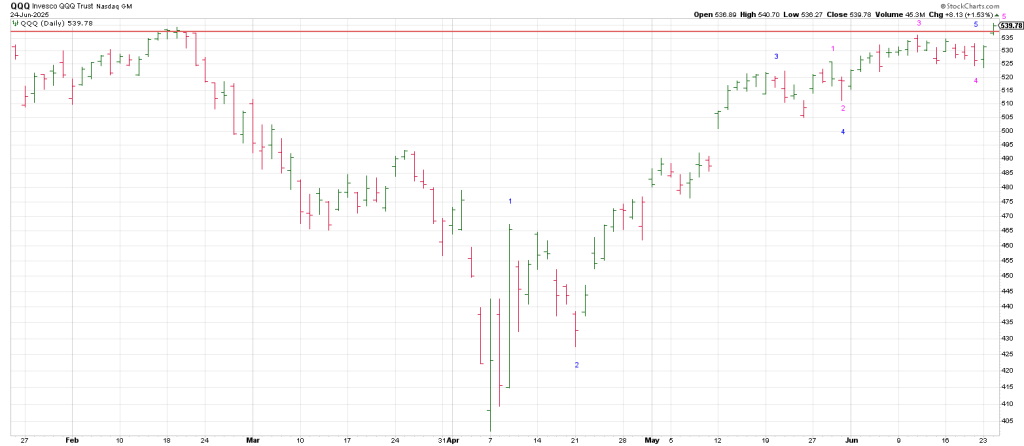
Simultaneously, the NDX, the NAZ 100 or QQQ produced new closing highs.
However, the common stock only Advance/Decline Line (excluding all ETF’s and Bond Funds) failed to make a new all-time high.
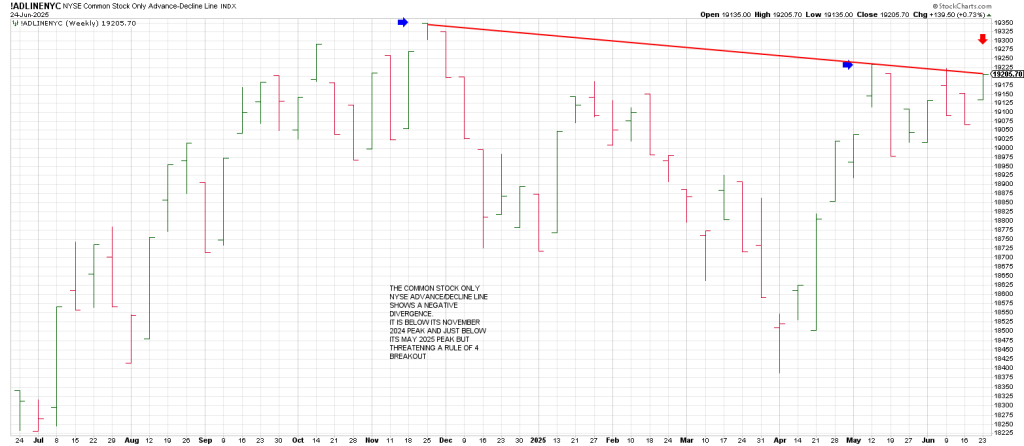
The above Common Stock Only A/D line is below its November 2024 peak and just below its May 2025 peak.
However, it is threatening a Rule of 4 Breakout, a breakout above a 3 point declining trendline.
Notice that the lower high at May peak in the A/D line coincides with the 90 day/degree peak in the SPX from its February 19th all-time high.
Notice how the A/D line filled the open gap while the index itself did not.
Currently, the A/D Line is just below its May peak while the SPX is obviously well above its May high, but it threatening a Rule of 4 Breakout.
In other words since the May 19, SPX high the index has made a series of new swing highs while the A/D line itself has never exceeded its May peak.
Given the pattern you can see that that could end today.
Another way to look at it however is that given the A/D line has been unable to make new swing highs for the last month while the SPX has done so may suggest a potential climax if the A/D line breaks above the red trend line and then reverses back below it in short order.
“Short order may coincide with the first week of July…after a quarter-end raging bull led by the chips.
Interestingly the end of the quarter, June 30, is 180 degrees straight across and opposite 611/612 (6110-6120) on the Square of 9.
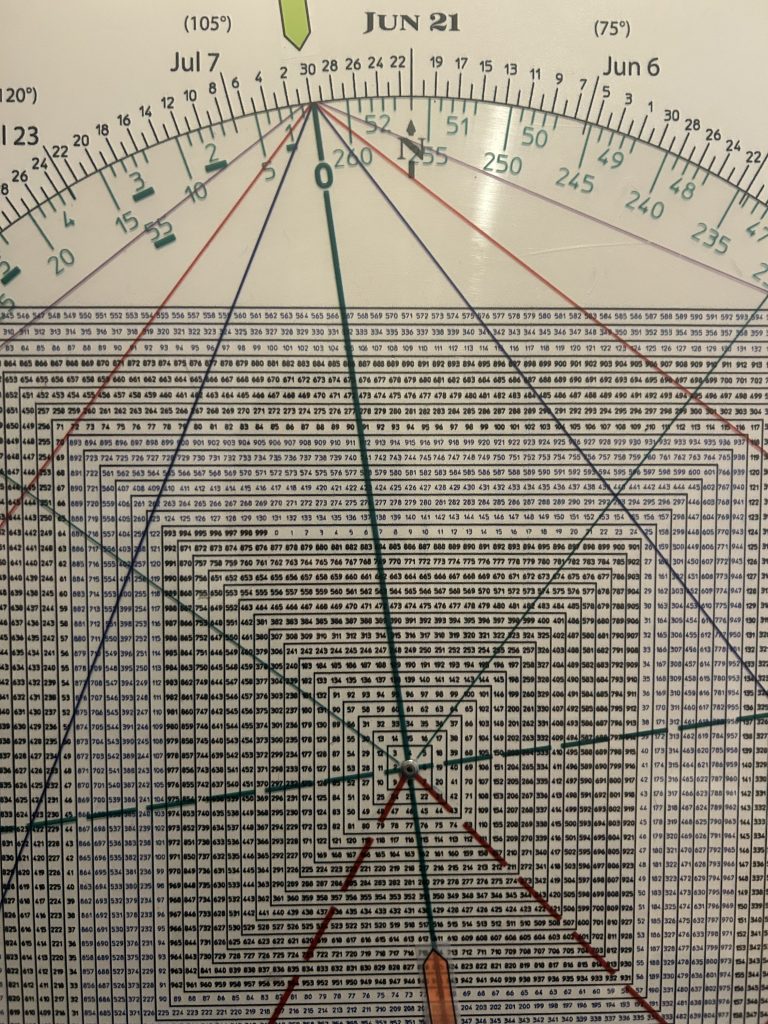
As well, the first week of July is 90 days/degrees from the big April 7u, 2025 low.
Last week we walked thru the synergy of the history that ties to July.
Read it if you have not already done so.
Once again, a turn down in the SPX and QQQ 3 Day Charts defined a low on Friday—although we went a little bit lower initially on Monday before reversing with authority out of what has been a two week narrow trading range.
It was Monday’s dip below last weeks low that produced a WEEKLY Plus One/Minus Two buy setup perpetuating a large Gap & Go on Tuesday.
The buying frenzy in already vertical names must be chalked up to FOGO…Fear Of Getting Out in front of quarter-end window dressing in full throttle.
The “fear and frenzy” ignited by the paring down of risk into Mid-East tensions.
Momentum Monsters include:
NET, CRDO, ORCL, DASH, ASTS, SNOW and AVGO to mention a few.
A successful breakout could ignite a new upleg of course, but in addition to the 610/612 square-out looming 90 days/degrees from high we are in a 5th wave up from the April low in the context of a 5th wave up from the May low.
This is the same count on the QQQ shown above.
The question is whether this 5 waves up from April is 5 waves of a bearish B wave to be followed by a vicious C wave decline or whether we are simply completing 5 waves of a larger wave 1 off the April low.
We will only know by the structure of the next meaningful correction.
Keep in mind that even in the bullish scheme of things a bullish wave 2 pullback could see a 50% correction of the
Range from the April low.
If we take the range from 6147 to 4835 we get 1312 points.
Half the range points to 5491.
Assuming the 6147 ATH holds for the next week, it is remarkable that 1312 squares out with July 2.
Amazing.
Interestingly 5491 ties to the March 13 low.
If the SPX should drop to that 5500 region it may produce the Right Shoulder of an Inverse Head and Shoulders pattern.
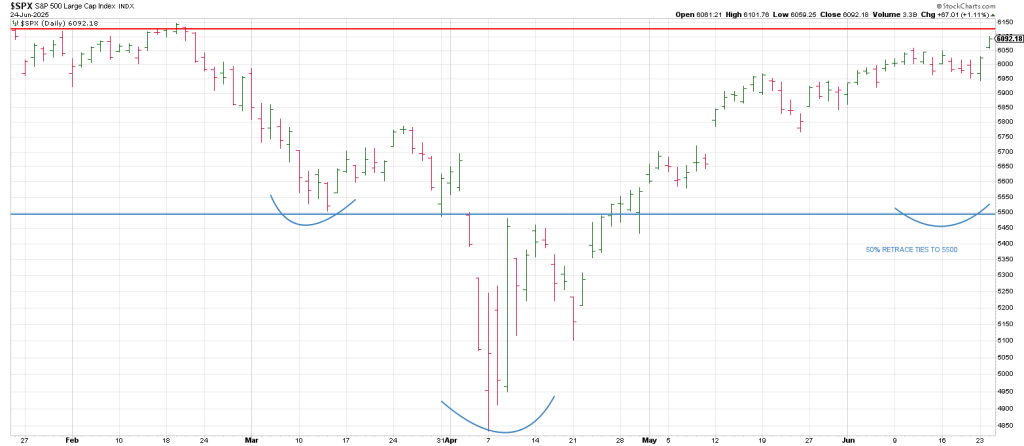
Just for fun, let’s assume we get a double top of sorts here and if a decline to 5500 ish should play out and then the SPX advances above the 6147 level which for sake of supposition may be a Neck Line, the ensuing projection clearing 6147 would be 6794.
Following this potential end of quarter potential July turning point (the last two July’s have been highs) then the next turning point would be mid-August which is 180 degrees from the February all-time high.
If we do start a decline from this time frame, it is interesting that 7 weeks from the beginning of July is mid-August…just like the 7 week decline from Feb 19 into April 7.
In sum, a new high around quarter-end that reverses back through the February high, within a week, will trigger a weekly Soup Nazi sell signal.