“But when she turns her back on the boy
He creeps up from behind” Maxwell’s Silver Hammer, The Beatles
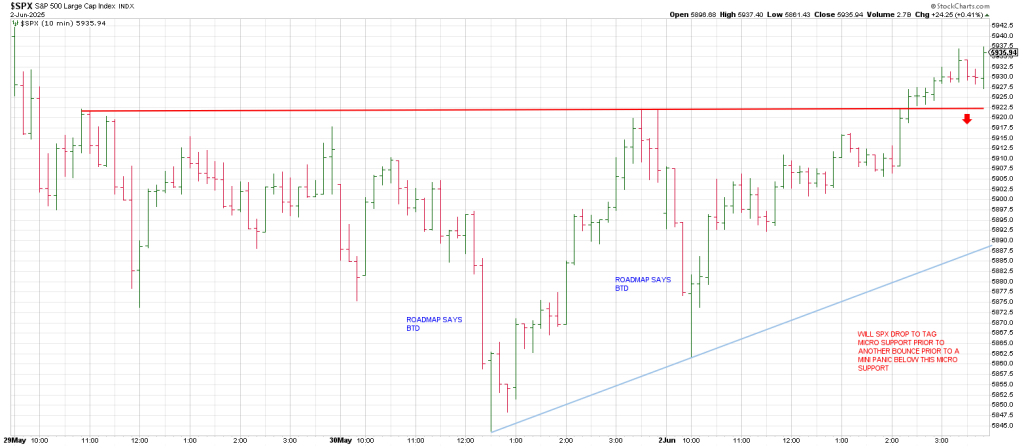
Another day, another buy the dip
Friday the Roadmap projected a steep selloff and a sharp rebound.
Ditto Monday.
The difference was the Roadmap indicated another swoon in the last 45 minutes on Monday and that never materialized.
Sometimes there is an hour slippage.
And today’s Roadmap calls for a sharp decline after the first 15 minutes or so of trading so perhaps that’s the one hour “slippage”
The chart below is the SPX with the McClellan Oscillator below.
Focusing on just the yellow down arrows on the McClellan Oscillator—these arrows represent divergences in the indicator.
These ‘indicator divergences’ are shown by the red arrows in the chart.
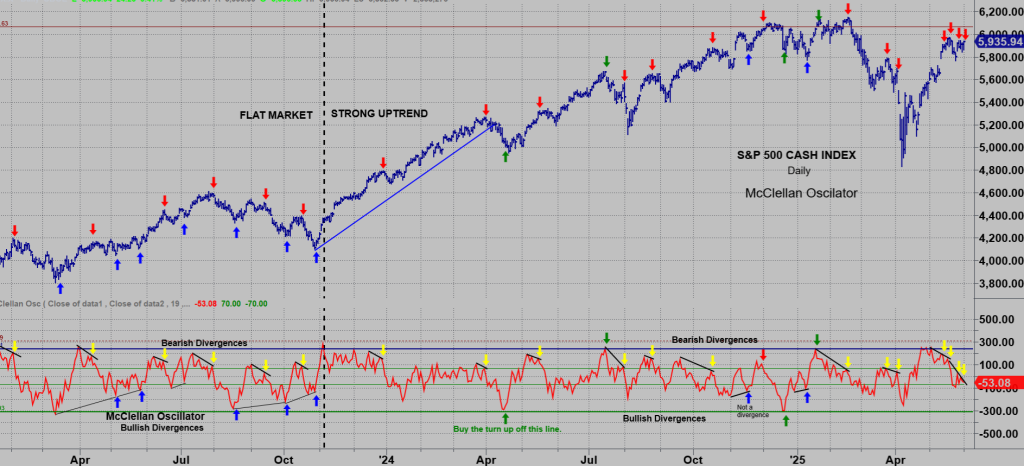
Almost all these points begin selloffs in the SPX. Note that February 19th (the top) was an incredible divergence followed by a sharp decline. The next two signals were the same and drove the market to its April 7 low.
Since then, the market has rallied and recent ‘indicator divergences’ have occurred. May 13 was the first and the market moved higher to the next divergence on May 19 when the market topped and corrected into the May 23 low.
The next indicator divergence occurred on May 28 after another decline in the McClellan Oscillator.
Now I think we are likely to have a correction similar to what followed after the second recent arrow on May 19.
I think the trend line on the indicator as important. The price action looks very similar to what we saw leading into
May 19. This should result in a correction. If the correction holds support (the 200 dma and prior low) it is likely to be a ‘c’ wave that produces a wave 4 low.
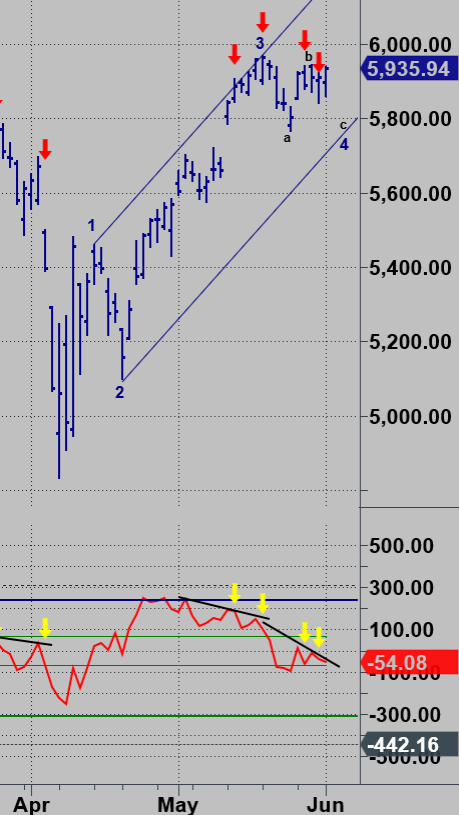
If this plays out I expect a move above the wave 3 high that sets up a high in early to mid-June.
I don’t really key off indicators as long term members know.
My experience is that all indicators are of second degree magnitude since they evolve from Time and Price (and Volume).
Be that as it may when the McClellan Oscillator complements our own Square of 9 time and price synergies and the position of the 3 Day Chart and the 3 Week Chart, I think it is value-added.
As offered yesterday June 6 to 13 sets up as a pivot.
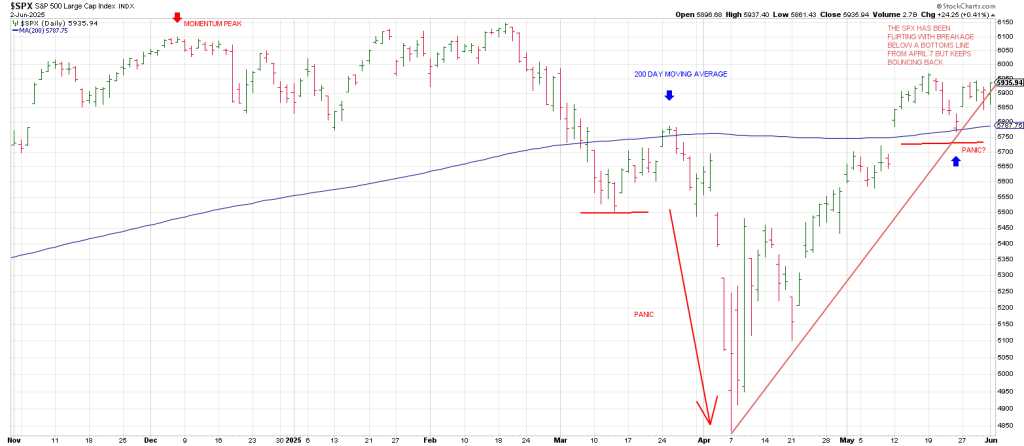
To recap December 6 was the Momentum Peak so 180 degrees/days later gives June 6.
As well March 13 was an important interim low. 90 degrees/days later gives June 13.
The March 13 low led to a test of the overhead SPX 200 dma.
When the March 13 low broke the market panicked.
Now we tested the 200 day moving average from ABOVE on May 23.
This time a second drive to the 200 dma that fails to act as support could see the market panic.
The real action on Monday was in the precious metals.
GLD exploded to close just above a Tops Line.
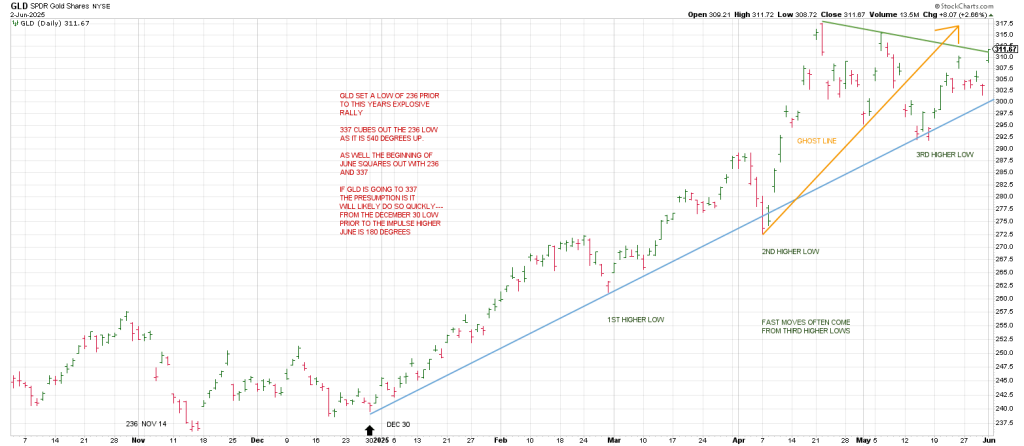
Notice that this strength follows a 3rd higher low.
Fast moves often come from third higher lows.
The low prior to 2025’s parabolic move in gold was 236 GLD on November 14.
540 degrees up from 236 is 337.
So 337 cubes out the low.
As well the beginning of June squares-out with 236 and 337.
If GLD is going to 337, the presumption is it will likely do so quickly.
From the December 30 low prior to the impulse higher, June is 180 degrees out.
SLV staged a minor and major Rule of 4 Breakouts.
These are breakouts over 3 point trend lines.
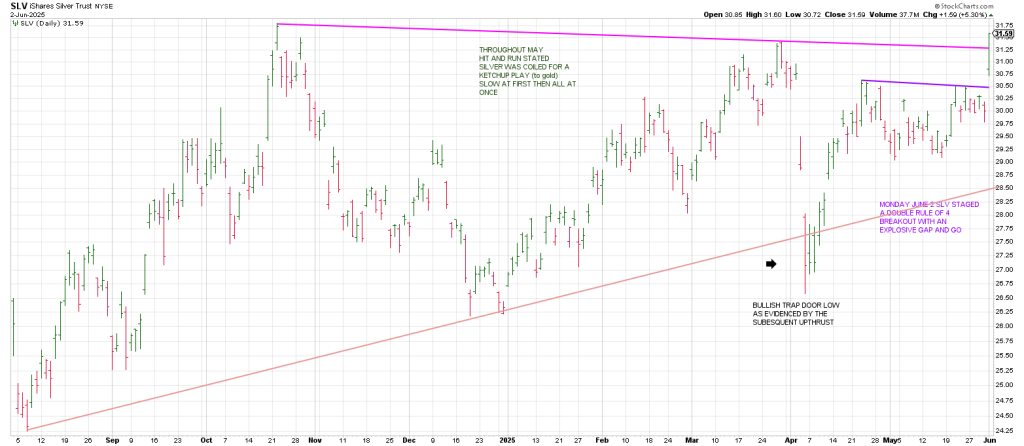
We have pointed to SLV’s coil saying a Ketchup Play was on the table (slow first then all at once).
All seemed set for Friday. Except it snoozed.
One trading day later it exploded. A good lesion to buy some time when you’re playing options.
Be that as it may we have a double long swing position in AGQ.
From April’s Trap Door low of 26.50, 90 degrees up is 32.50.
Above 32.50 and holding opens the door to 38.50.
When silver gets on its heels, it makes fools of bulls and bears alike.
Follow thru opens the door for a silver Starburst pattern.