“I tell my eyes to look the other way, they don’t seem to hear a word I say.” I Go To Pieces, Del Shannon
“A lot of smart people think they’re way smarter than they are, and therefore they do worse than dumb people. And it’s very common to be utterly brilliant and think you’re way the hell smarter than you are.” Charlie Munger
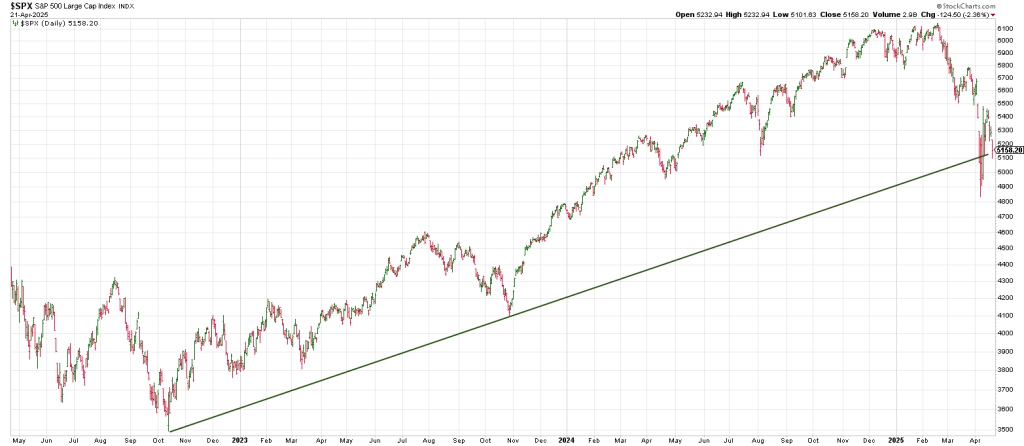
The daily SPX above shows a Bottoms Line connecting the Oct 2022 low with the Oct 2023 low.
Notice the Undercut and Rally in April 2025.
There is one major distinction between the October 2022 and the October 2023 lows and the current “test” of this trend line.
The SPX made a “V” Bottom in 2022 and 2023.
In other words there was no test of the low.
IF the current pattern turns out to be bullish…at least for meaningful countertrend rally (the C wave rally we’ve suggested) then the current pullback can be ‘counted’ as a test.
Will the test fail or succeed?
The following chart zooms in on this same trend line from 2022 and 2023.
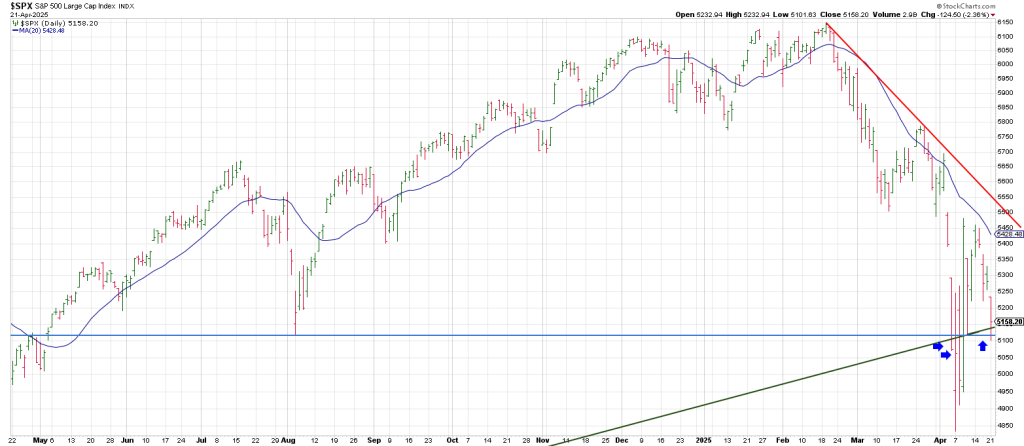
On Friday April 4th and Monday April 7th the SPX closes a tad below the trend line.
A Black and Blue Friday/Monday.
On April 8, the SPX closes “convincingly” below this 2 ½ year trend line.
Markets do play out in threes.
Enter the Dragon.
“Someone” wasn’t so convinced.
On April 9th the SPX exploded nearly 500 points or 10%.
Remember when we showed the 10% rally day in the middle of the crash in 1929.
Black Monday Oct 19, 1987
The DJIA fell 23% in one day, followed by a relief rally on October 21, 1987
In March 2000 the NAZ staged multiple bear-market rallies of at least 18% (not daily).
In March 2020 in the middle of the Covid Crash, the SPX staged a 10% + rally day.
To mention a few.
Yesterday, Monday April 21st, the SPX had a Breakaway Gap below an hourly trend line from the April 7th low.
An hourly Rule of 4 Sell was triggered.
We tweeted the following hourly yesterday.
Let’s take another look at the SPX daily.
Notice the important pivot depicted by the light blue horizontal line.
This defines the May 2024 breakout and the August 5th 2024 test of that breakout.
Is the SPX carving out a volatile test of that 5100 ish Pivot?
In sum, yesterday was a Gap & Go to the downside.
Phil D Gap resides at 5282.
The gap window starts at 5233.
So a 50 point mansion Phil is renting currently.
Offsetting that gap triggers a Jump The Creek buy signal.
Of course the SPX staged a false Jump The Creek buy signal on massive April 9th rally day which perpetuated an additional 90 points on the tail end of that surge.
Bearishly, there was no follow thru.
Upside follow thru below Monday’s gap that sticks and then above the gap from April 4th that produced the April 7th low for the move opens the up door.
Notice that a rally to the April 4 open gap ties to the declining 20 day moving average.
The SPX Pinocchio’d the 20 dma in late March. That test of the 20 failed sending the index down for the count.
Notice also that a rally back to this 5500 region ties to a Tops Line (red) off the all-time high).
Even if the SPX is able to produce a rally off Monday’s “test” to this 5500 region, thereby disabusing many market participants of an ongoing bear market, it may be installing a second lower high and theoretically a THIRD lower high (using the April 9th high as #2).
And as we know 3rd lower highs see fast declines.
The question is if this rally occurs will it lead to a C Wave within the context of an A B C Wave 2 bear market rally or
Does it point to the alternate scenario…a push to an all-time new high in a Slaughterhouse Five scenario?
The remarkable thing about yesterday’s late rally and this mornings so-far follow thru is that it occurred from a Bulls Eye Time/Price Square-out:
April 21st squares-out with 511 or 5110.
Monday’s low 5101.
Monday’s close 5157 after a late-day spike.
This morning the futes are up 50 points.
Was Monday a Trap Door Test?
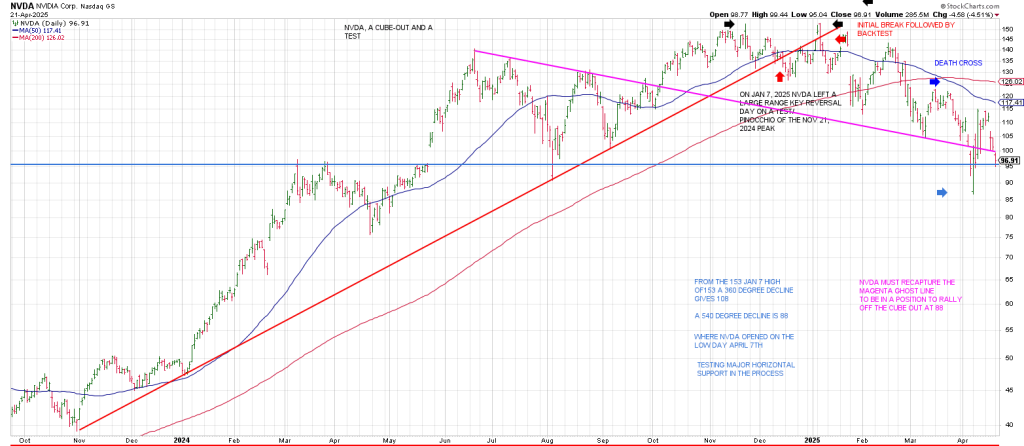
The poster child for the bull, NVDA suggests a rally phase in the markets if we have seen a successful test.
NVDA left a large range Key Reversal day on January 7, 2025.
A fast drop followed after a 3rd lower high in tandem with a Death Cross in mid-March.
Notice that the January peak was a backtest of a break in trend (red line).
From the 153 high a 360 * decline gives 108.
A 540 degree decline is 88 where NVDA opened on the low day, April 7th.
That region was tested Monday in league with a test of horizontal support (light blue).
This horizontal support region also ties to a Ghost Line off the June 2024 momentum peak.
In sum, 180 degrees/days from the June peak ties roughly to the Nov Primary High.
90 days/degrees from the January 7 all-time high is April 7, the SPX and NVDA low for the year.
For the moment the idea of a test has to be respected…for the moment.
A weekly SPX (thru last week) with the only indicator I use shows weekly Train Tracks testing a multi year trend line/ trend channel.
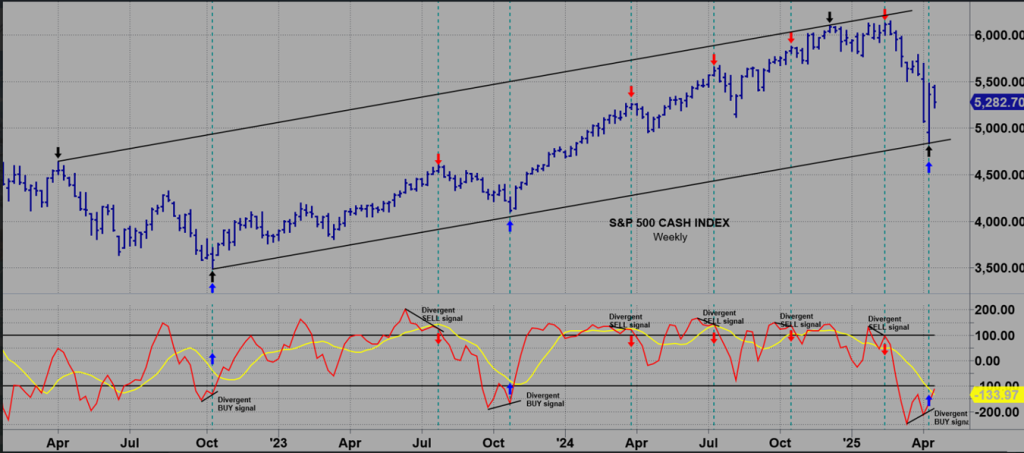
The bear presumption is Mr. Market will do his best to persuade the vast majority that a successful test has occurred before the real crash…Wave 3.
The bear case is we have witnessed a crash from the Feb high, not THE crash.
Breakage below the bottom of the channel will trigger a weekly Rule of 4 sell signal consistent with a powerful Wave 3 decline.