In the daily below of the 1929 crash the 36th trading day from high was October 23.
That is 6 squared days from the all-time Sept 3 top.
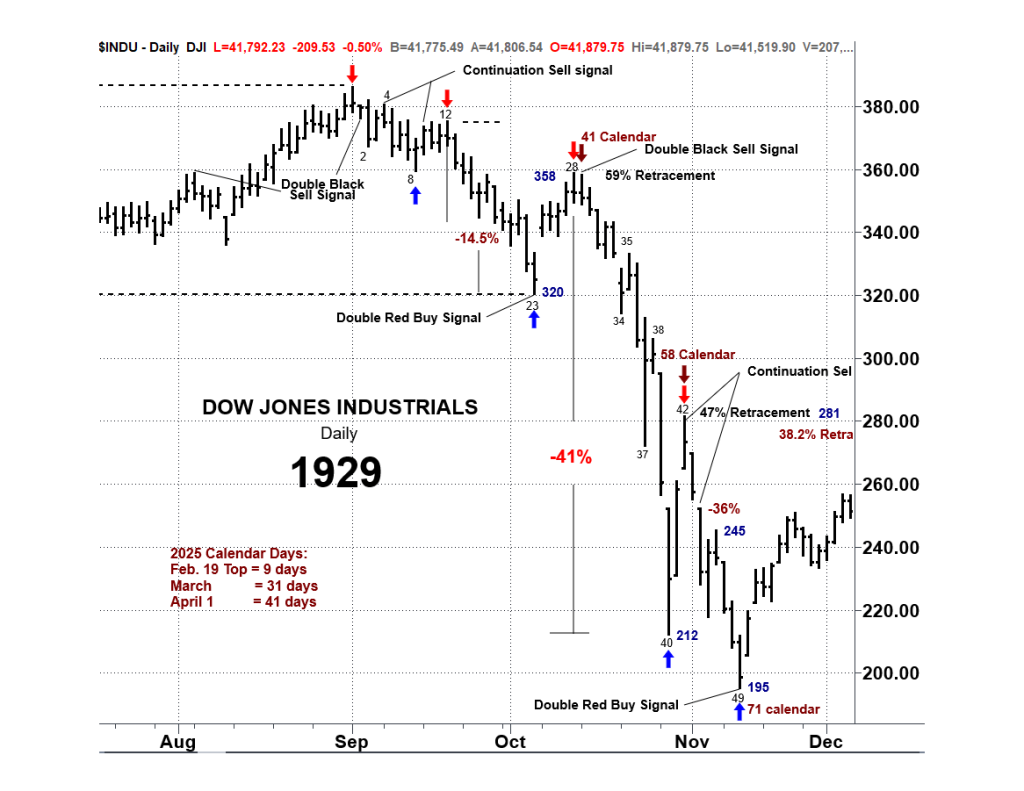
It was the day that set the stage for the crash. It was the day the Fat Lady sang.
You see the 34th trading day, October 21st was a Breakaway Gap below the 200 dma.
Oct 21 represented a failure of the 200 dma to act as support.
The DJIA had tested its 200 dma on October 4th and held.
On October 23 the DJIA dropped roughly 6%. That’s equivalent to a 342 point loss from the 5700 region.
On the 37th trading day from high, October 24th, 1929, the DJIA crashed but rallied back to close well off session lows.
On the 38th trading day, October 25th, the DJIA stabilized.
The next trading day #39, was Black Monday October 28th. The DJIA declined nearly 13%
Black Tuesday the 40th trading day from high the DJIA crashed 12%.
Yesterday was the 31st trading day from the Feb 19th peak.
If the analogue has any bearing, we are weaker than 1929.
If the analogue has any bearing the entire month of April is dangerous.
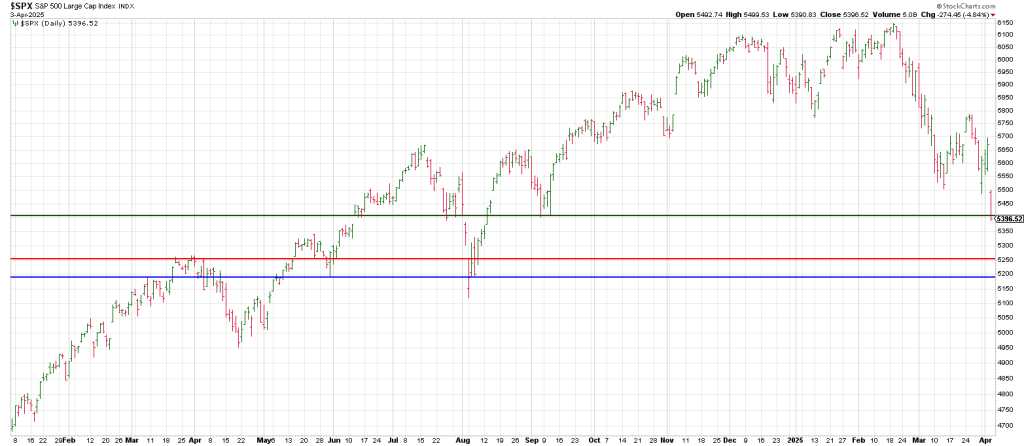
The SPX broke thru an important pivot on Thursday.
A weekly Bottoms Line connecting the October 2022 low and the October 2023 low comes in at around 5000 SPX.
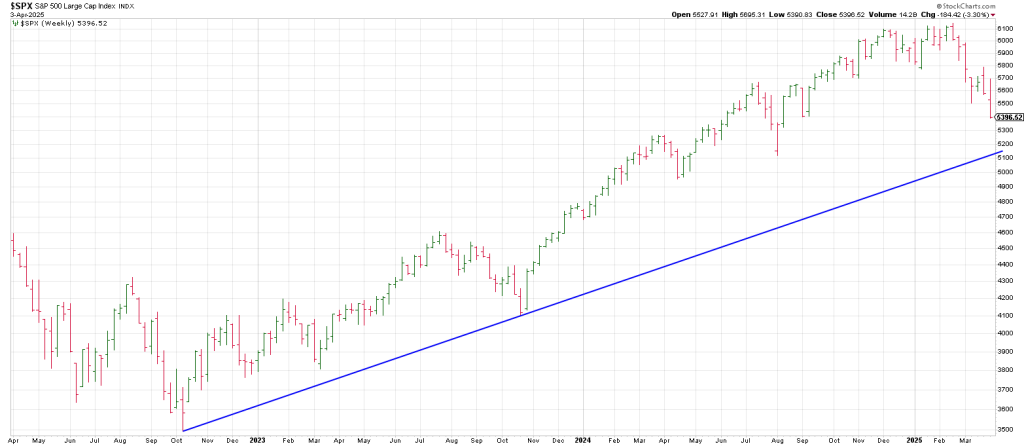
The scariest chart is the monthly showing the SPX is perched on a Bottoms Line connecting the March 2020 low and the October 2022 low
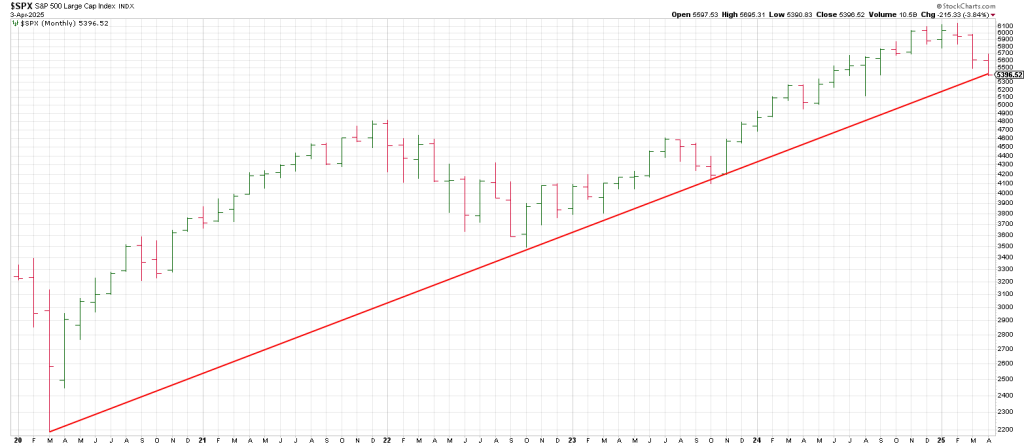
A Monthly Rule of 4 Sell is on deck in the heart of the Gann Panic Zone.
So when you hear we are oversold put it in the above context.
We were overbought for a long time.
A daily UVXY shows a breakout, a checkback, and a second breakout yesterday.
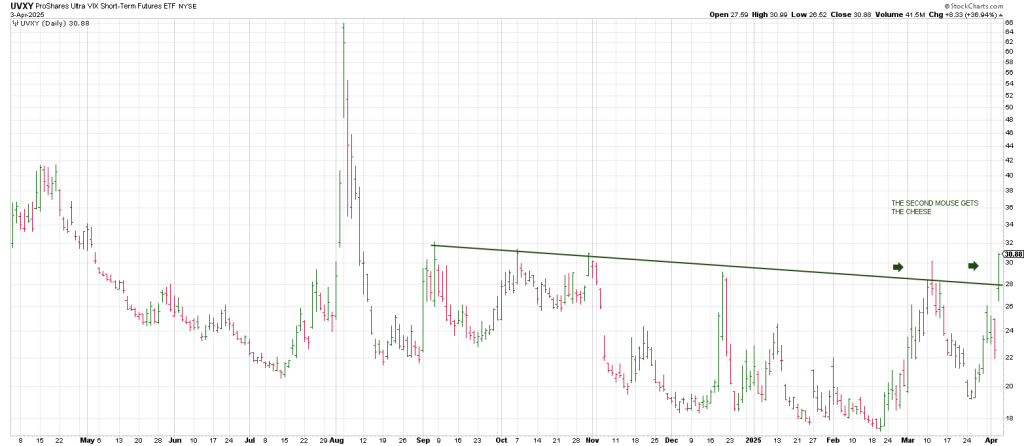
Is the second mouse pointing to a Black Monday?