1) ROOT
ROOT left a Reversal New High/180 buy signal last Friday, 3/21 on an OPEX Pinball play from 150 to 165 closing at 160.
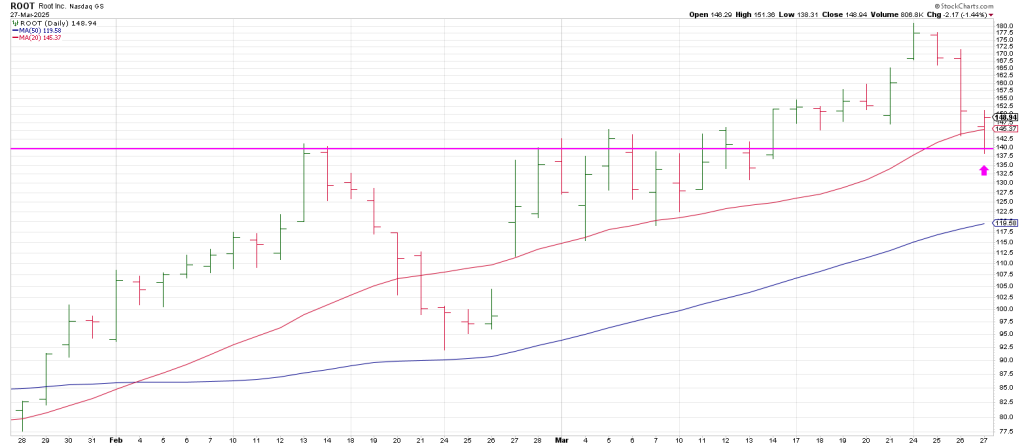
The next trading day, Monday, it gapped up closing at an all time high.
However on Wednesday it triggered a short-term Jump the Creek sell offsetting Monday’s open gap.
The Jump the Creek signal perpetuated a plumb-line drop to the 20 day moving average.
While the momentum of Wednesday’s decline carried over to an undercut of the 20 dma yesterday. ROOT tailed up closing near session highs leaving a Combo buy setup…one of my favorites:
A 1 2 3 Pullback (3 lower lows or 2 lower lows and an inside day) and a 180 buy.
The 180 because ROOT closed near session lows on Wednesday and near session highs on Thursday in the context of an uptrend….defined by a stock being above its 20 and 50 day moving averages.
2) WDAY
WDAY is in a downtrend driving more than 50 points in the last month to below its 200 day moving average a few weeks ago.
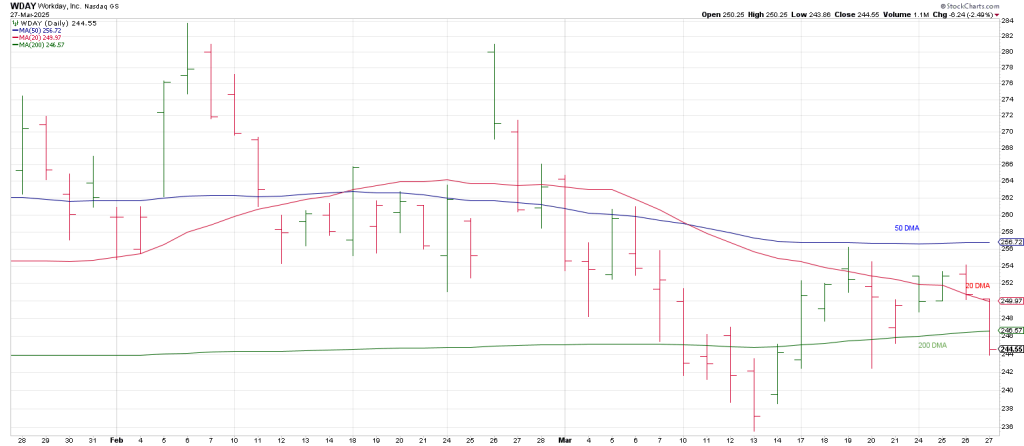
Notice how WDAY gapped up on February 26 but bearishly immediately offset the gap as it failed below its 50 day line.
Last week it rebounded to backtest its 50 dma leading to a test of its 200 day ma last week.
This week it reversed from a backtest of its declining 20 day moving averages.
I am always keying off the 20, 50 and 200 day moving averages for context.
On Thursday, WDAY lost the 20 dma with authority diving back below its 200 dma.
It looks like a test of the lows and the 240 strike is in the crosshairs for OpEx Pinball.
WDAY reversed from of 250.25 on Thursday to close below 245 opening the door for a drop to 240 theoretically.
3) BROS
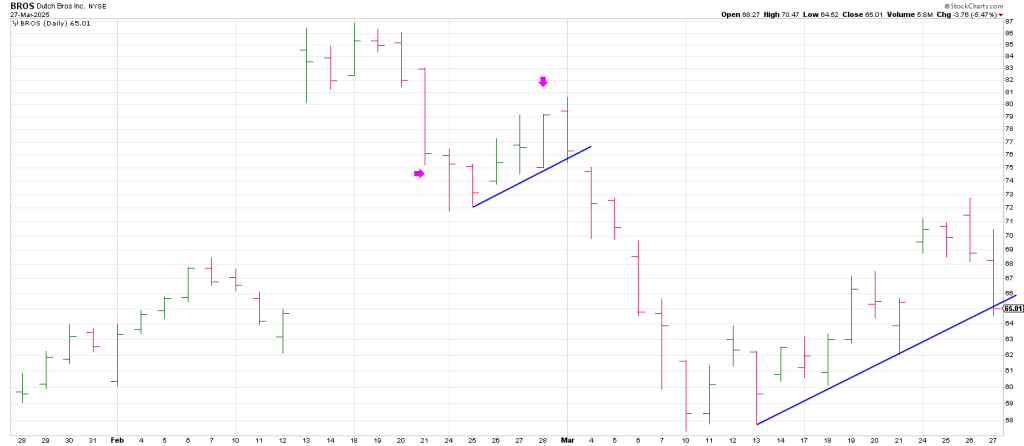
BROS spiked on earnings on February 13.
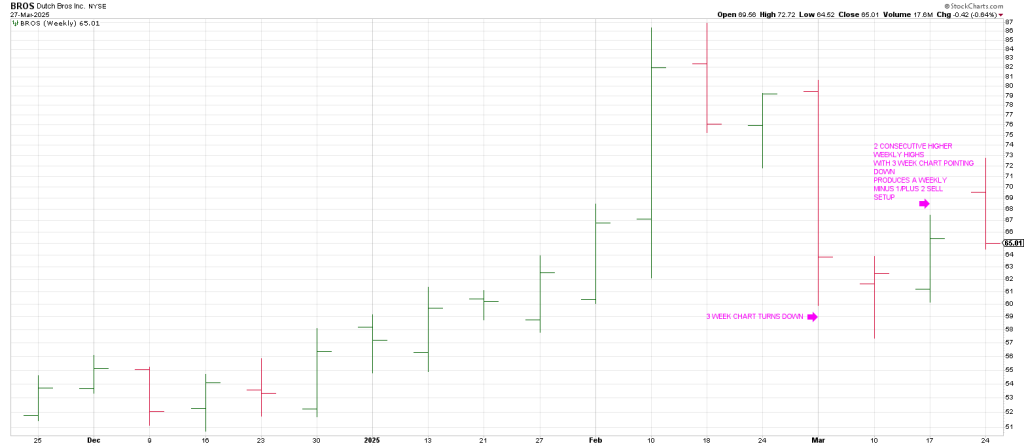
All trading, all setups are contextual. Part of that context for me is the moving averages and of course my Swing Method as defined by the 3 period charts, the daily, weekly, monthly and hourly.
Checking a weekly BROS shows the Buying Climax followed by a turndown in the 3 Week Chart to a test of the 20 week moving average which produced a 2 week bounce leaving a weekly Minus One/Plus Two sell setup this week.
Yesterday, BROS stabbed back below its 50 day moving average leaving an Expansion Pivot sell signal and a Jump the Creek sell signal as it offset the open gap from Monday.
A lot of stocks are in a similar position due to Monday’s sharp upgap in the market.
In sum, BROS looks like it’s rolling over from a Rising Wedge traced out from it’s March 10th low.
4) AVGO
AVGO is another name with a Buying Climax. This time in mid-December
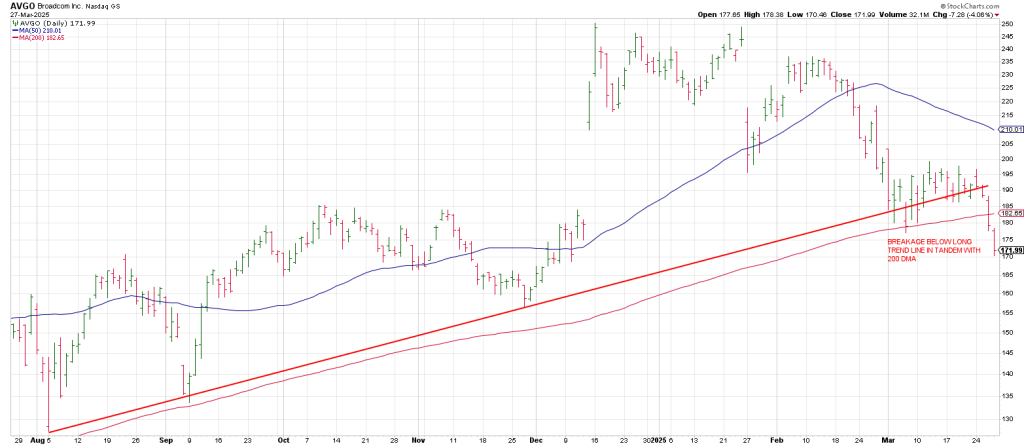
AVGO triggered a Rule of 4 Sell signal on Wednesday in tandem with breakage below its 200 dma.
It followed thru on Thursday. Today the 3 Day Rule comes in to play.
Markets play out in THREE’s. Often times momentum plays out in three’s.
Support from the December low in the 160 – 165 looks to magnetize AVGO lower for a possible OpEx Pinball setup today.
Breakage below 170 opens the down door.
5) DELL
We swung DELL long yesterday as it reversed to the topside.
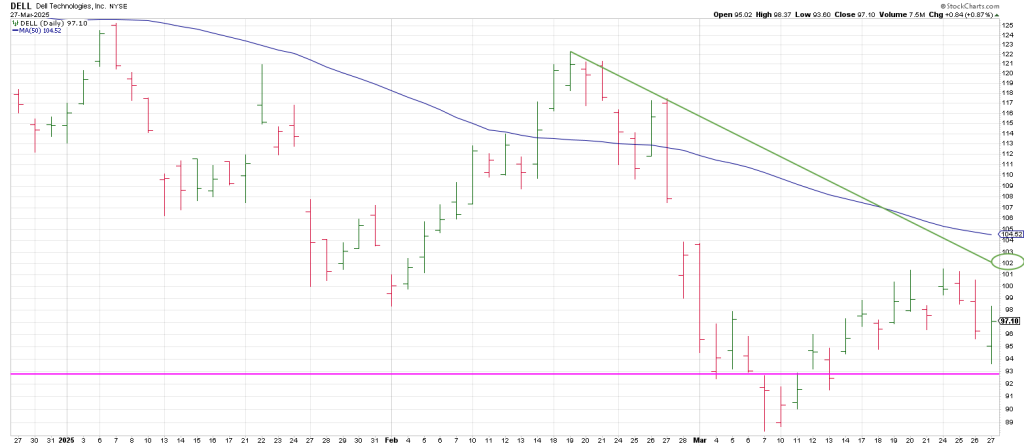
DELL’s 3 Day pullback undercut its 20 dma, yesterday morning but it was reclaimed with authority on an expansion of volume and looks like yesterday may have put in the right shoulder of misshapen inverse Head and Shoulders
DELL looks poised to test the 100 strike today
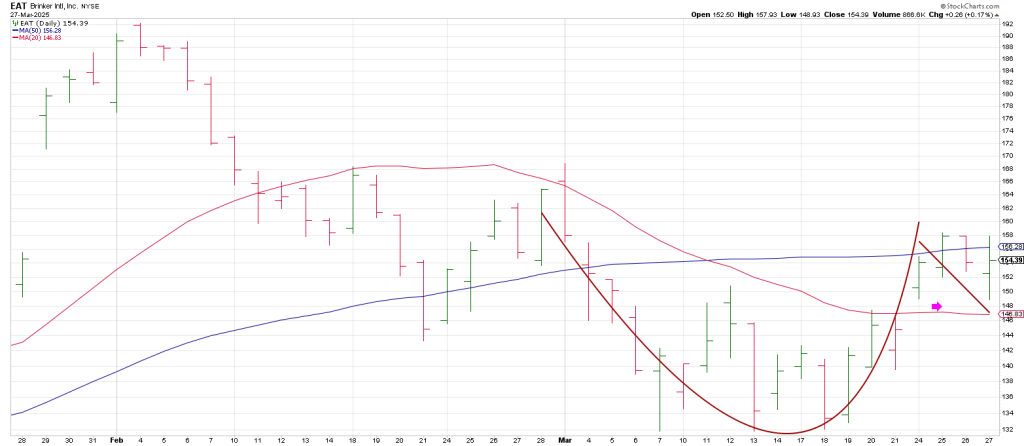
6) EAT
We traded EAT long a few times yesterday.
Basically it showed relative strength turning green before the market.
Notice that EAT rallied yesterday from above an open gap from Monday and above its 20 dma which is turning up.
Monday’s up gap triggered an Angular Rule of 4 Buy signal
7) CROX
CROX has shown superior relative strength in the last two weeks.
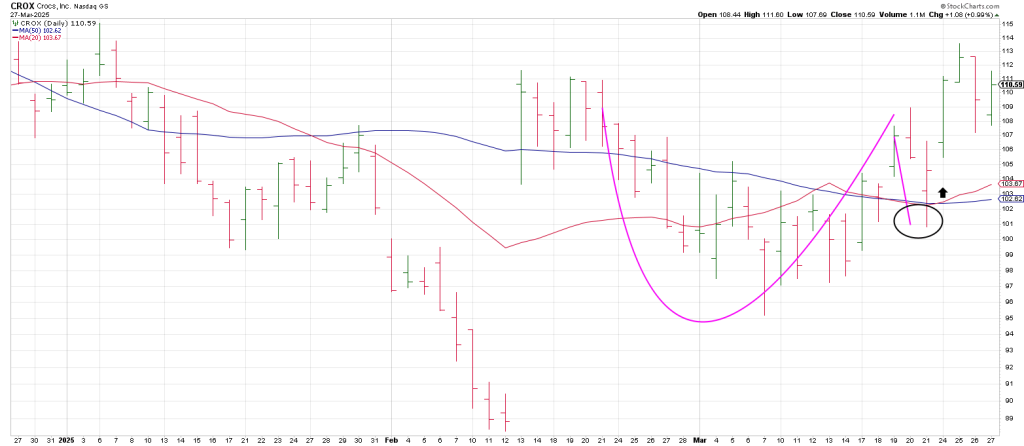
CROX recaptured its 50 day open March 17th and pulled back to test it last Friday.
The test perpetuated an explosion higher.
Wednesday’s pullback traced out what looks like a Cup and Handle.
CROX is poised to come out of the Cup and Handle.
8) OKLO
OKLO signaled the end of a Rising Wed on Wednesday as it knifed below its 20 day moving average in a failed attempt to reclaim the ‘20’.
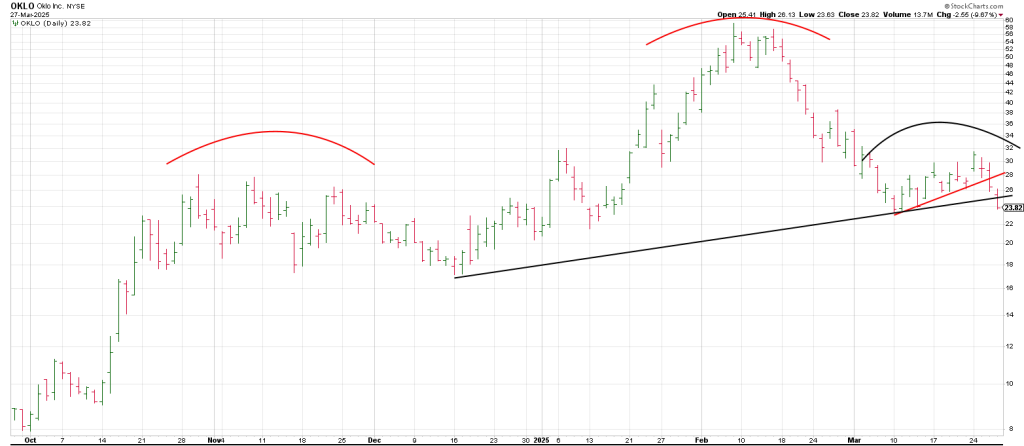
Fast moves come from false moves and we got a fast drop lower on Thursday.
Multiple time frame analysis pays dividends.
Checking the weeklies shows OKLO has traced out a massive Head and Shoulders top.
Yesterday it broke the Neckline theoretically opening the door to significantly lower prices.
9) GEV
We shorted GEV before the bell on Tuesday on an ‘Overnighter’…looking for a Gap and Go decline on Wednesday.
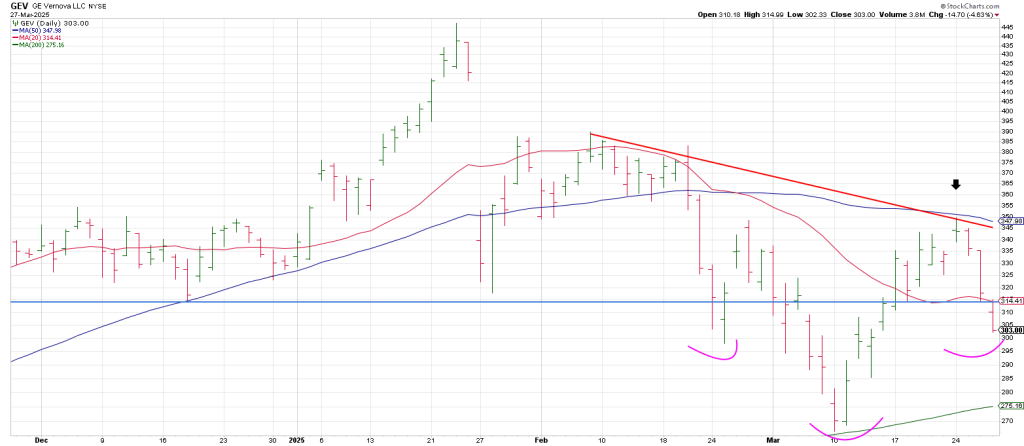
GEV left a stealth sell signal on Tuesday.
Having backtested its declining 50 dma it sold off into the bell on Tuesday setting up a Jump the Creek sell on an little downside follow thru on Wednesday.
The longs were sitting on a lot of profits and offsetting Monday’s gap would trigger profit taking.
Moreover, a backtest of the 20 dma following a drop below Phil D Gap was reasonable.
That was 15 points lower setting up a nice risk/reward short play.
As well, the pattern suggested GEV was potentially vulnerable to being magnetized to the low 300’s theoretically satisfying an inverse Head and Shoulders.
These Hit and Run patterns benefit immensely from the Square of 9 Wheel which integrates time and price.
This Time/Price Calculator does a good job defining support and resistance and defining risk.
If you can’t measure risk, you can’t manage risk.

Square of 9 Wheel
Purchase your own Square of 9 Wheel. Shipping to US only. Contact Jeff for shipping outside the US.