“I know what I want,
But I just don’t know
How to heh, go about
Getting it” Manic Depression, Jimi Hendrix
“Counting down from the 6147 all-time high we get the following 90 degree decrements down:
90 degrees down is 6068
180 degrees down is 5990
270 degrees down is 5913
360 degrees down is 5837”
We wrote the above in Wednesday morning’s Hit and Run Report, Notorious Big.
It was big. Thursday the market went into a tailspin. Midday Friday the SPX hit a low of exactly of 5837.65 satisfying a quick 360 degree drop of 310 points in SEVEN days.
“Seven is the number of panic.” W.D. Gann
Amazing.
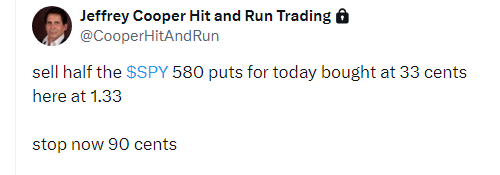
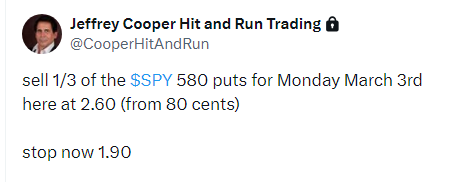
We covered a slug of puts bought on Thursday in the midst of Friday’s crimson tide.
This compelling geometry was ‘proved’ by an encore performance of Time and Price:
Why do I say an “encore performance of time and price” ?
The Square of 9 image below shows that the SPX closed at 5954 for a stunning Time/Price square-out.
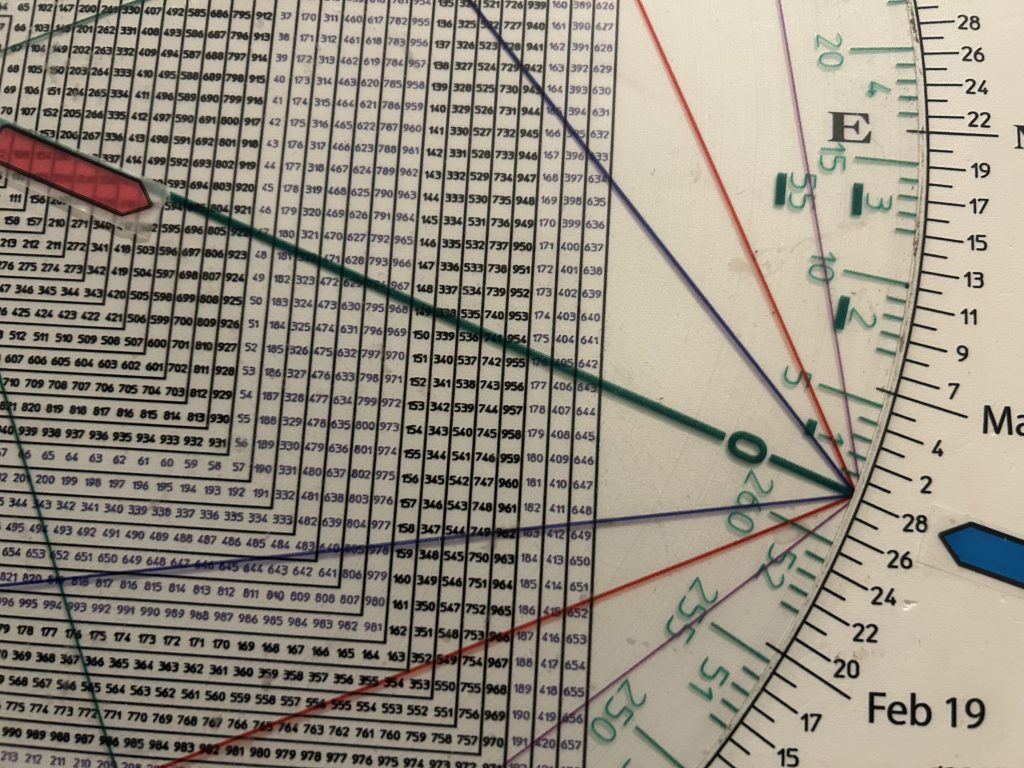
Feb 28 (blue) aligns with 594 (red…5940).
You can’t make this stuff up.
In the last 15 minutes alone the index spiked 55 points (interestingly a number that ties to the Gann Panic Zone …timewise).
It was an OpEx Pinball for the books with the SPY magnetized to the 595 SPY strike.
Still think the market is random?
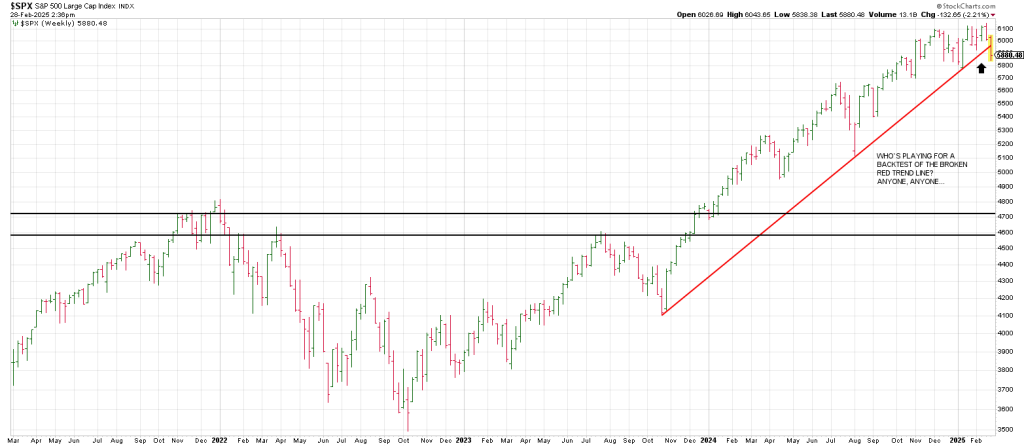
Thursday morning’s report suggested an immediate break of the trend line from the important October 2022 low was on deck.
We showed the following chart Friday morning showing the break.
An updated DAILY chart shows Thursday’s/Friday’s Train Tracks which implies a further push higher.
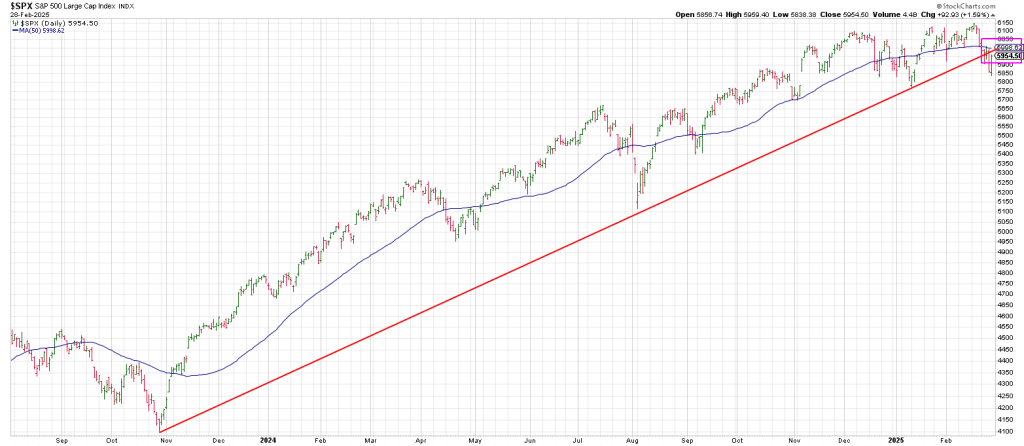
However, just above Friday’s close is the now down-sloping 50 day moving average at 5998.
As well as you can see from the above “square-outs” is 5990 which is 180 degrees down from the all-time high.
Both tie to a backtest of the broken trend line from October 2023.
So there is a technical trifecta the SPX must overcome if it is going to prove it has not carved out an important top.
Is the last 3 months a high-level consolidation or distribution?
I think the question is going to be answered with authority this week.
Monday and Tuesday …which coincides with projected tariffs against China, Canada and Mexico will determine what to expect for March.
If the SPX can produce two closes over its 50 day line it opens the door higher.
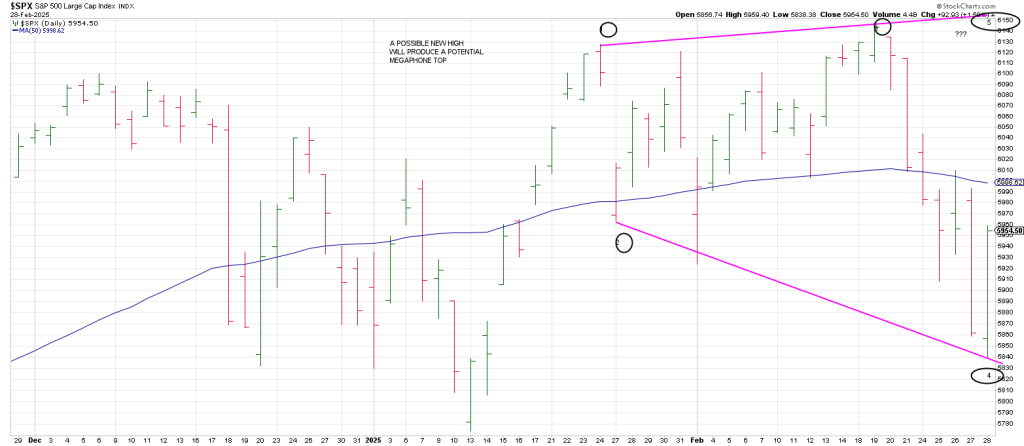
From my perspective, even IF an new record high is seen it will be another false new high.
A new high will buff out a 5 point Megaphone Top formation.
Either way the decline that started last week does not look complete.
I don’t expect a new high, primarily because the Gann Panic Window counting from what I’m counting as the orthodox high on January 24th opens early this week.
But this market is a hostage to volatility perpetuated by the Magnificent 7 abdicating their throne,
and more than half of stocks being below their 50 day moving average…and aggressive traders can find huge opportunities using the Square of 9 Wheel.
After all, if you can’t measure risk, you can’t manage risk.

Square of 9 Wheel
Purchase your own Square of 9 Wheel. Shipping to US only. Contact Jeff for shipping outside the US.
In sum, the SPX has seen a Flush of the Fifty (the 50 dma) 4 times since the early December high.
Each time the SPX caught itself by its bootstraps and reclaimed the Fifty.
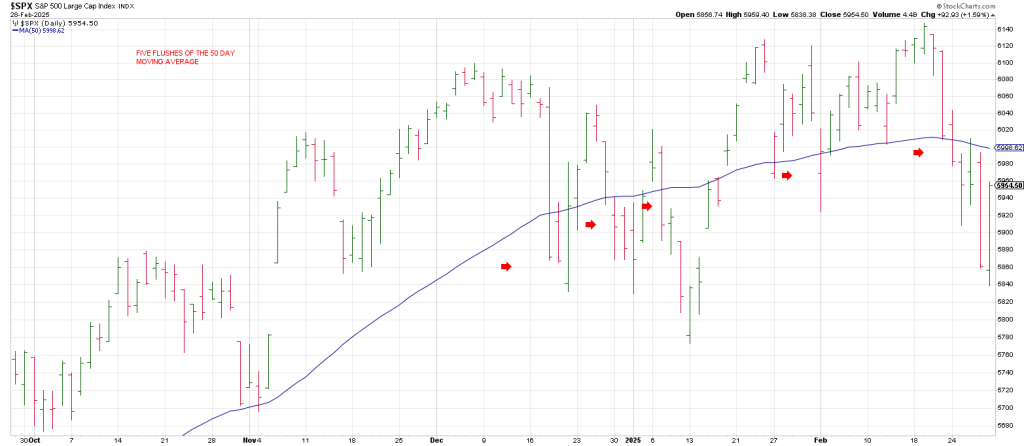
If it cannot reclaim and hold its 50 dma again…in this important time frame, the presumption is a break of Friday’s low will open the door to a slide and a cube-out 540 degrees down from the 6147 peak.