“My experience has taught me that nothing can stop the trend as long as the Time Cycle shows uptrend. Nothing can stop its decline as long as Time Cycle shows down.” W.D. Gann
“Come on the rising wind
We’re going up around the bend.” John Fogerty, Up Around the Bend
Late last year I flagged a Measured Move in the SPX.
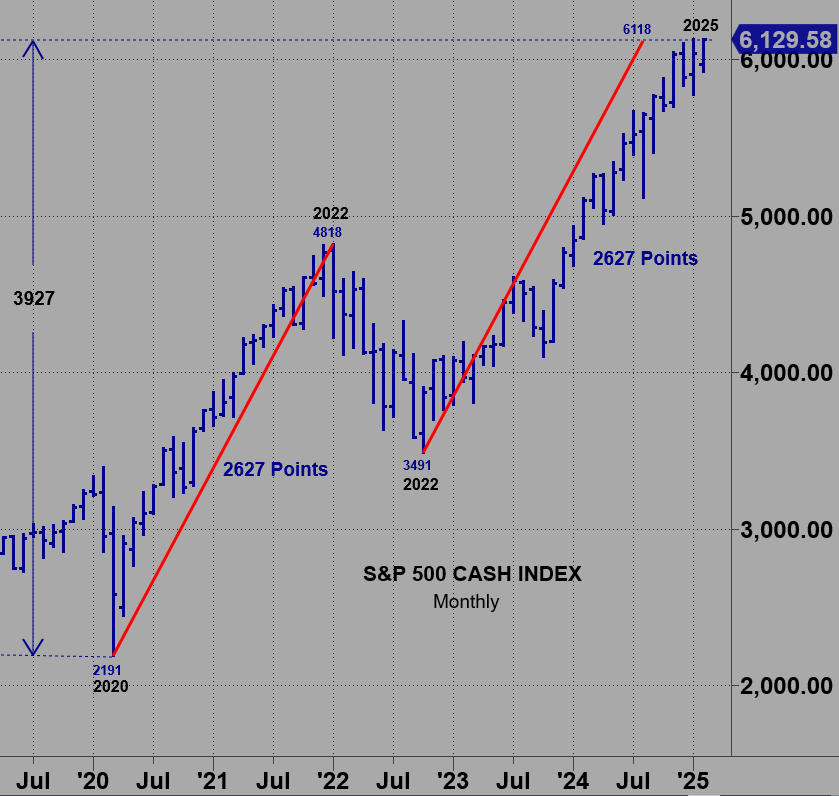
From the March 2020 SPX low at 2191 to the January 2022 high of 2818 points is 2627 points.
From the October 2022 low of 3492 adding 2626 points gives 6118.
The SPX struck a closing record high of 6118 on January 23, 2025.
The next day it made a nominal new high.
The following session the index gapped down 132 points.
Funny how market participants have seemed to forgotten that Flash Crash.
Indeed the Retail Army bought that “dip” and the SPX rally to test the 6118 peak.
Once again the SPX reversed with authority (on January 31st).
Once again the next session, it gapped down with authority…98 points.
Once again the “dip” was bought…with both hands.
Mr. Market clearly knows this 6118 number.
From these two recovery gaps, the SPX has chopped up to Wednesday’s nominal new all time high at 6144, a tad above the key 6118 level.
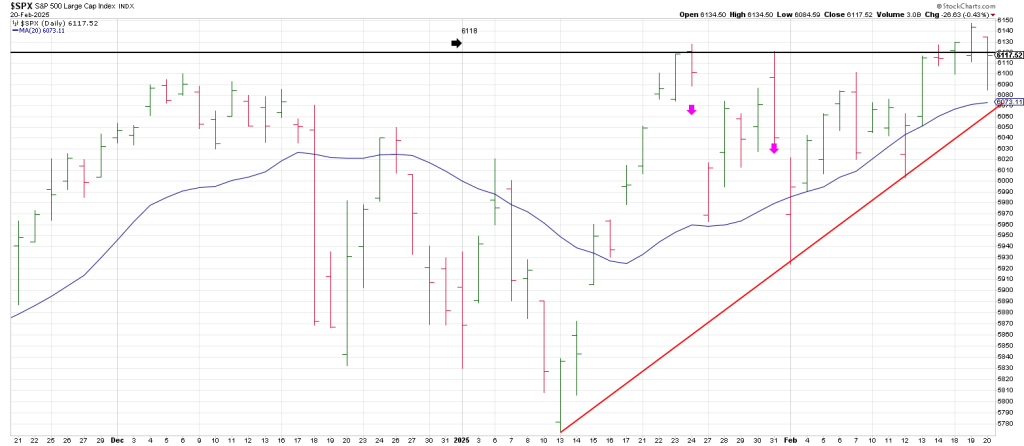
While Wednesday’s high eclipsed the key 6118 level it did not do so for long.
Thursday the index swan dived once again taking out 6118 by 33 points.
It looked like the agenda was breakage of the trend line du jour—this is a bottoms line connecting the lows for 2025.
It comes in at the 6070 region currently.
Someone didn’t want the SPX to get too close for comfort to that 6070 line in the sand.
The SPX had all day to flush it, but instead it went sideways until late in the session when it bounced satisfying a 50% retrace of the day’s morning decline.
After all was said and done, the SPX closed at 6117.52.
Can we say that’s close enough to 6118 to call it a direct hit.
You can’t make up this stuff.
As W.D. Gann said, “God geometrizes.”
So the question is was Wednesday a one day fake-out breakout above 6118?
Or, alternatively, does the SPX push higher from yesterday’s close?
Fittingly today is OpEx for the Mexican Standoff.
To polish off the forecast from yesterday’s report that indicates a high in league with the Measured Move at 6118, there is an epic time cycle that hits TODAY.
What is one of the most significant lows of the last 50 years or so?
There are two.
The first was December 9, 1974.
The second was 1982.
The distinction is that while 1974 was a price low, the market went nowhere until 8 years later after the 1982 low when we impulsed higher.
What is the most important high in the last 50 years?
January 14, 2000 was the DJIA top.
From the December 9, 1974 low to the January 14, 2000 top is 9170 calendar days.
Adding 9170 to January 14, 2000 is February 21, 2025.
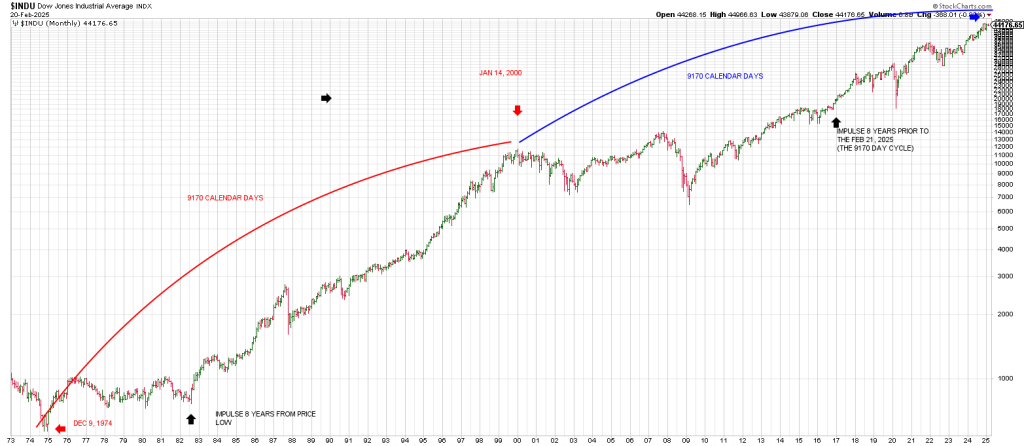
From 2025 we see that 8 years back is 2017 for a possible corresponding mirror-image foldback from the 8 year period from 1974 to 1982
Feelin’ lucky?