“Traders and Surfers both have to deal with feelings of missing out on the small ones, until the big one comes along. They also have to deal with feelings of staying with the big one.” Ed Seykota
The Roadmap was perfect on Tuesday…indicating an up opening reversal and a trend day down…
until the last 10 minutes when the SPX spiked to a record high.
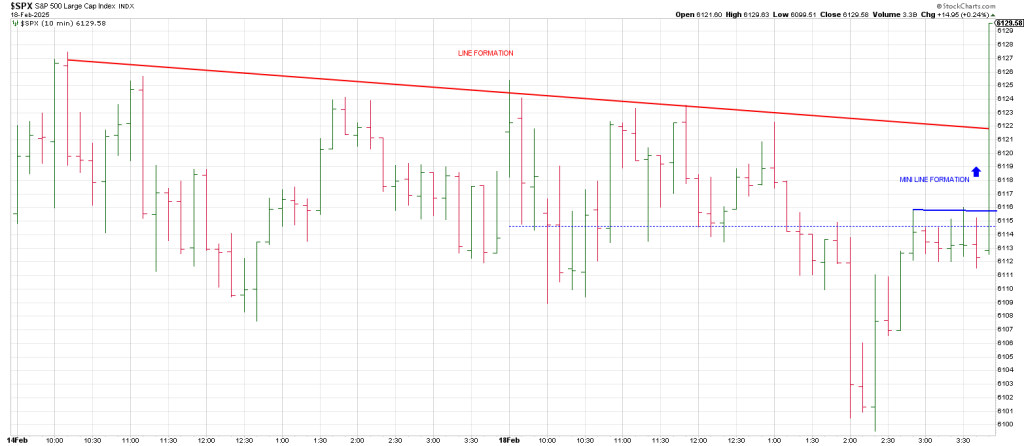
What Mr. Market couldn’t maneuver all day, he orchestrated in the last 10 minutes when there was no one to block the field goal.
All day to take offers and “they” wait til the last 10 minutes. Sure. That’s normal.
The 10 minute drive to a record close came on the heels of a 15 point downdraft going in the hours before the bell buffing out the smallest of outside up days.
The record close sets another historical milestone: the SPX finished up 14.95 points yet net advances registered only +485 on the NYSE and +233 on the NAZ.
Another stark divergence accompanying the new record close.
This strikingly mirrors the precise conditions of the October 11, 2007 market top—except that today’s divergence is even more extreme.
Let’s take a look.
The below array shows the top in October 2007 in this order:
The SPX
The A/D Line
The Transports
IWM
NYSI (New York Summation Index)
NASI (NAZ Summation Index)
NYA bullish % 200 dma
SPX bullish % 200 dma
NY High/Low
NAZ High/Low
Below is the same lineup for February 18, 2025
Tuesday was the 3rd new record high in the same region…6100.
The first was December 6.
The second was January 23/24.
Since the December 6th peak, the NYSE Advance/Decline Line, the Transportation Average and IWM have steadily declined.
The broader market has been weakening for over two months, while the SPX has managed only marginal gains in that time.
As showcased in yesterday’s report, this narrow advance has been driven by a few stocks, whose heavy weighting has kept the SPX afloat.
However the last of the Mohicans or should we say the last of the Mag-hicans, META, got scalped yesterday.
Yesterday we showed the following weekly META with the 3 Week Throwover suggesting a near term Buying Climax.
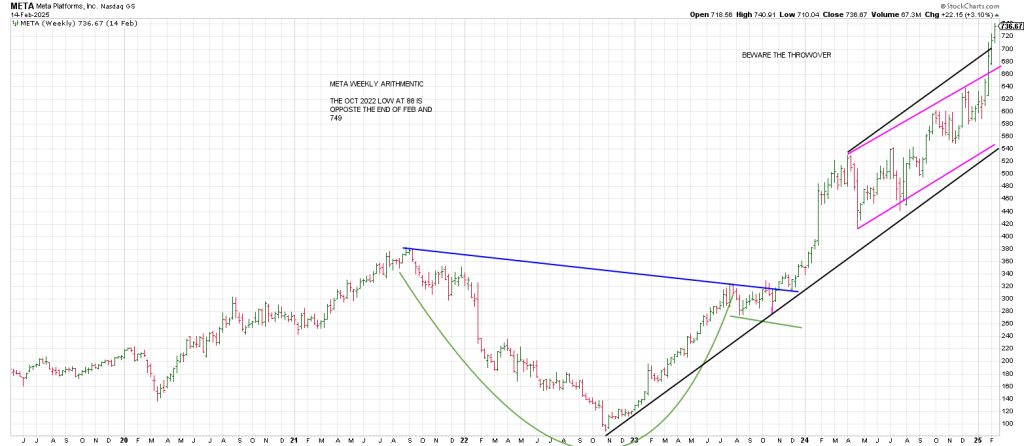
A minimum pullback to the top rail of the black trend channel is the presumption.
We got close yesterday.
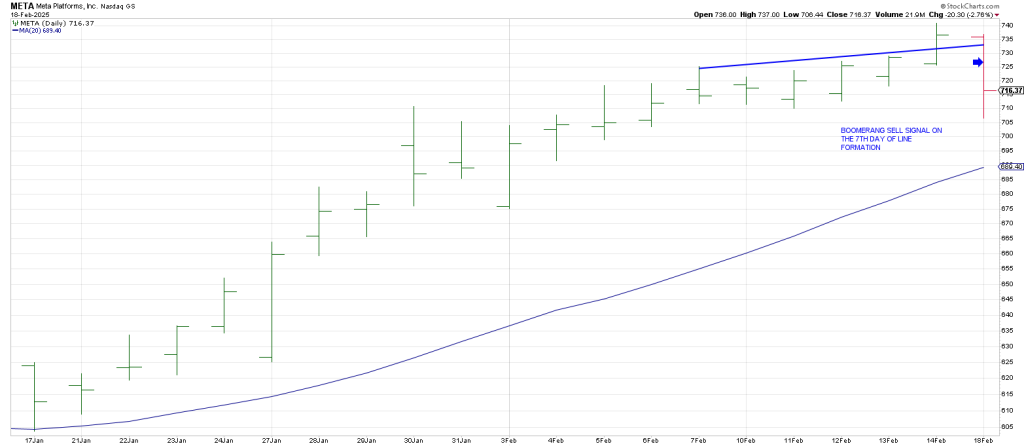
A daily META shows the Boomerang sell setup triggered on Tuesday.
A Boomerang sell occurs when a stock breaks out of a line formation and then reverses back through “the line”. META reversed on the 7th day of the Line Formation.

Drilling down to the short-term 10 min time frame shows a little tell tale Boomerang on Friday’s runoff.
Somebody always knows.
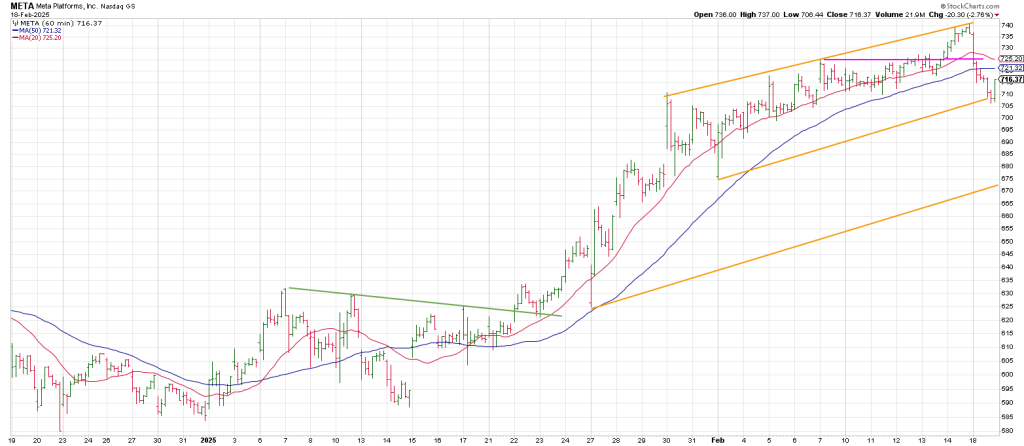
META was already down 14 points Tuesday when a down ORB was triggered at 722.16.
It dropped another 16 points before a sharp rally in the last 10 minutes along with the market.
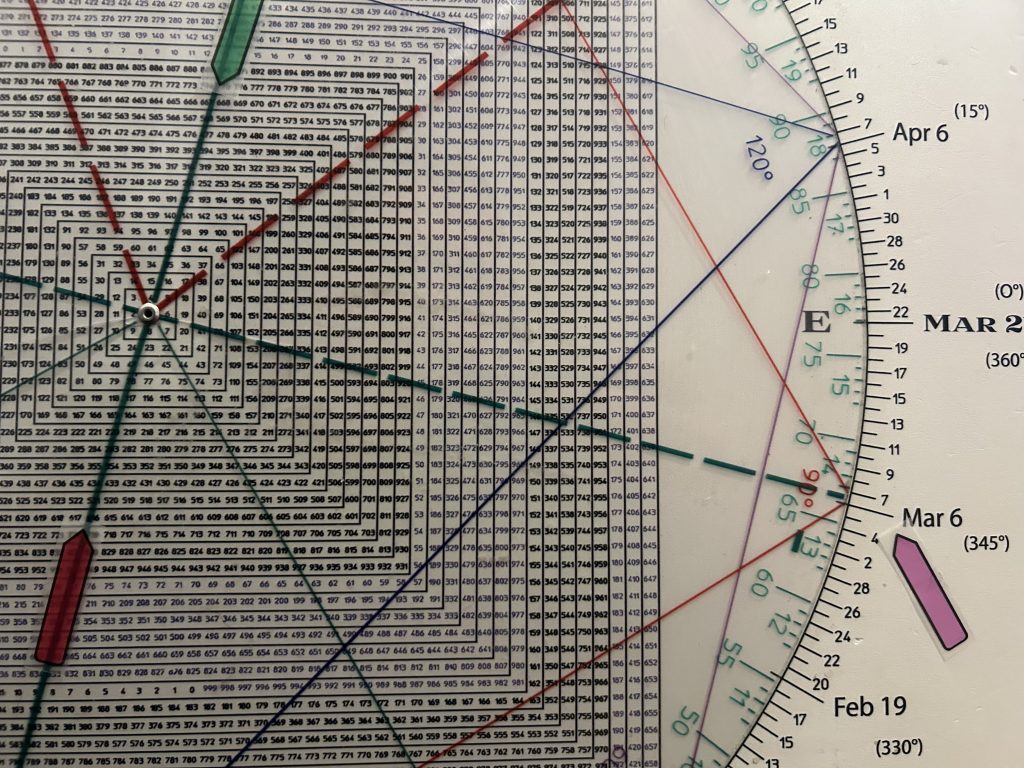
From the 741 all-time high 90 degrees down is 716.
META’s late rally to it from its 706 low to close right at 716.
An hourly META shows its 20 and 50 hour ma’s are just overhead at 721 to 725.
If META rolls over, 180 degrees down ties to 688 and the 20 day moving average.
I never cease to be amazed at how the square-outs in a stock so often line up with the 20 and 50 day and hourly moving averages.
Today squares out with 697 just below yesterday’s low.
A drop below yesterday’s low puts META in the Plus One/Minus Two buy position.
There are two ways to look at this.
Because the META’s momentum the last 3 weeks was so powerful you would think the first +1/-2 would be a buy setup.
Alternatively, META was so overdone, that the reversion to the mean may not perpetuate a good rebound…unless you are very agile.
Keep in mind, breakage below the upper rail of the magenta channel opens the door to an ugly fall.
In sum, we have a new record SPX high but at a major inflection point.
6114 is 1080 degrees up from the August 5119 August low.
1080 is 360 X 3 or 540 X 2…two cubes.
It is an important measurement.
As well the anniversary of the 2000 NAZ peak and the 2009 bear low are in the first week of March.
So this is an important anniversary.
March 6 is also 90 degrees square the Dec 6, 2024 pivot high.
We are just 30 points from 6160, a level we flagged a month ago as important.
Let’s take a look.
Moving the decimal point gives 616.
On the Square of 9 Wheel 616 is straight across and opposite 667, the low in 2009.
It forms a T-Square with that and March 6, the day of the low in 2009.
Upside follow thru that sees the SPX Boomerang back through this one month flat (and 3 month flat) will issue a Boomerang signal.
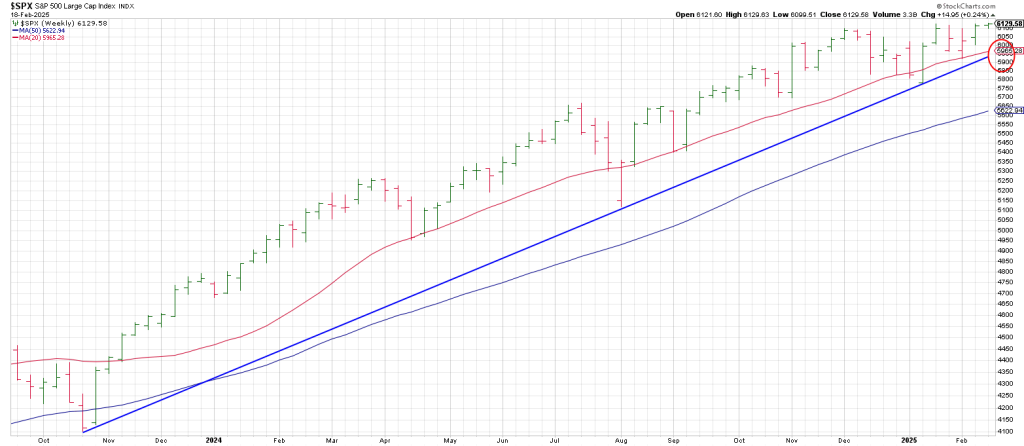
That should open the door to a drop below 5900 which defines a 3 point trend line from the October 2023 low.
A Rule of 4 Sell below the 5900 region opens the door to a 10 to 15% correction.