“I can’t help about the shape I’m in” Oh Well, Fleetwood Mac X Haim
“Time is defined as a repeated sequence of existence that occurs in an irreversible and immutable succession from the past, through the present, and into the future. From a geometric standpoint, time cannot be a line; it is a circle. A circle represents 360 degrees, and a measured unit of time ends and begins at the very same point in space – at zero degrees. There is no geometrical difference in that regard; the beginning and end are one in the same. However it is important to understand the nature of time with respect to its measurement. Time may be a circle, yet it exists within multiple spheres. Each sphere represents a metaphysical or theoretical level of reality. In mundane life, time is measured in minutes, seconds, days, months and years, but this is all centered on Earth. These all fit the definition of time, but so do the rotations and orbits of other planets. Therefore, they represent an additional means of measuring time.” Gianni Dipoce
“Suppose time is a circle, bending back on itself. The world repeats itself, precisely, endlessly.” Alan Lightman
If markets are deterministic, then they can’t help the shape their in.
And that’s a good thing for those who don’t believe the market is random and can’t be timed
I have been trading the markets for over 37 years and have been timing them since 1996 when I started my newsletter Hit and Run Trading, named for the two books I wrote in the late 1990’s.
I have found that ‘catching the turn’, as elusive as it is, is often where the best money is.
At the same time, we must be mindful that looking for The Turn flies in the face of fast moves and fast money: as W.D. Gann stated, “The most money is made when fast moves and extreme fluctuations occur at the end of major cycles.”
At the end of major cycles these extreme fluctuations see markets shake off air-pockets to make new highs.
Every dip and dive is seen as a buying opportunity.
The tape becomes very alluring to those bullish of the market.
Catching The Turn in the midst of this froth, is like trying to catch a wave at the sinister Pipeline in Hawaii.

On December 23rd we wrote a piece, Every Generation Speculates Once wherein we quoted George Orwell, “Every generation imagines itself to be more intelligent that the one that went before it, and wiser that the one that comes after it.”
If Orwell were a market observer he might well have coined the phase, “Don’t confuse brains with a bull market.
The bull mints geniuses of those who kneel at the altar of the greater fool theory.
In the article we showcased the cycles of generational tops and the Biblical Jubille 50 year cycle.
It too one-half that cycle or 25 years for the 1929 high to be exceeded.
A new secular bull market started in 1949.
From 1949 to 2024 is 75 years (1 1/2 Jubille Cycles).
From the 1932 post-crash low to the big 1982 low is 50 years, one Jubille Cycle.
The real Roaring Twenties bull run started in 1924 as demonstrated in this space last fall.
From 1924 to 2024 is 100 years, two Jubille Cycles.
From the 1924 low/impulse to 1974 is 50 years.
A momentous Low to Low to High Cycle may be on the table: 1924 to 1974 to 2024.
Is it possible a mirror image fold back from late 2024 will play out that sees the market decline opposite to what it did from 1924 to 1929 into 2029?
In other words, a 5 year bear market?
That would mark 100 years or two Jubille Cycles from 1929.
The market is notorious for regular 5 year cycles:
1932-1937
1982-1987
1995-2000
2002-2007
2020 to 2025?
Speaking of 1932, there are some Elliott Wave analysts who believe we are culminating a Super Cycle that started at the July 8, 1932 low.
That is 1111 months ago.
Some think 1111 is very symbolic, an alignment of the highest order.
In numerology 1111 is considered to be a significant moment in time for an event to occur.
It is seen as an example of intense synchronicity.
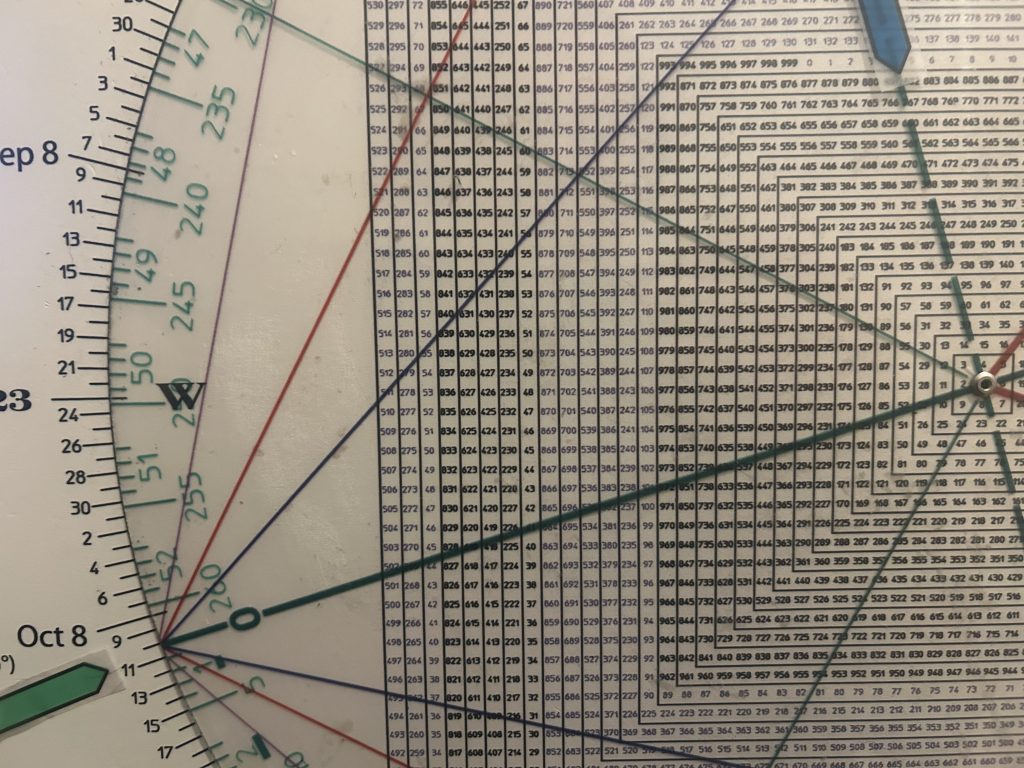
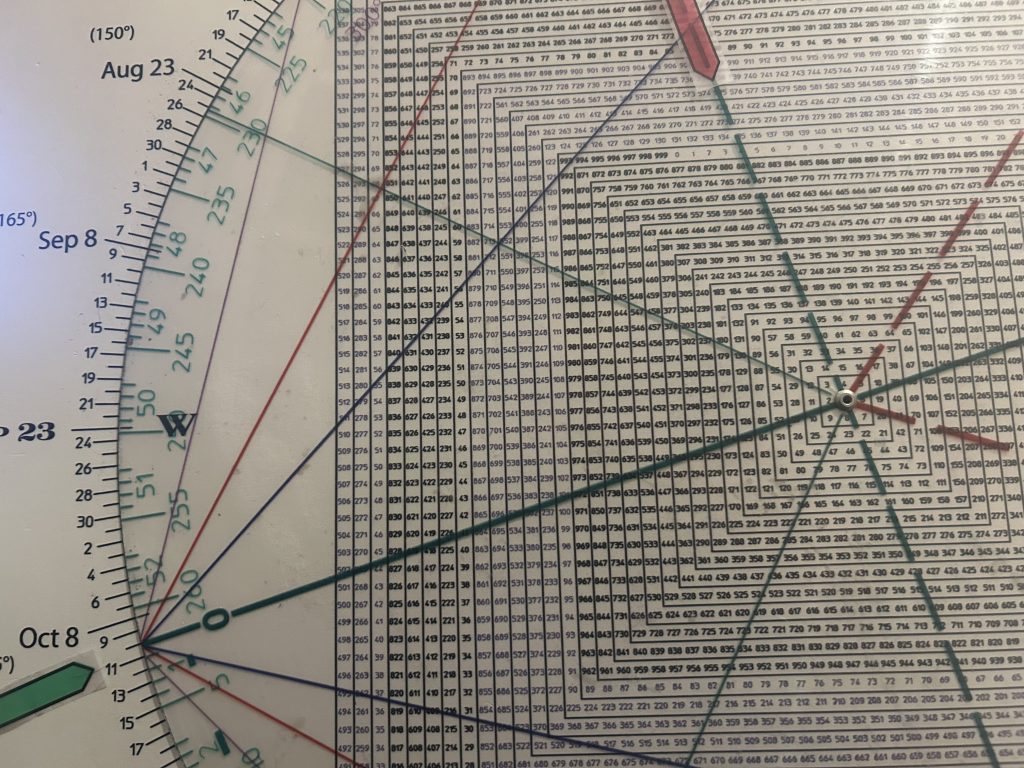
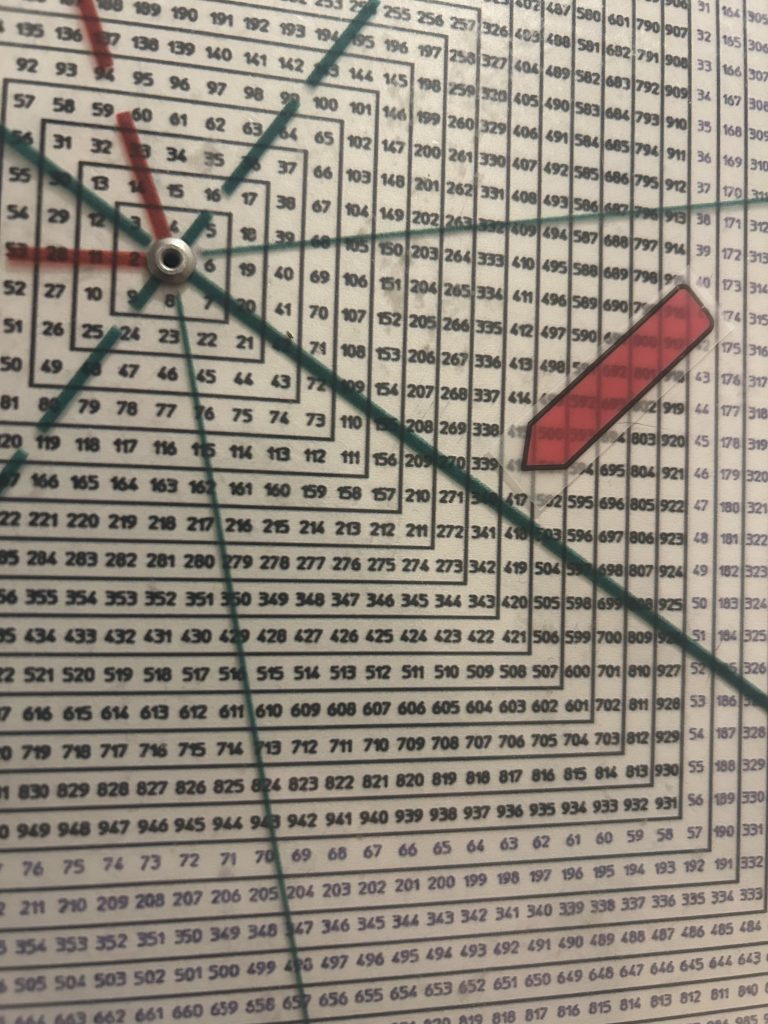
Maybe something, maybe nothing, but on the Square of 9 Wheel 1111 is on the same axis as early September and early March.
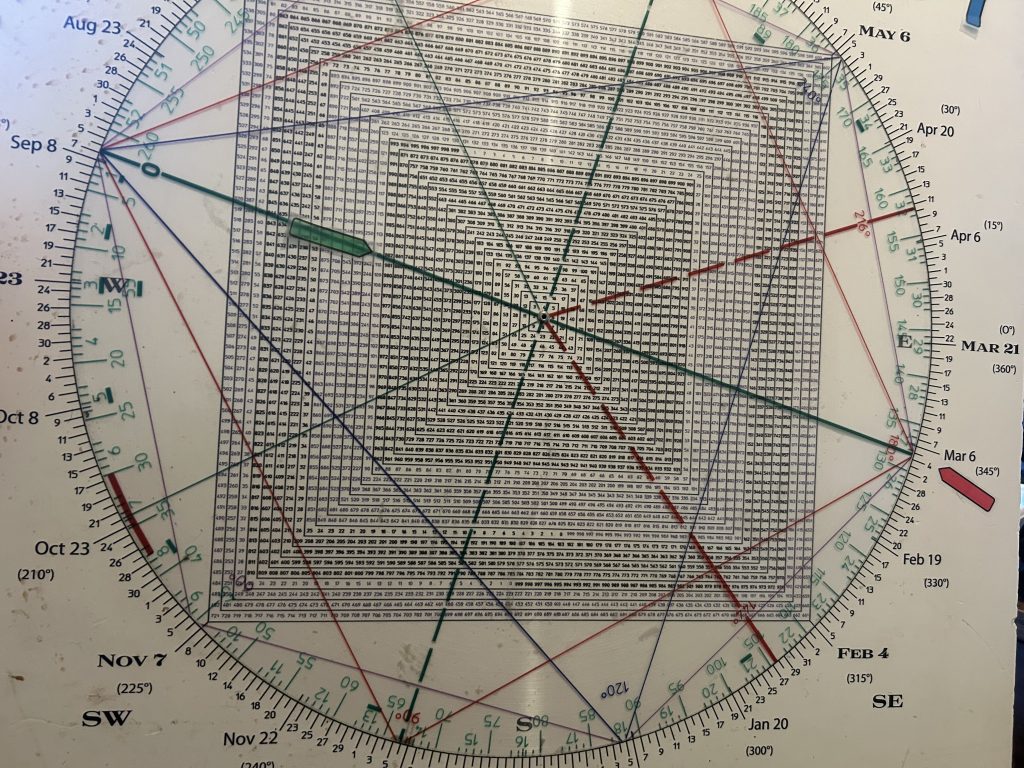
Early September and early March are 180 degrees straight across and opposite.
Of course, early September 1929 was the top prior to the Great Depression; early March 2009 was the low of the Great Recession.
Some interesting synchronicity.
Intriguingly, these dates form a T-Square with 667, the 2009 low as well as with December 6.
Place image Z here
December 6, 2024 was an all time high in the SPX. It was the first time the SPX ever reached 6100.
It was nearly 3 months ago and the index is still hovering at the same level.
March 6, 2025 is 90 days/degrees from that December 6th, 2024 pivot.
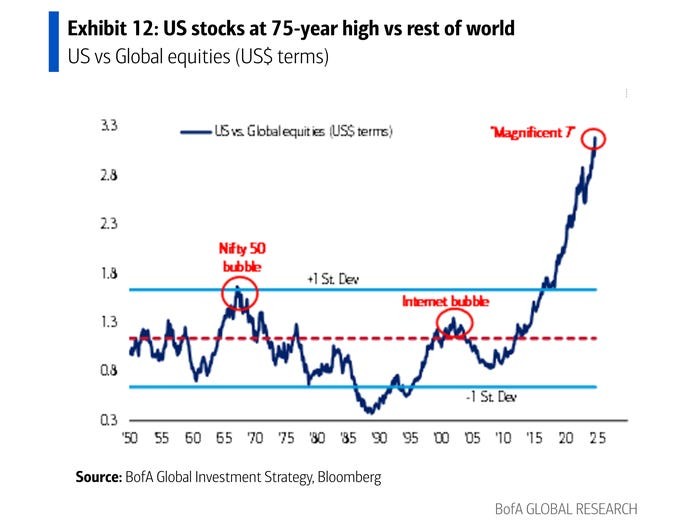
Last week Bank of America said that growth stocks are in a bubble exceeding the ‘dot-com’ and ‘nifty fifty’ eras—and warns they could take the SPX down 40%.
The Nifty Fifty era was the late 1960’s/early 1970’s.
A generation later we had the Dot Com era.
The argument is a least partially based on the market cap of US stocks compared to the rest of the world.
As well the top five companies as a percent of the SPX market cap is at a record. META being the poster child for this concentration.
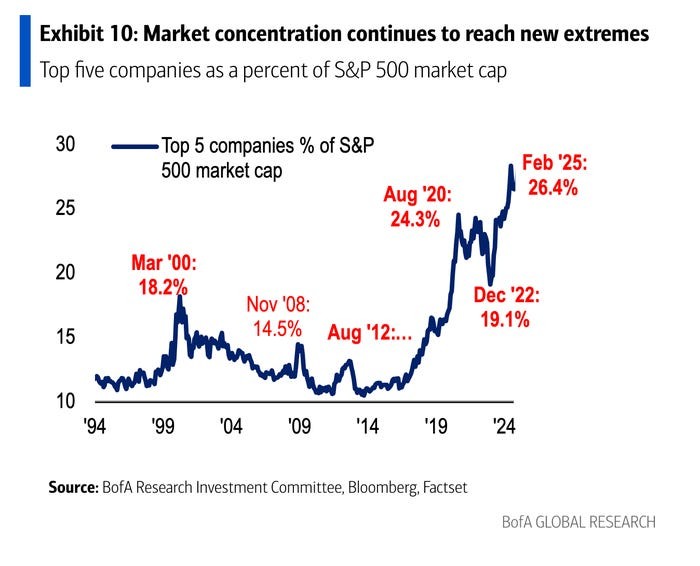
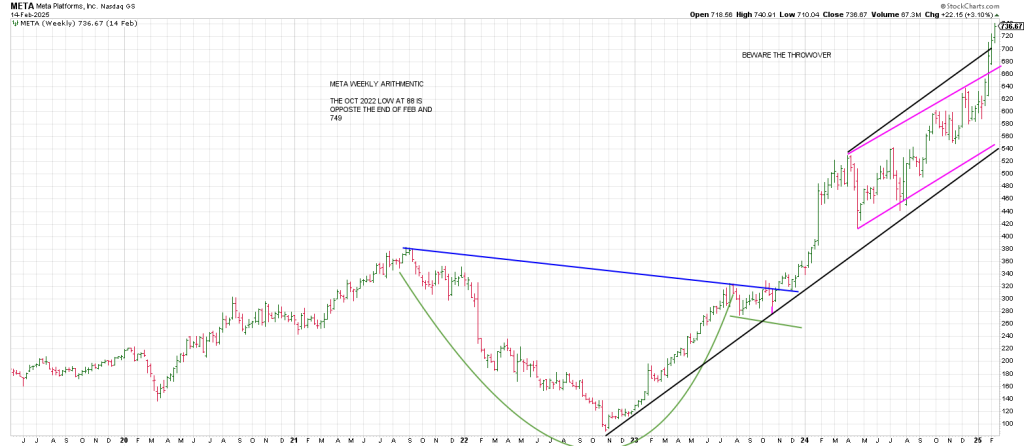
Part of the reason why META can have a 20 day win streak record is related to how the market has gotten so concentrated, due to passive investing enabled by ETF’s.
Essentially investors shovel money into ETF’s indiscriminately that in turn plow money into the ETF’s with utter disregard for valuations and fundamentals.
Wait a minute I thought Wall Street was all about valuations and fundamentals?
None of this matters….
Until it matters.
You can have all the divergences in the world such as new highs without confirming A/D Lines, Hindenburg Omens (we have 3 on the clock currently).
Friday was the largest breadth divergence in history at an all-time high.
Time Turns Trend. Not price.
We all know that markets can get extremely overbought and oversold (I’m not talking above overvalued or undervalued by whatever metrics you choose to use).
That being the case we should focus on time versus price… as W.D. Gann succinctly stated, “Time is more important than price.”
While I am a short term trader and swing trader, I spend a lot of time on the big picture— I don’t like the risk of a wave cresting over my head.
I’ve been surfing enough to tell you it’ll curl your toenails.
In sum, my philosophy of markets is based on the theory that stock prices move as a result of cyclical forces.
Cycles are important for market timing because they repeat with a good degree of regularity.
The T Rex in the ointment is that at any one time there are several cycles acting simultaneously on the market.
This makes analysis a more difficult process than a simple mathematical formula.
This is where my Square of 9 Time/Price Calculator can help to nail down turning points in league with major cycles.
You need have no understanding of why the Square of 9 works, just that it does work. I and many of the subscribers to the Hit and Run Report have been using “The Wheel” to nail turning points in the market and individual stocks for the last two decades.
This is one of the things that distinguishes my service from so many other technical services—my original work integrating Time and Price.
For example, we called the week of the bottom in 2002 using the Square of 9.
The low was 768 SPX on October 10, 2002.
October 10 squares out with 767.
We forecast the top day in 2007…October 11.
October 11 squares-out with 1575. The high was 1576.
In February 2009 we forecast a major bottom for March 6, 2009.
March 6th squares 667.
The SPX bottomed at 666.79.
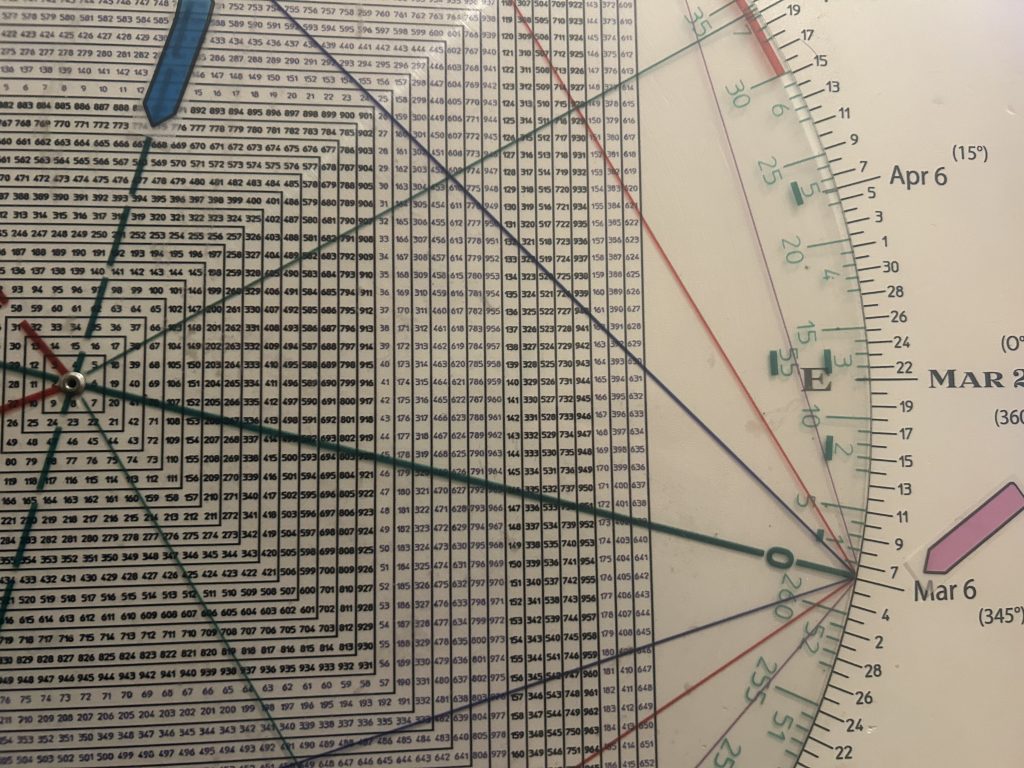
“When time and price square-out expect a change in trend.” W. D. Gann
There are other ways in which Time and Price square-out.
In addition to time and price dove-tailing at a low or a high, the price of a low can point to the price of a high (and vice versa).
The date of a significant low or the price of a significant low can point to a high in the future.
For example the NAZ struck a major low of 711 on December 9th, 1994.
This was the low prior to the massive advance to 5132 on March 10, 2000, the Dot-Com Bubble Top.
The closing low on December 9, 1994 was 719 on the NAZ.
719 squares out with March 10th.
Amazing.
(when working with the Sq of 9 Wheel you should consider the absolute low and the closing low).
The 5 year NAZ bull run from 1995 to 2000 was not without its shake-outs.
Likewise the current NAZ bull run from March 2020 low has not been uninterrupted.
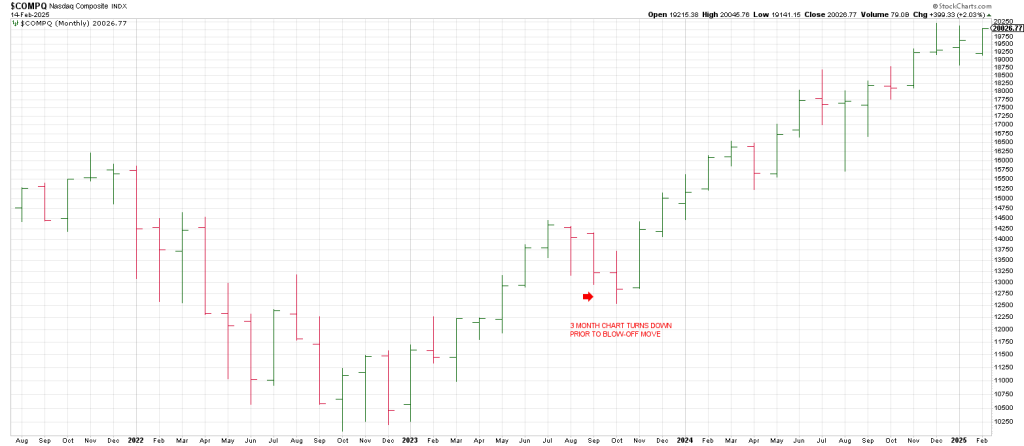
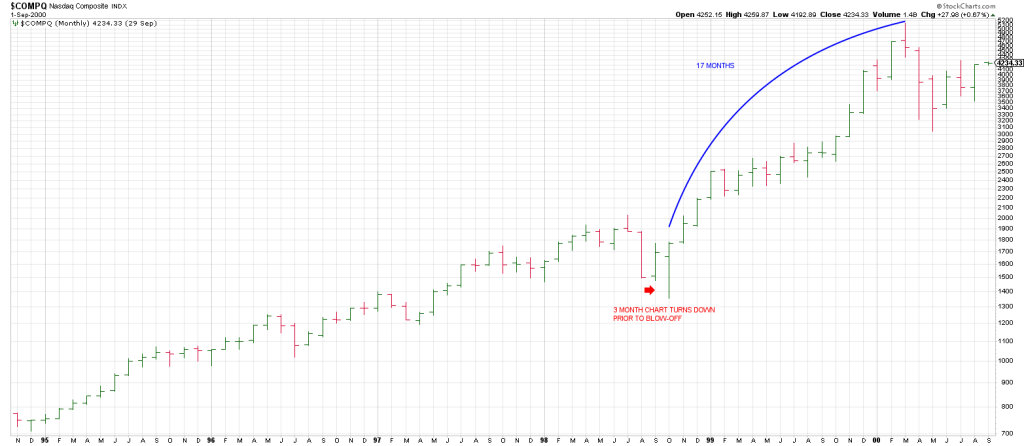
Interestingly the last leg of the NAZ advance into March 2000 was defined by a turn down in the 3 Month Chart in October 1998.
Similarly the NAZ has been in a powerful advance since its 3 Month Chart turned down in October 2023.
The last leg up in the NAZ was 17 months. The closing high occurred on the 16th month up. March 2000, the 17th month from the turndown of the 3 Month Chart was a large signal bar reversal month.
We are currently in the 16th month from the October 2023 turndown of the NAZ 3 Month Chart.
March will be the 17th month.
As well the price of a significant high can “point” to the date of the next major low. Even a crash —-as was the case in the Covid Crash.
The SPX top prior to the 2020 crash was 3393.
3393 aligns with/points to March 23.
The day of the Covid Crash low was March 23rd.
This is how we said on March 23, 2020 that the low was in.
We went on to say on that day that the wash-out should see the SPX rally to 4100.
Why? I surmised that if a major low had been seen the SPY should rally one full price cycle (at least) above the prior 339 peak.
360 degrees above 339 is 417.
The SPY hit 417 within a year.
Notice the March 10 high is the anniversary to the March 6-9 low in 2009, nine years later.
While the closing high in the NAZ in March 2000 was 5048 (504) which squares-out on February 13 on the Wheel, the date of the NAZ high in 2000 was March 10th.
Why? The last ditch rally in 2000 started in late January at 3748 (374) and 374 is opposite March 10 on the Wheel.
Gann left something out.
While all major highs and lows are square-outs, not all square-outs are major highs and lows.
It is the behavior, the price action, at a potential major square-out/turning point that will tell the tale of the tape.
There is a possible mega square-out coming up that we are doing a special report on for tomorrow for subscribers.
It is a level flagged at the beginning of the year, but now time is lining up.
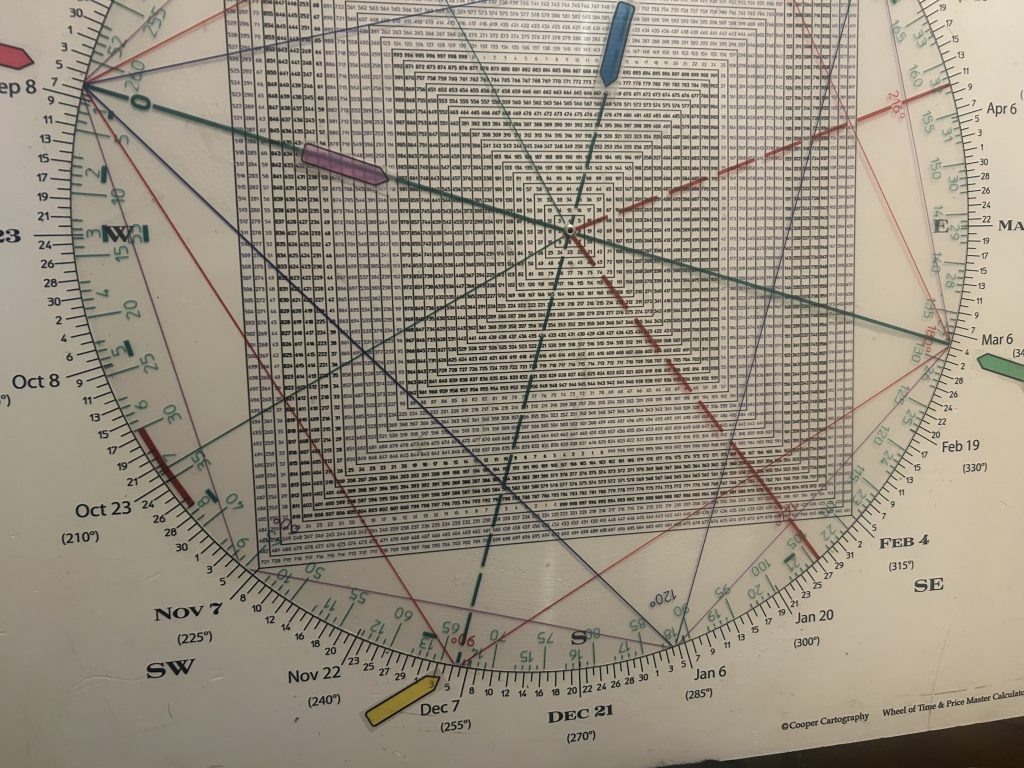
Conclusion. Was Thursday’s push above a 3 week flag formation a breakout or a fake-out?
The market has been “shape-shifting” for nearly 4 months.
Let’s look at the overlapping geometric cycles to what shape its in.
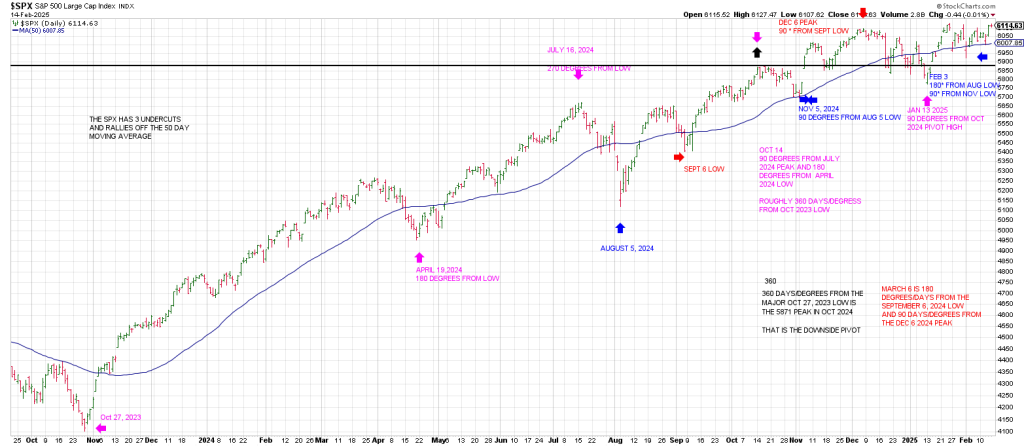
180 degrees the October 2023 explosion was the April 2024 low (magenta).
Another 90 days/degrees later ties to the July 2024 peak.
October 14th 2024 was 90 degrees from the July 2024 peak and 180 degrees/days from the April 2024 low.
As well it is roughly 360 days/degrees from the October 2023 low.
The SPX flattened out in October while under the surface individual momentum names skyrocket.
January 13, 2025 is 90 days/degrees from the October high.
The SPX dropped to 2 month low and ripped higher underpinning the geometry.
Starting from the August 5th Flash Crash (blue) we see a low 90 days/degrees later on November 5th followed by a big Breakaway Gap…the Trump Bump.
Another 90 days/degrees is February 3rd which marked a 2 day 200 point free-fall mirroring the August 5th Flash Crash, 180 degrees/days prior.
Isn’t that something.
The sign posts I’m looking at going forward are three-fold:
- 360 days/degrees from the major Oct 27,2023 low is the 5871 peak in October 2024. That is the downside pivot I’m using (the horizontal black line).
- March 6 is 180 degrees/days from the September 6, 2024 low and 90 days/degrees from the Dec 6, 2024 peak. Of course it is a major anniversary…of the NAZ peak in 2000 and the market low in 2009.
The 2009 low is 3 squared years from the 2000 top.
This March is 4 squared years from the 2009 low and 5 squared years from the 2000 top. - The last major low was Oct 27, 2024. Late April 2025 cubes-out with that low. In other words its 540 days/degrees from Oct 27, 2024…540 degrees being a cube.

Square of 9 Wheel
Purchase your own Square of 9 Wheel. Shipping to US only. Contact Jeff for shipping outside the US.