“The stock market is never obvious. It is designed to fool most of the people, most of the time.” Jesse Livermore
“You can fool some of the people all of the time, and all of the people some of the time, but you can’t fool all of the people all of the time. I think Abraham Lincoln said that. ‘I’ll let you be in my dream if I can be in yours.’ I said that.” Bob Dylan Talkin’ World War III Blues
As noted in yesterday’s report, Monday’s price action market a notable departure from the pattern observed in recent weeks.
Following sharp Monday declines on January 22 and January 29, the SPX and NAZ rebounded strongly the next day, surging above the prior sessions.
That rhythm has been primarily driven by aggressive retail dip-buying.
Goldman Sachs’ strategist Scott Rubner has highlighted an extraordinary surge in retail investor activity. On January 17, 2025, a record retail buy imbalance of $5.03 billion was observed, marking the largest on record. This extreme record imbalance was closely followed by a $4.89 billion imbalance on a subsequent day. Such aggressive buying by retail investors has been instrumental in sustaining market rallies, often preventing the significant pullbacks anticipated by institutional investors.
While the market did not see a sharp Monday decline this week there was scant follow thru from Monday’s Gap and Go on Tuesday.
In fact while the SPX was down 20 points at its lows on Tuesday and eked out a nominal green close, there was blood on the table.
TSLA -23
DUOL -18
CAVA -10
ALAB -10
RDDT -9
RH -18
CRS -7
COHR -6, etc etc etc, to mention a few.
There were pockets of strength:
SHOP, IBM, ADBE, AAPL, UPST (after the bell on earnings), and MDB out of the gate.
But mostly Tuesday was notable for the persistent selling in broken names and profit taking in recent winners…all under the I V of a sedated market.
Is retail playing into the hands of the institutions?
It begs the question are the 9 1/2 weeks since the early December 6100 high distribution or a high-level consolidation?
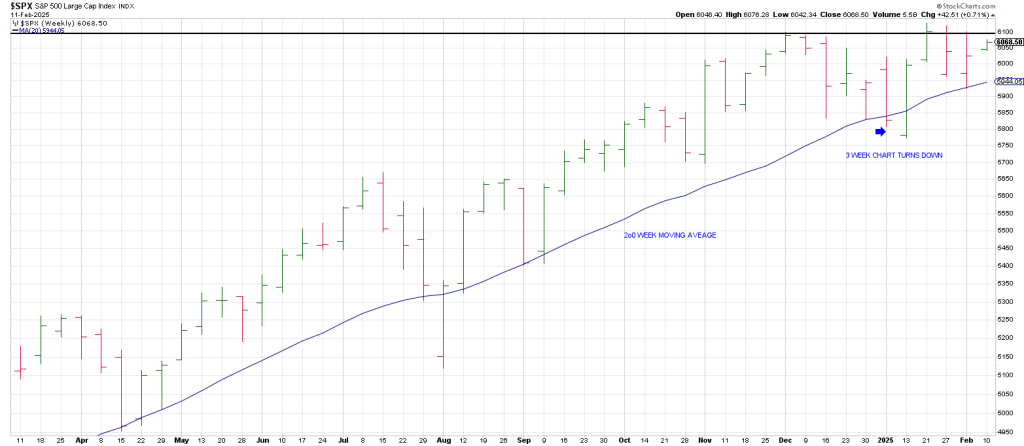
We’ve gone exactly nowhere in 9 1/2 weeks, despite a nominal new high a key 7 weeks after the early December peak.
If it’s a high level consolidation, is it possible it’s a Cup and Handle?
Checking the dailies, the Handle is a bit long in the tooth.
Alternatively, bearishly, the weeklies are sporting a Soup Nazi sell signal.
The SPX made a new 20 week high 3 weeks ago above the high within a 20 week lookback and Jackknifed back below the initial December high…within at least a 4 bar interval.
The 4 bar interval is to guard against continuation moves versus “tests”.
That said the Soup Nazi has not produced any kind of fainting spell in the SPX itself…yet.
Today CPI could be the lynchpin.
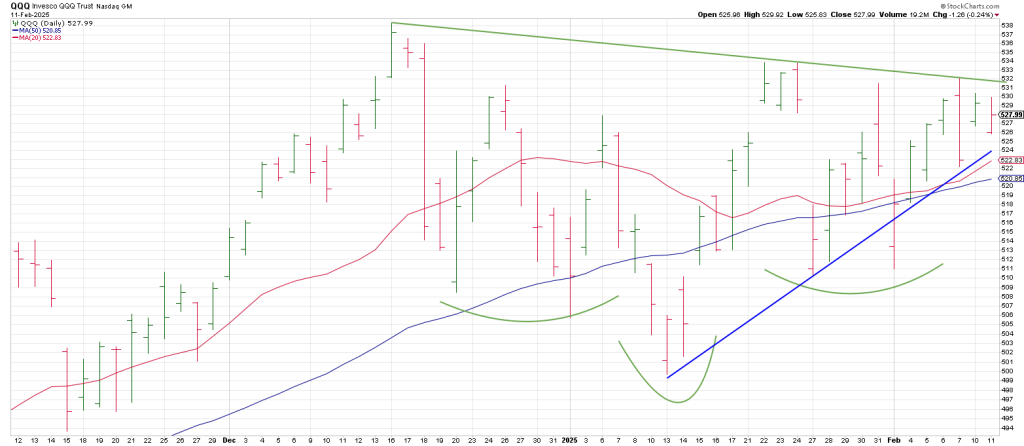
There is a conspicuous intra-market divergence between the SPX and the QQQ which has NOT
Mad a new high since its mid-December record high.
The bull case there is an inverse Head and Shoulders.
That said a weekly QQQ shows the Key Reversal Week at the all-time high, a turn down in the 3 Week Chart and ONE weekly turn up.
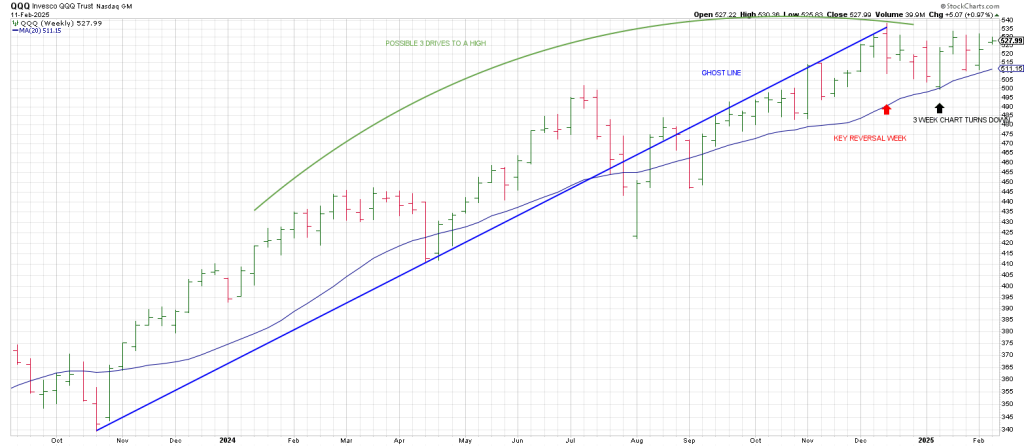
The Q’s have not been able to muster two consecutive higher weekly highs…yet.
It could do so this week on trade above last weeks high.
That could happen today on the market reaction to the CPI.
If so the ensuing behavior will be very important.
In sum, despite the DJIA closing up 123 points yesterday, the markets internal weakness remained glaring.
The NYSE managed only 53 net advances, while the NAZ recorded 841 net declines.
The McClellan Index fell for both the NYSE and NAZ, underpinning the deteriorating breadth beneath the surface.
Since December 1, we’ve repeatedly seen sharp selloffs on heavy volume and negative breadth, followed by weak rebounds characterized by low volume and narrow participation.
Tuesday was no different—while the major indices bounced, IWM remained red throughout the session, reflecting the continued struggles of small caps.
IWM which closely tracks NYSE breadth, clearly represents this persistent market weakness.
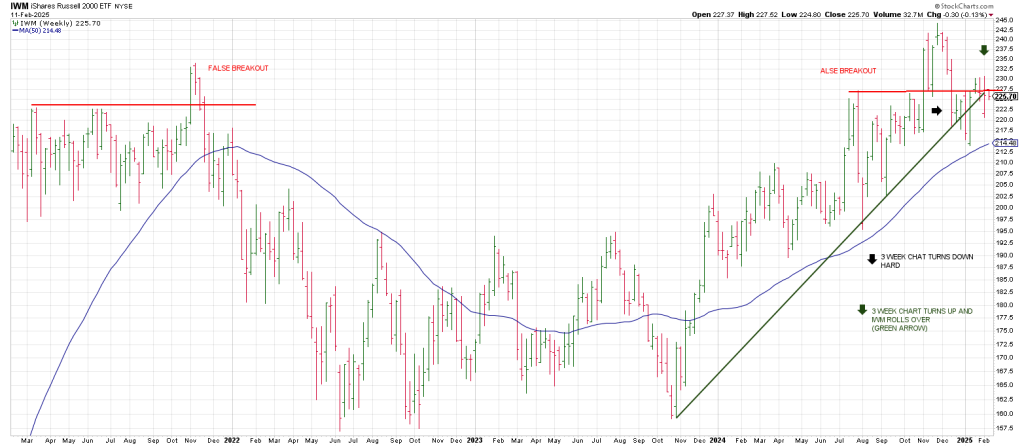
IWM had a false breakout in November similar to its false breakout in November 2021 preceding a bear market.
From last November’s high it turned its 3 Week Char down immediately with a thud.
It turned its 3 Week Chart back up last week. And is glued to its 20 week ma.
It tested a rising trend line from October 2023.
Breakage below the 221 region over coming days/weeks is a blaring siren as it triggers a weekly Rule of 4 Sell.