It was almost 8 months ago at Computex 2024 in Taipei that Jensen Juang autographed a woman’s bustier.
Distribution takes time.
In a prior era, such action would’ve been seen by some as (another) sign that bullish sentiment for NVDA —and Jensen Huang—had run amok and as an omen that tough times for the stock/CEO were around the corner.
NVDA closed yesterday a mere 2% above where it was on June 7, 2024. It’s stock is at a level first seen in early October 2024 and its relative price vs the SPX is at a level first seen in May 2024. For all intents and purposes, Jensen Huang’s John Hancock was the first salvo in the topping process of NVDA.

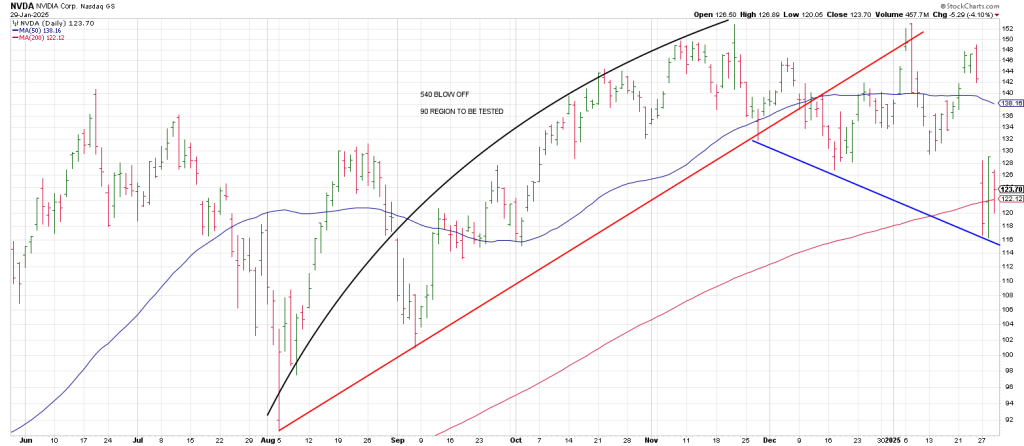
Price action over the last few days makes me more confident that NVA has peaked ala CSCO in 2000.
NVDA staged the obligatory bounce off its 200 DMA on Tuesday leaving an LROD a large range outside up day or Lightning Rod.
It failed to attract follow thru.
The last time NVDA saw its 200 day moving average was a year ago.
If this test doesn’t produce another bottom, NVDA will get cut in half from its ATH of 153.
360 degrees down is 108.
Breakage below 108 opens door to a cube out (540 degrees) down at 88.
That’s the last major breakout from May 2024 and the last pivot low from August 2024.
Early Feb is 180 degrees straight across and opposite the August 5 Flash Crash.
111 and 101 and 91 square-out with the first week of Feb.
I think there is a strong likelihood NVDA gets magnetized to the 111 region in early Feb.
Yesterday on the runoff it popped to over 124 and we tweeted an alert to add to our short position.
NVDA of course has been the tip of the speculative sword brandished by the semi-conductors.
This morning, despite a rally in the futes, NVDA is down 1.50.
A monthly SMH shows a closing monthly high in June of 2024 as well.
Drilling down to the dailies shows a Rule of 4 Breakout, a breakout over a 3 point trend line on January 22 that quickly and decisively morphed into a false breakout with a massive massacre.
The speculative sentiment over NVDA is reminiscent of the axe and shovel mantra around CSCO in 2000.
Can the broad market write off the action in Emperor NVDA anymore that it could that of CSCO.
There’s always a Pied Piper in markets. Bernie coincided with the GFC in 2008.
In the story,
• The Pied Piper was hired to get rid of the rats in Hamelin.
• He played his pipe and the rats came to him from all over the town.
• He led the rats to the River Weser and made them drown.
• The townspeople refused to pay him for his services.
• The Pied Piper returned to Hamelin on June 26, 1284, dressed as a hunter.
• He played his pipe again, and this time children came to him instead of rats.
• He led the children away, and they disappeared forever.
Forever is a long time. After the 1929 bust the market didn’t make a new high for a generation.
When the speculators who behaved like children were old.
We haven’t had a bust since then.
We have had bear cycles, but not a bust.
That is why the current market has held up so long in my estimation: the bigger the top, the bigger the drop.
If we look at where the major averages are today versus where they were in early November 2024 after the music of the Trump election, we see that essentially stock prices have not changed in three months.
Markets play out in these seasonal 90 degree/day decrements of the year.
On November 8, the SPX had surged to a record high of 6017.
After Monday’s DeepSneak Massacre, the SPX rallied to a high of 6017 closing a tad off that high at 6012.
Yesterday it pulled back to test the 6012/6017 level.
We flagged that on the Square of 9 Wheel 601 (6010) squares out with this time frame, specifically February 4th, opposite the Aug Flash Crash.
As well February ushers in an array of historic anniversaries of turns of prior mania’s panics.
We walked though those in a report last week.
I think it’s a big deal.
Today is going to be a good test of the Road Map which projected a trend day down from an opening high.
This morning the futes are 25 offsetting most of yesterdays loss.
Monday’s gap, just overhead, reversed the SPX yesterday.
Will another test see the second mouse be successful for the bulls or the bears?
Is the SPX carving out distribution or a high-level consolidation?
It must be said that the from the early November period, the SPX has satisfied a Megaphone or Broadening Top Formation.
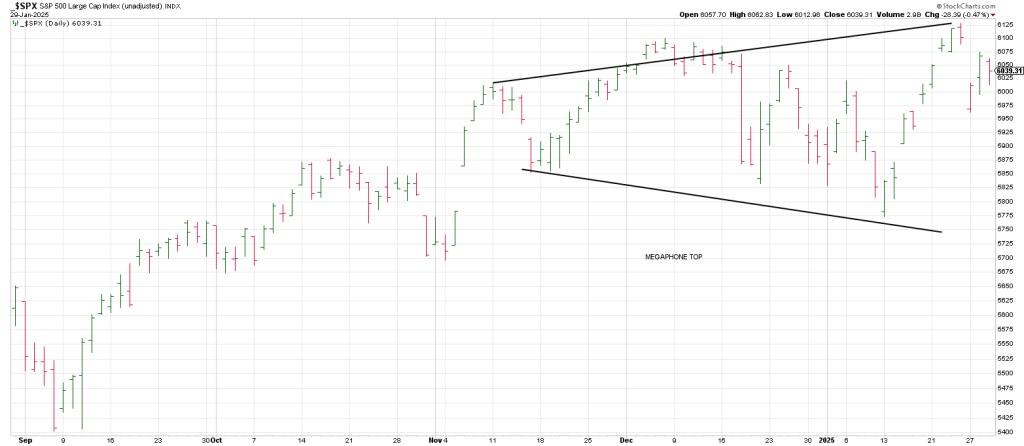
We have a Breakaway Gap from a Megaphone Top and a backtest of the gap on the table.
So this early February period sets up as quite an important juncture…interestingly 25 years following the Q1 Bubble Top in 2000.
The SPX and NAZ topped in March. The DJIA topped in January.
Split the difference and we’ve got February.
25 years is a big deal cyclically, it is half of the 50 Year Jubilee Biblical Cycle.
For example 50 years from the 1932 low was the major 1982 low.
100 years from 1932 should see markets pulled lower into 2030-32 similarly as they were from the bust in 1929.
There will be no bustier signing at the bottom.
AGQ setup.
Yesterday I said I’d walk thru this Combo buy setup.
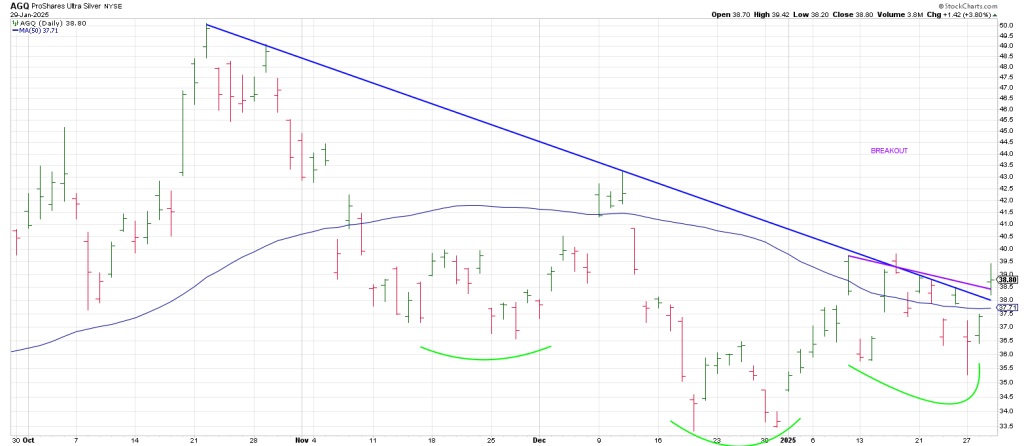
1) Yesterday AGQ staged a Rule of 4 Breakout over a 3 point declining trend line.
2) It also broke out of a short-term Bull Flag on gappage over its 50 day line.
3) AGQ is sporting an Inverse Head and Shoulders bottom formation from last November.
It projects to the 45 region.
This morning we’re getting follow thru. AGQ is +1.40