“Only the knife knows what goes on in the heart of a pumpkin.” Simone Schwarz-Bart
“When you come up from behind and lay it down cold on my skin.” Six Blade Knife, Dire Straits
In past weeks we’ve been comparing the current structure of the market to early 2020 and the Covid Crash.
Time wise, the 5 year cycle is a key cycle as we’ve explored in this space over the years.
The Breakaway Gap to the downside in February 2020 doesn’t hold a candle to yesterday’s Breakaway Gap. Yesterday’s Breakaway dwarfs yesterday’s Breakaway.
I’m not sure how important that is but it’s not unimportant.
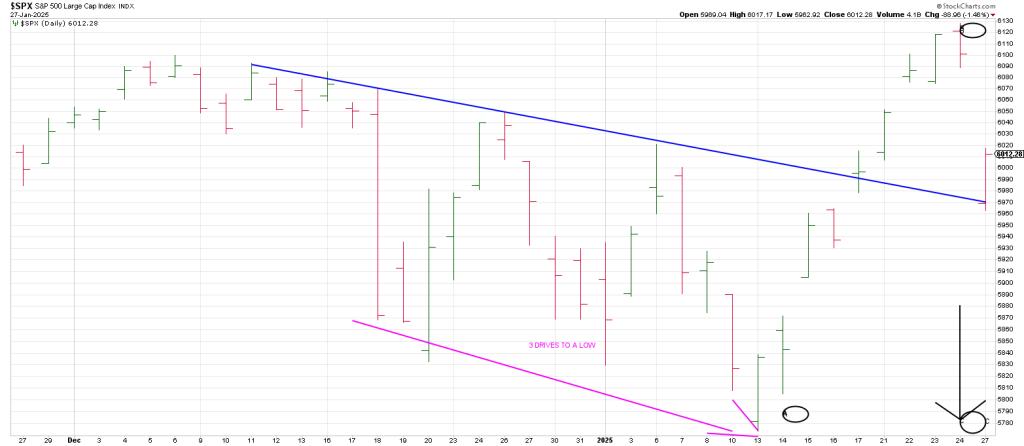
There is a case, albeit diminishing, for the SPX to make yet one more new high.
I’ll believe it when I see it…or I should say I’ll believe it when the SPX offsets today’s gap neutralizing the Island Top.
That is the price action that would play out if the price structure conforms to an A B C correction.
In other words the drop into mid-January would count as an A Wave decline, Friday’s record high would be a B Wave and we are in the midst of a C Wave which could easily extend well below current levels.
The A B C would carve out a 4th wave low followed by a Final 5th Wave, culminating the Bull.
IF that is the count, the bulls have their job cut out for them because we are in the heart of the Gann Panic Window.
I did not expect to see a nominal new high on the day the window was due to open last Friday…calendar day 49 from the December 6th peak, but we have warned that a nominal new high could be compared to the nominal new high in February 2020.
Fast moves come from false moves, but even the Covid Crash did not strike immediately after eclipsing the January peak. It backed and filled for two weeks before rolling over.
Monday’s crash…indeed it was a crash in tech and anything related to AI— struck after only two days above the December 2024 peak.
As offered last week from the January 2020 peak the SPX pulled back 3.7% before pushing to new high.
If that is the roadmap and agenda, then a similar 3.7% drop off the 6100 + level projects to a test of the Jan 13 low and then a new high.
The question is has that initial drop already played out earlier this month?
We don’t know yet.
However all this is predicated upon whether or not the Gann Panic Cycle bears down this week.
It will be easy to tell.
The market will see accelerated momentum to the downside.
Let’s be mindful that the intraday and one day bounces in the heart of the Covid Crash were vicious.
With the Wednesday show staring Jerry and the 3 Amigo’s, King Vol could put on a show of his own.
If the SPX can hold the January lows and turn up after Friday the door is theoretically open to a last ditch rally.
They pulled out all the stops to protect the baby, the SPX, at its 50 day moving average yesterday.
That said an HOURLY 20/50 moving average Bowtie presents beaucoup resistance at 6050 region.
If on a further decline, the SPX can successfully test the 5860 region, the high of the low bar day in January, the bulls will try to exploit that as a possible inverse right shoulder.
Indeed if the SPX can hold that region thru Friday, it opens the door for a rally attempt.
However, it will be like walking on hot coals to get thru this week for Mr. Market:
It has to contend with the Gann Panic Window being thrown wide open this week.
It has to navigate Wednesday when Jerry and the 3 Amigo’s report:
The FOMC and earnings from TSLA, META and MSFT.
Given yesterday’s Tech Wreck, Wednesday should see King Vol.
It should be an FOMC Cha Cha for the ages.
My gnome tells me Powell is going to be hawkish.
Trump has been demanding that he lower rates, so if for no other reason Powell doesn’t want to look subservient.
As well, multiple expansion is not going to cut the mustard; earnings are going to have to deliver if the market is going to put Monday behind it and extract the knife in the heart of momentum.
The conference calls are going to be a WWE event.
The Q’s have a massive Island Top now.
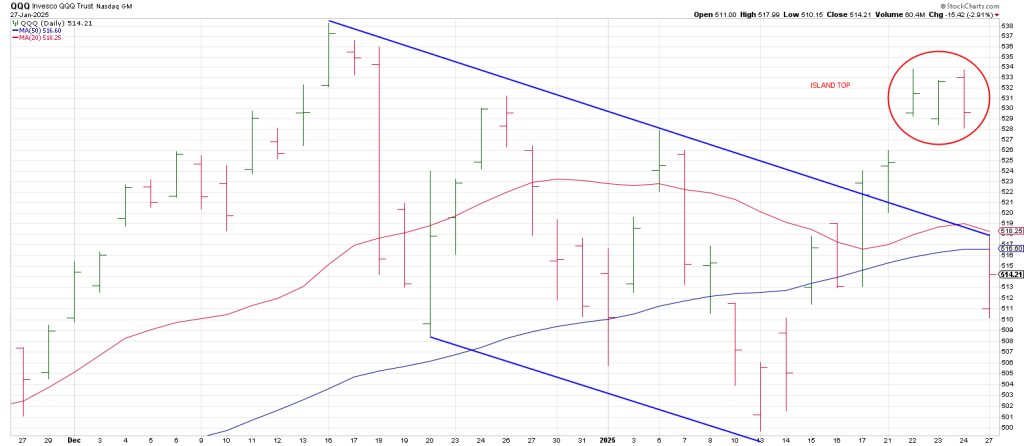
The Q’s broke out above a declining trend channel on January 17h but unlike the SPX, failed to make a new all-time high.
Yesterday it dropped back into the channel.
The bottom rail of the channel at 495 looks to magnetize price lower.
In sum, China gave us the Covid Crash. Is China going to be the culprit for another waterfall?
Was DeepSeek a seek-ret?
Someone always knows.
I can’t help but wonder if the drop into mid-January were those in the loop and the monster rally into last week, a “graceful exit’.
Which brings us to the one who brought the bulls to the party…NVDA.
NVDA saw the largest single wipeout of market cap loss ever in history, $600 billion or 17%.
This is not nothing. It’s the AI trade that fueled the market rally since October 2023.
NVDA plunged to test its 50 week moving average for the first time in 2 years.
You would think the first test of the 50 in such a long time would perpetuate a rally.
However, NVDA left a Weekly Soup Nazi sell signal on the week of January 6.
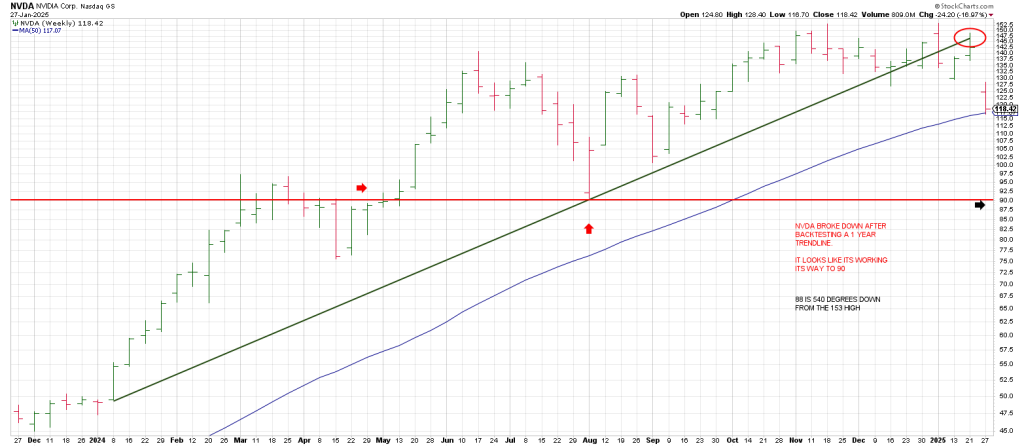
As well, NVDA broke a 3 week rising trend line on Monday triggering an Angular Rule of 4 Sell signal.
The volume was massive.
A backtest of the aforesaid Rule of 4 Sell signal ties to a backtest of a 20/ 50 week moving average Bowtie at 138,
If the SPX is going to draw the short straw and trace out one more new high, then NVDA will probably see a countertrend rally to the 135 region.
However it’s going to 89/90 which is 540 degrees down from the 153 record high.
NVDA sits on at the throne of the SMH, the chip ETF, which in reality broke trend in August 2024.
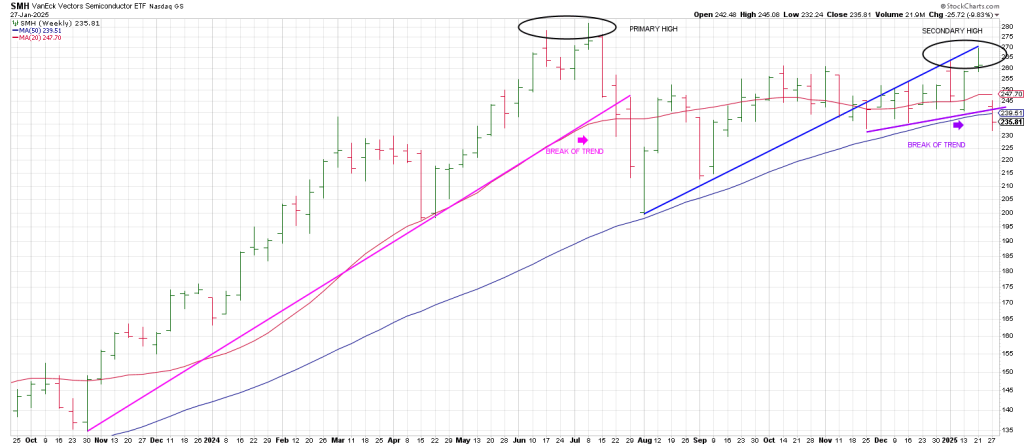
Above is a weekly SMH
I connected the August and September lows and you can see that SMH traces out a 1 2 3 Swing to a backtest of the broken blue Ghost Line.
In January it made a double top…a fractal of the double top from June/July 2024.
The bottom line is SMH broke the bottom line…the purple bottoms line that triggered a Rule of 4 sell.
In so doing, it closed below its 50 week moving average for the first time in two years.
The larger picture sends a vital message: following the July 2024 top and drop, SMH carved out a 1 2 3 Swing to a test of the highs…6 months or 180 degrees later.
This is the same pattern traced out by the SPX that struck a Secondary Top following its Primary Top in March 2000.
The dagger in the heart of momentum 25 years ago caused the market to bleed out for over 2 years.