“Vibration is fundamental: nothing is exempt from this law. It is universal, therefore applicable to every class of phenomena on the globe.” W.D. Gann
In this article we’ll take a look at the years of other panics such as 1929 when the year itself squares out.
As well we will look at how many years ago a particular panic played out and when that time period squares out on the Square of 9 Wheel of Time and Price.

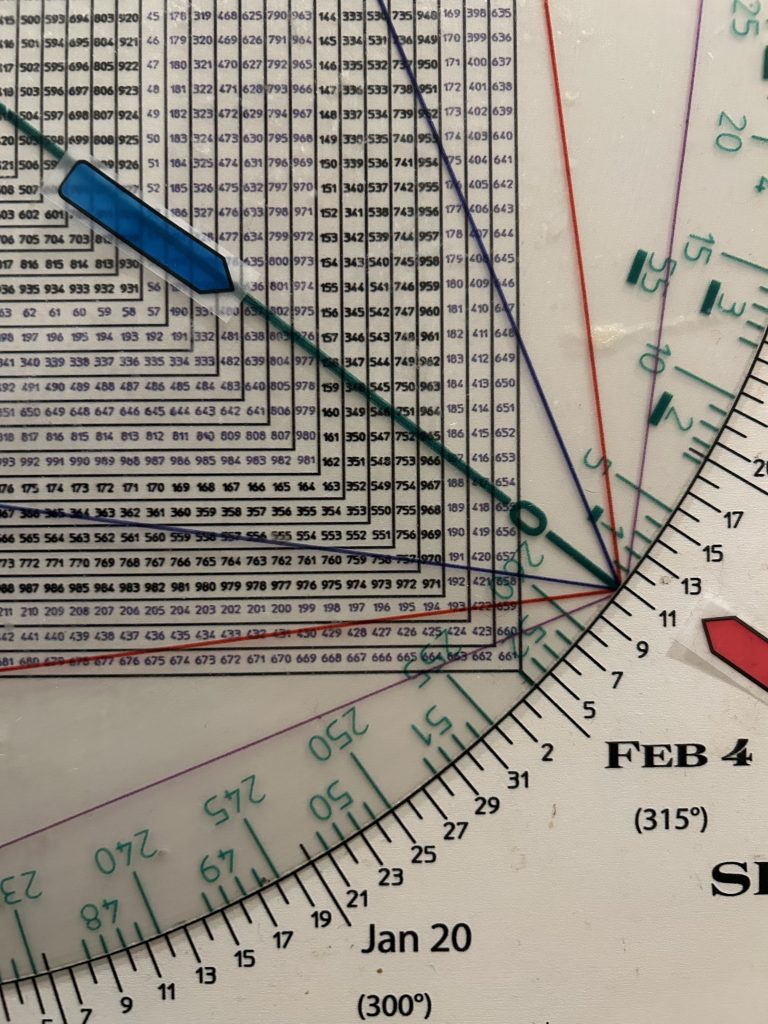
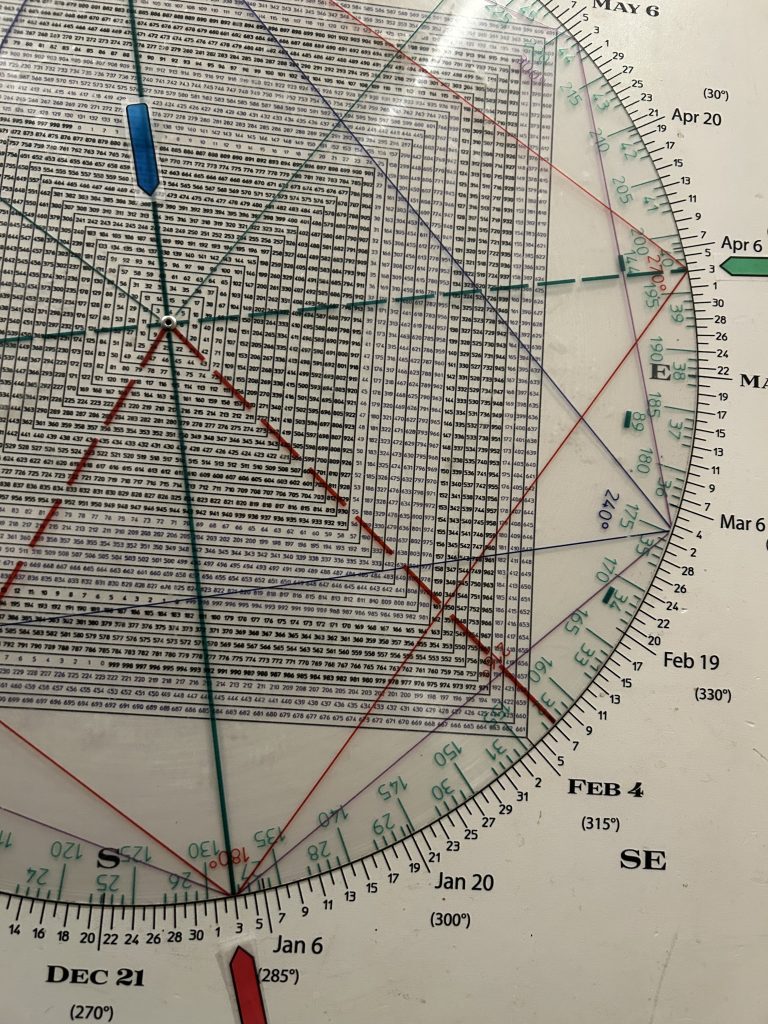
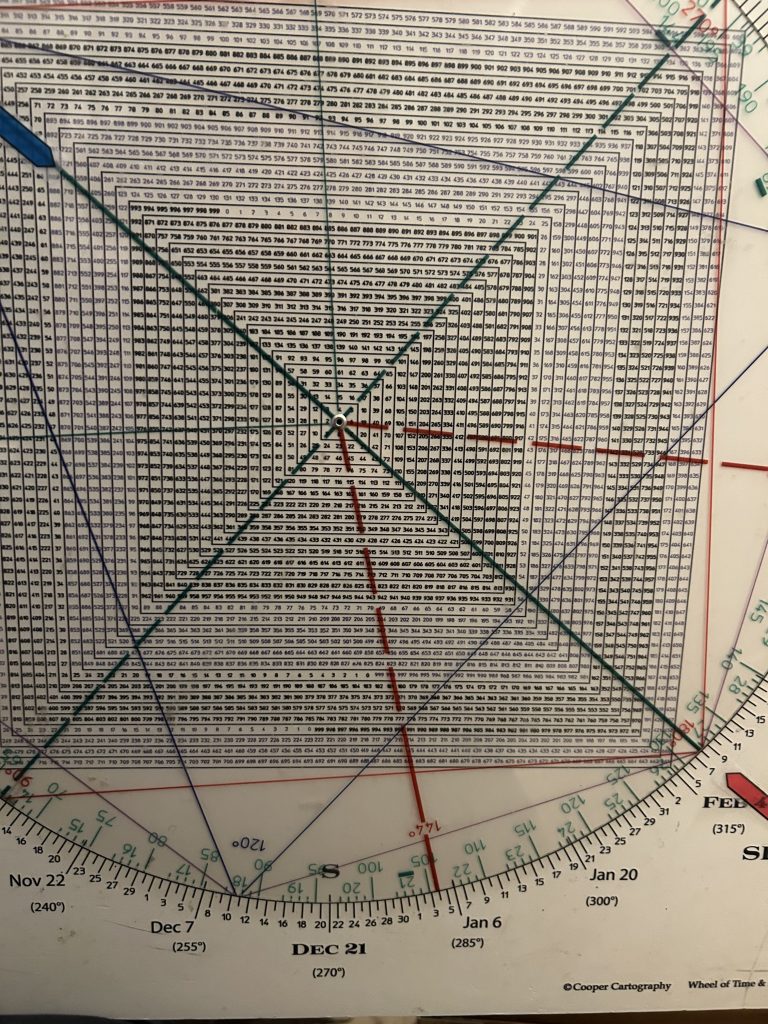
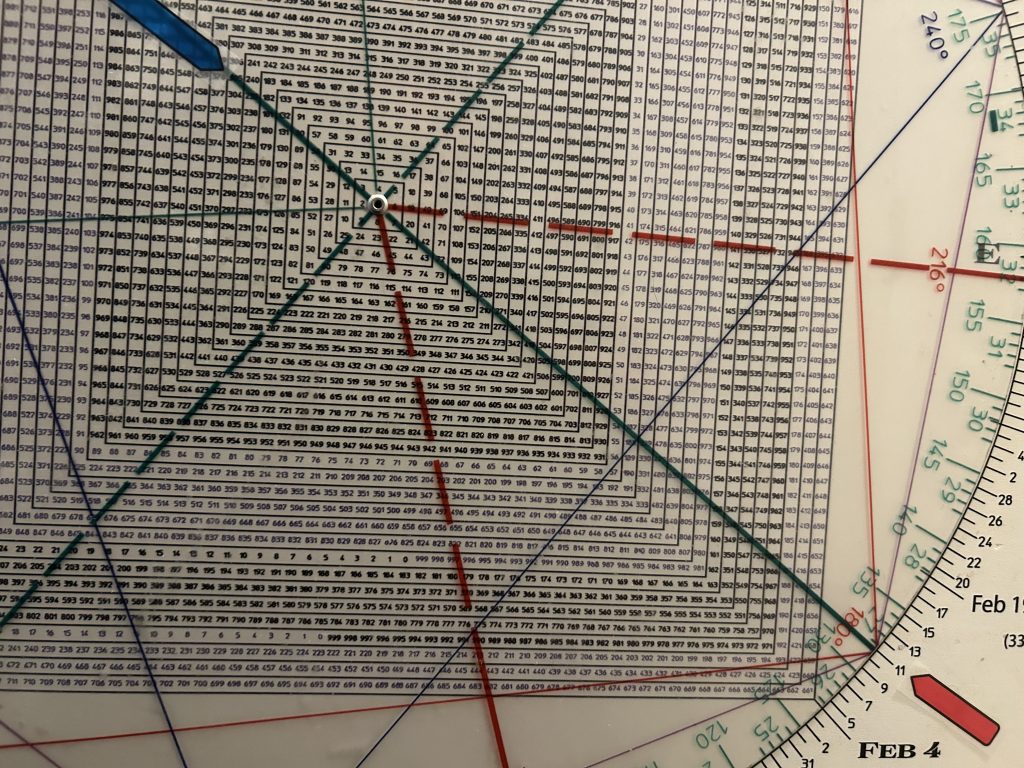
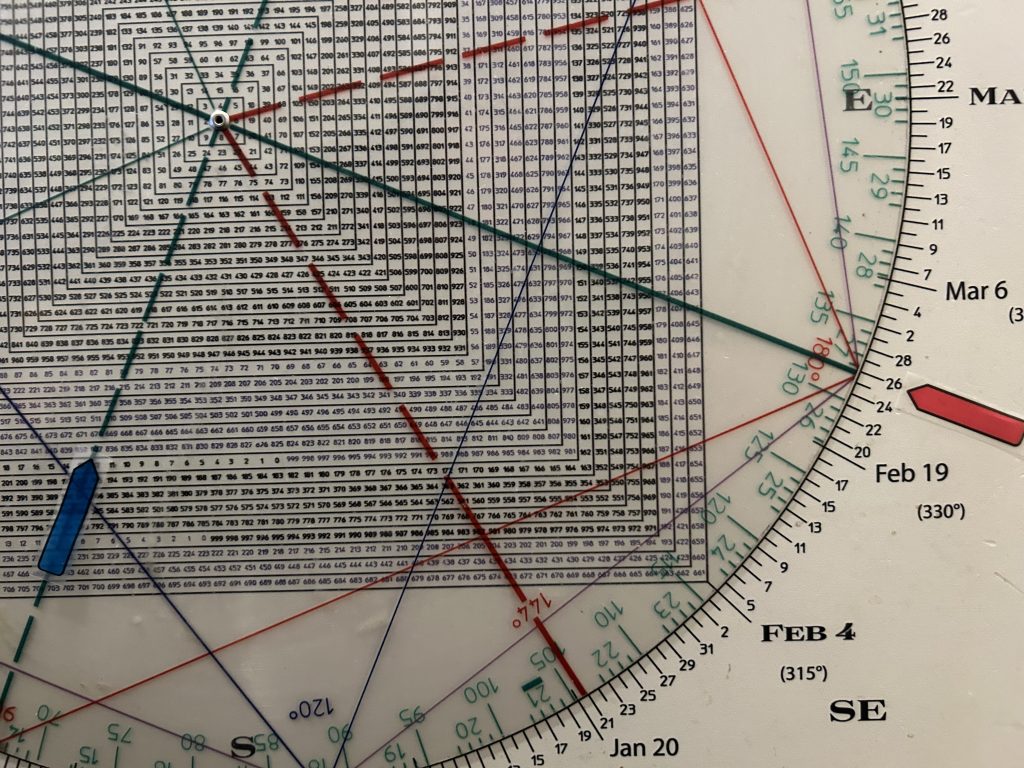
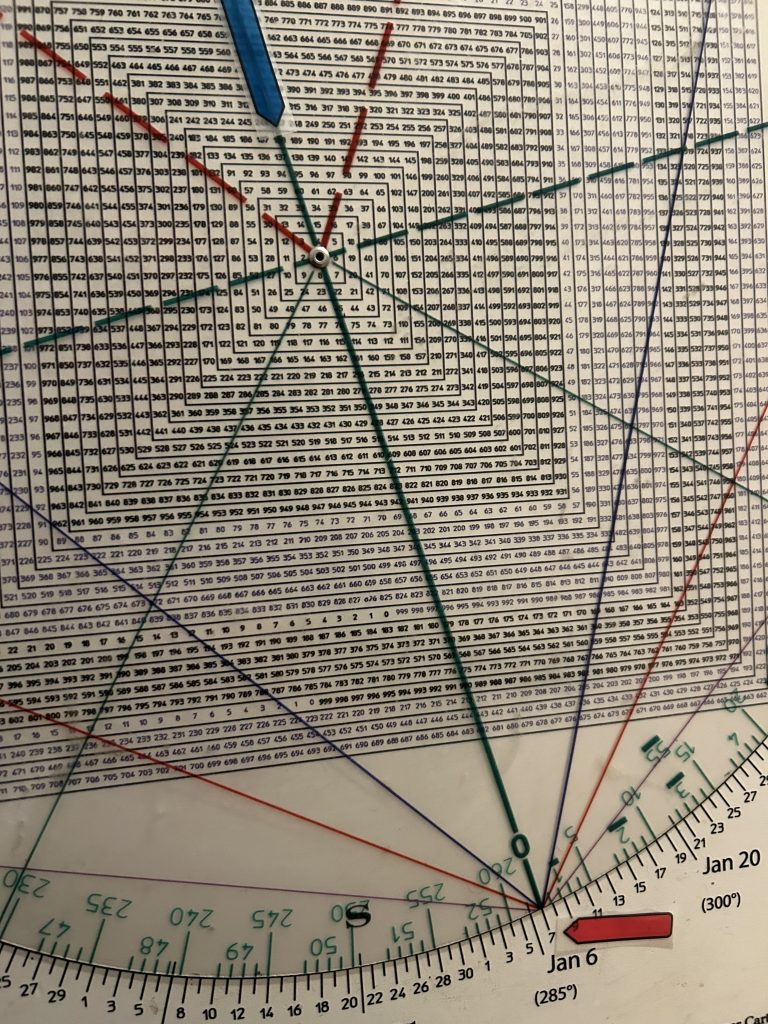
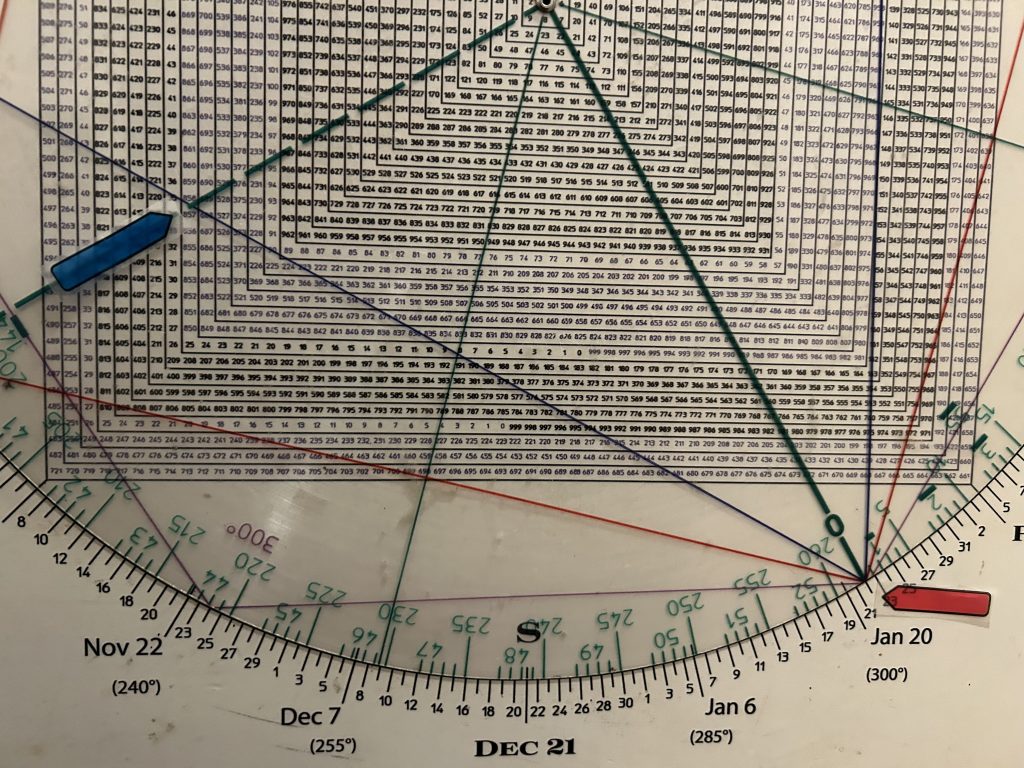
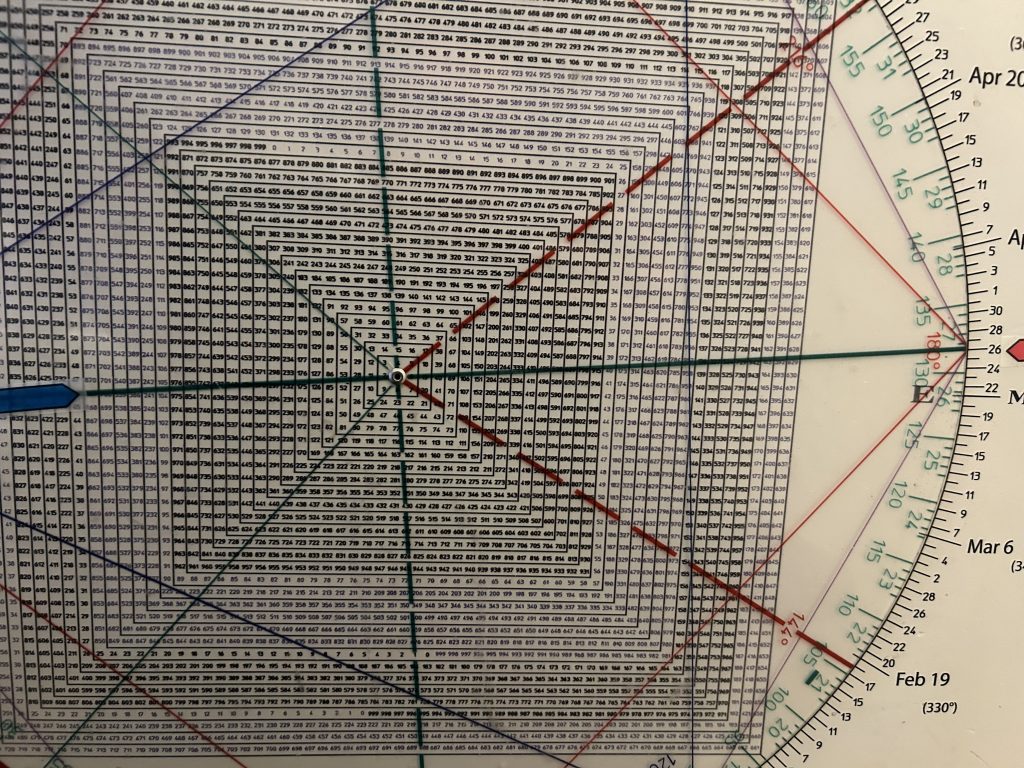
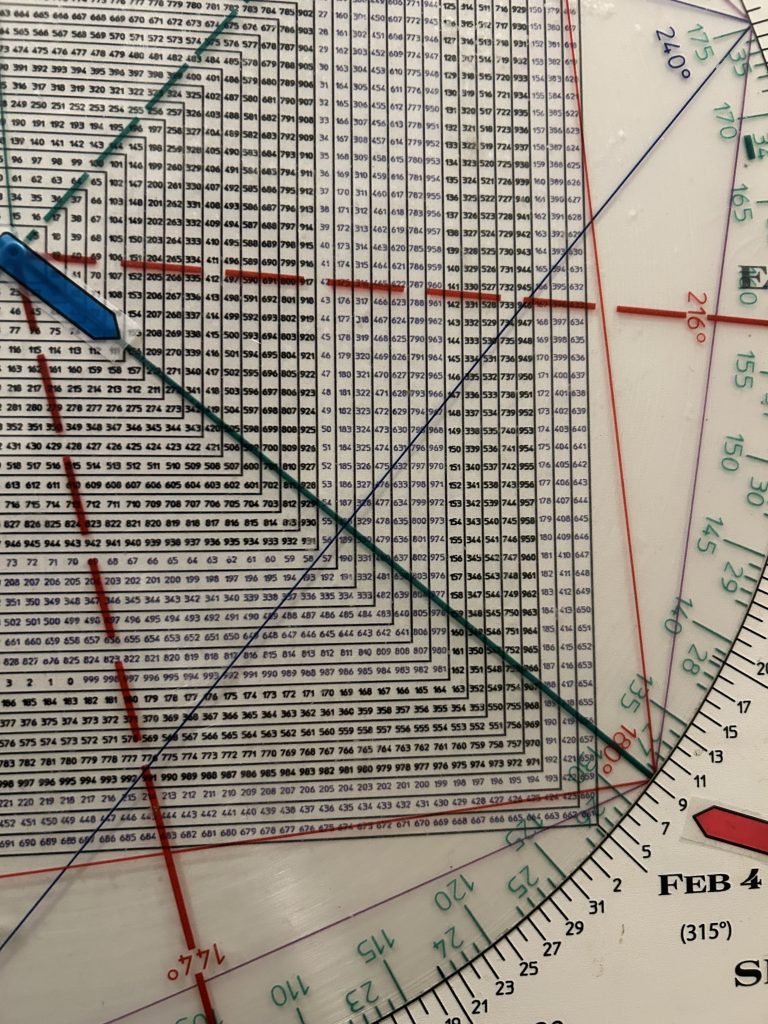
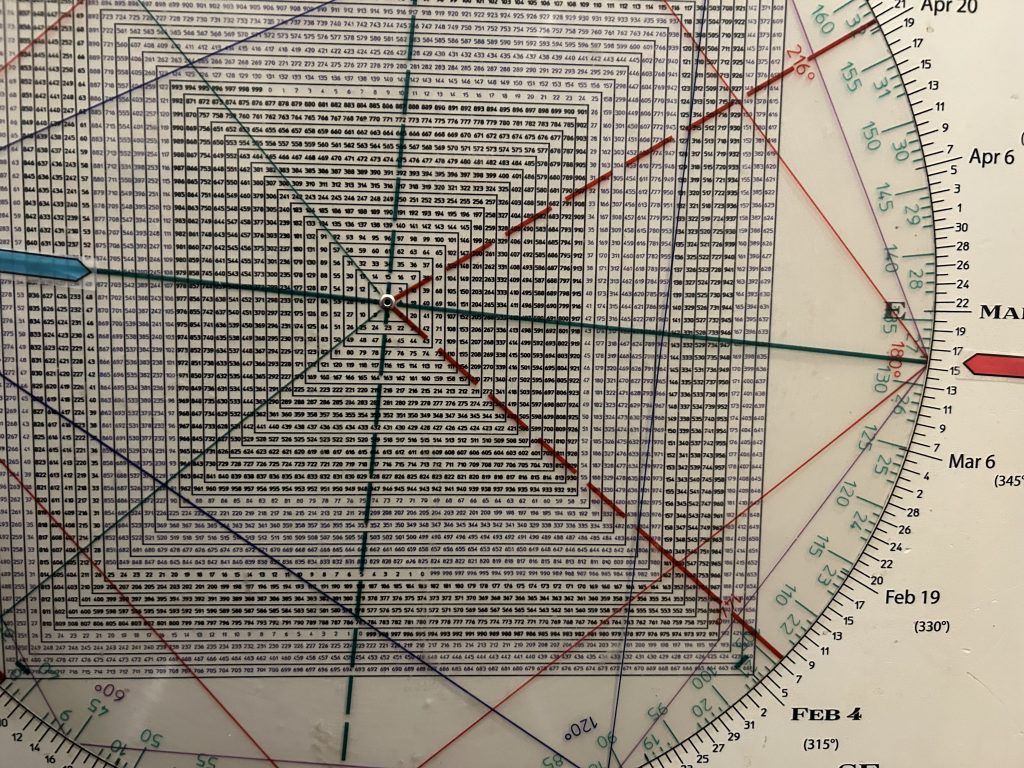
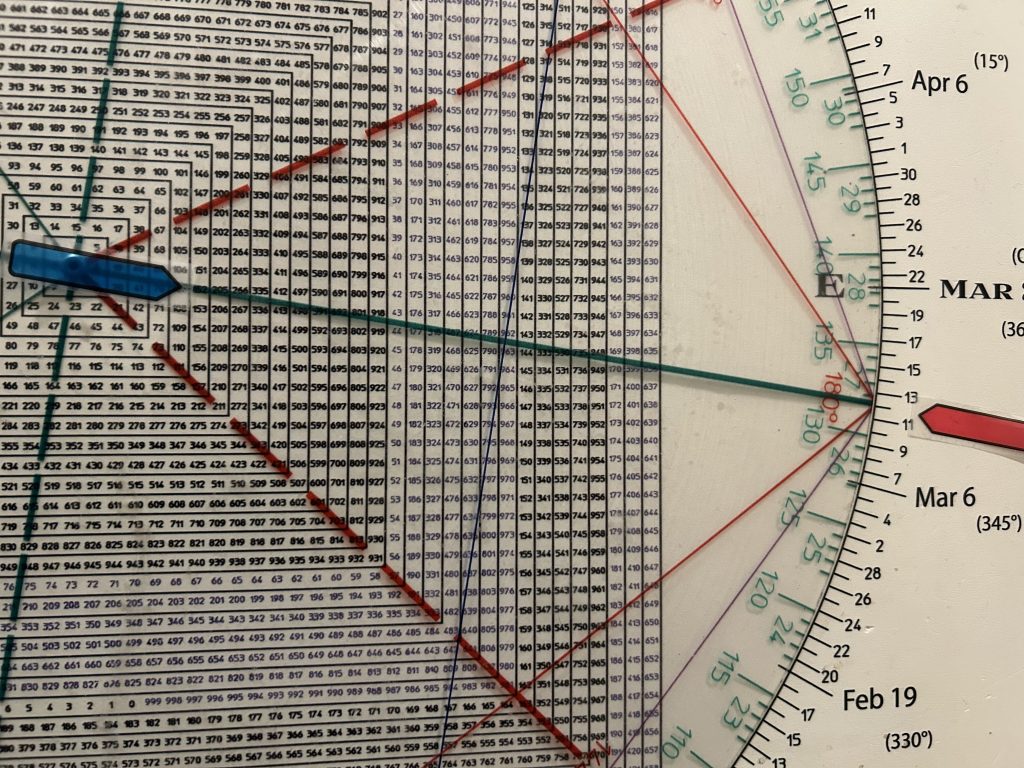
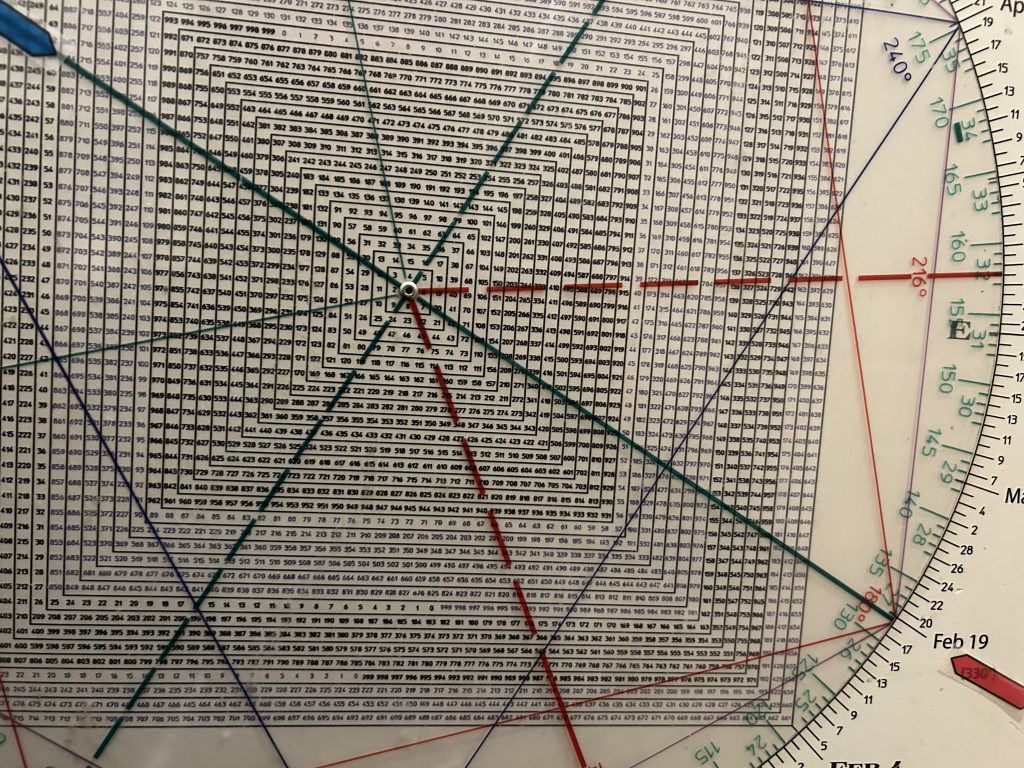
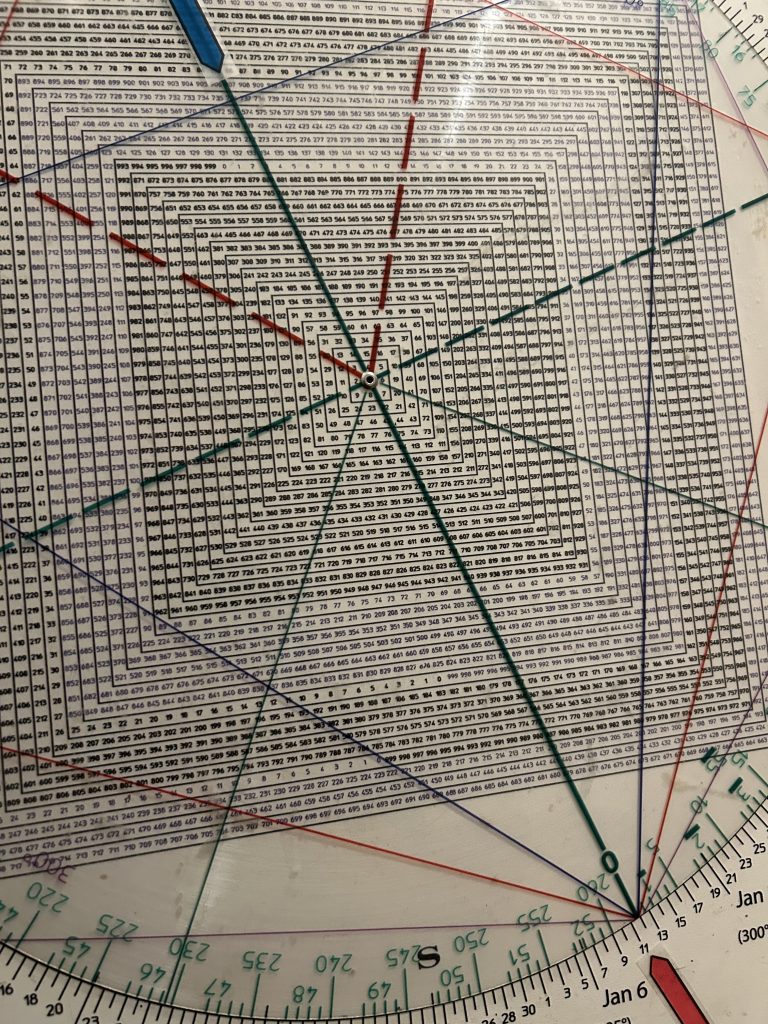
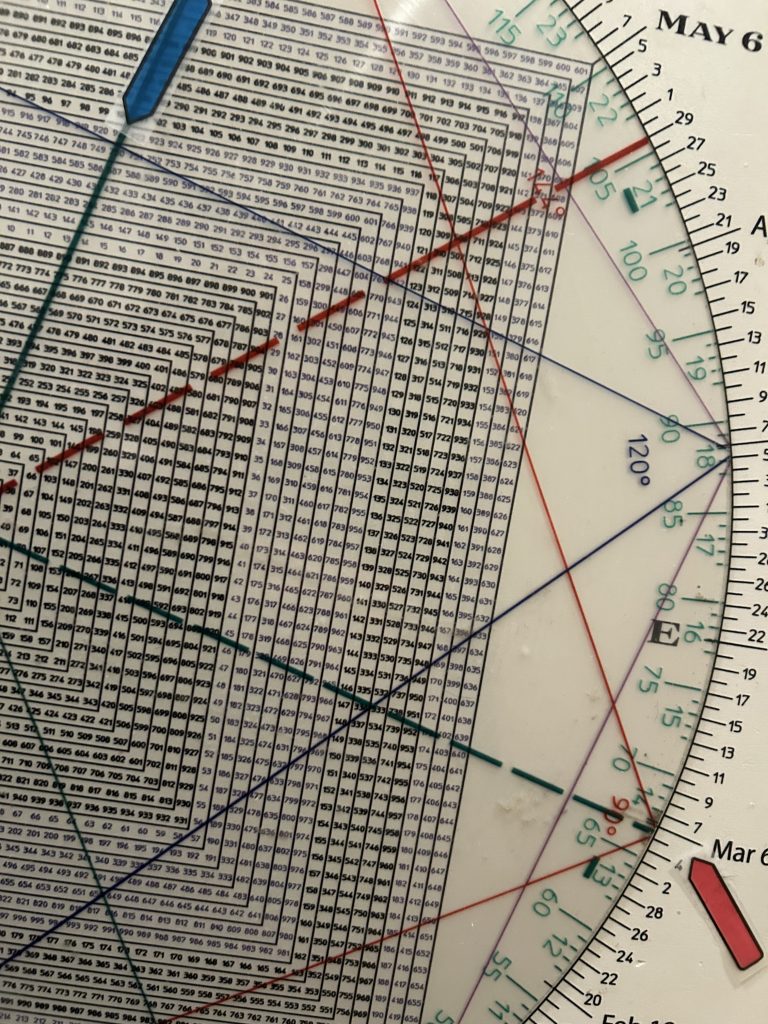
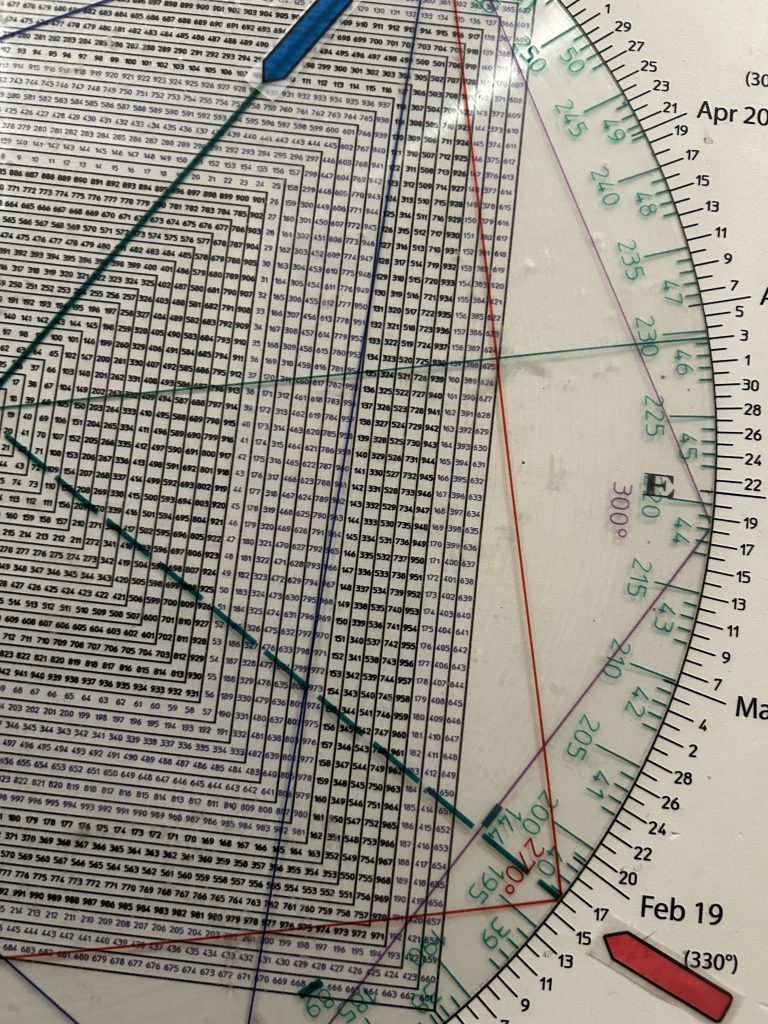
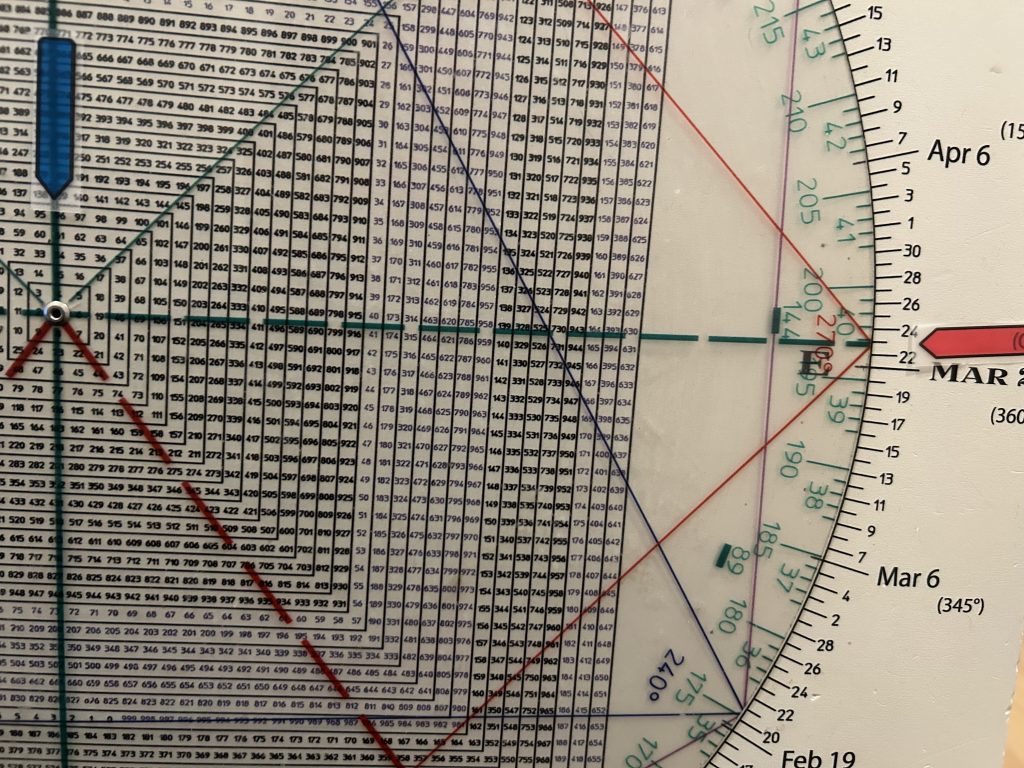
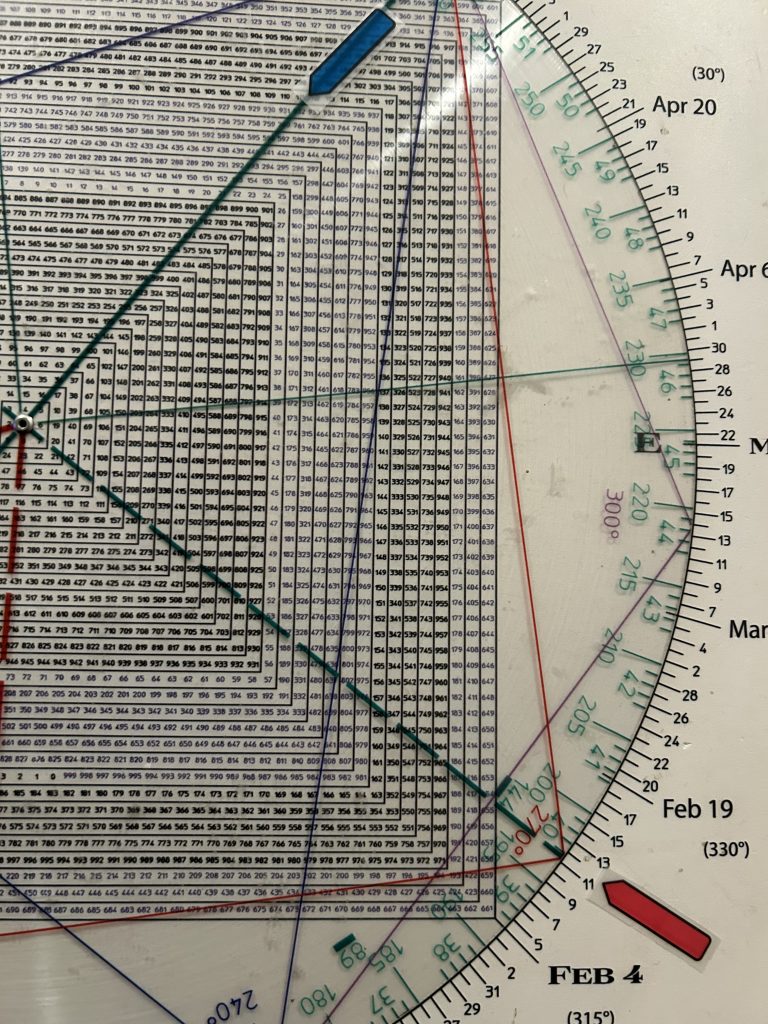
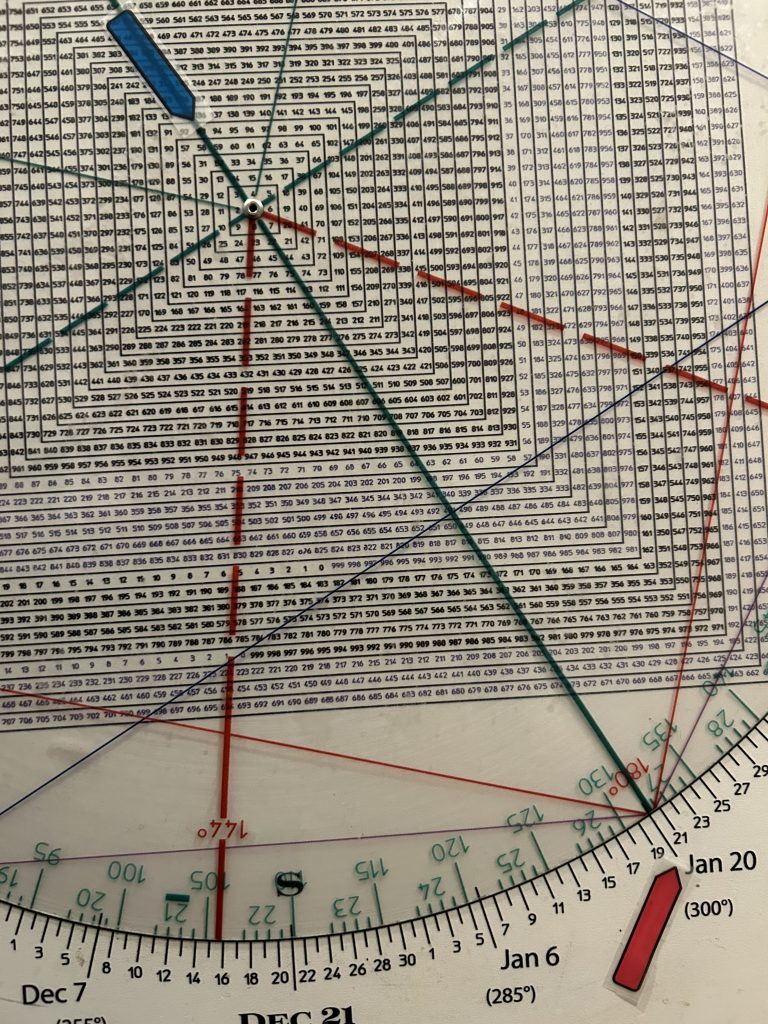
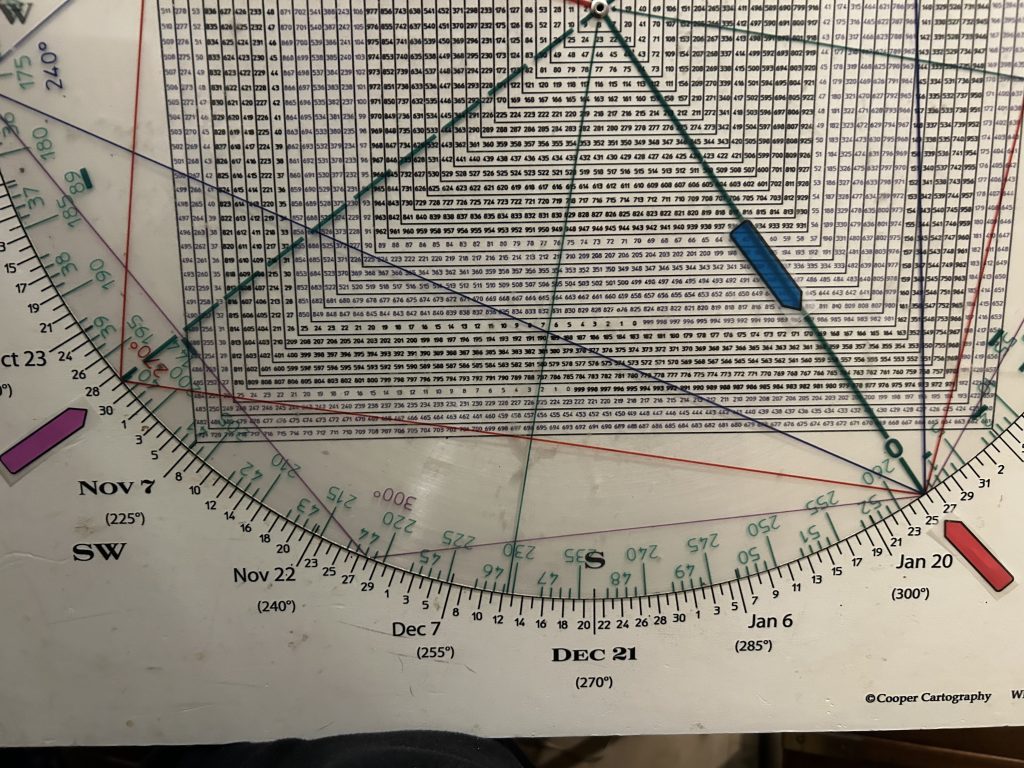
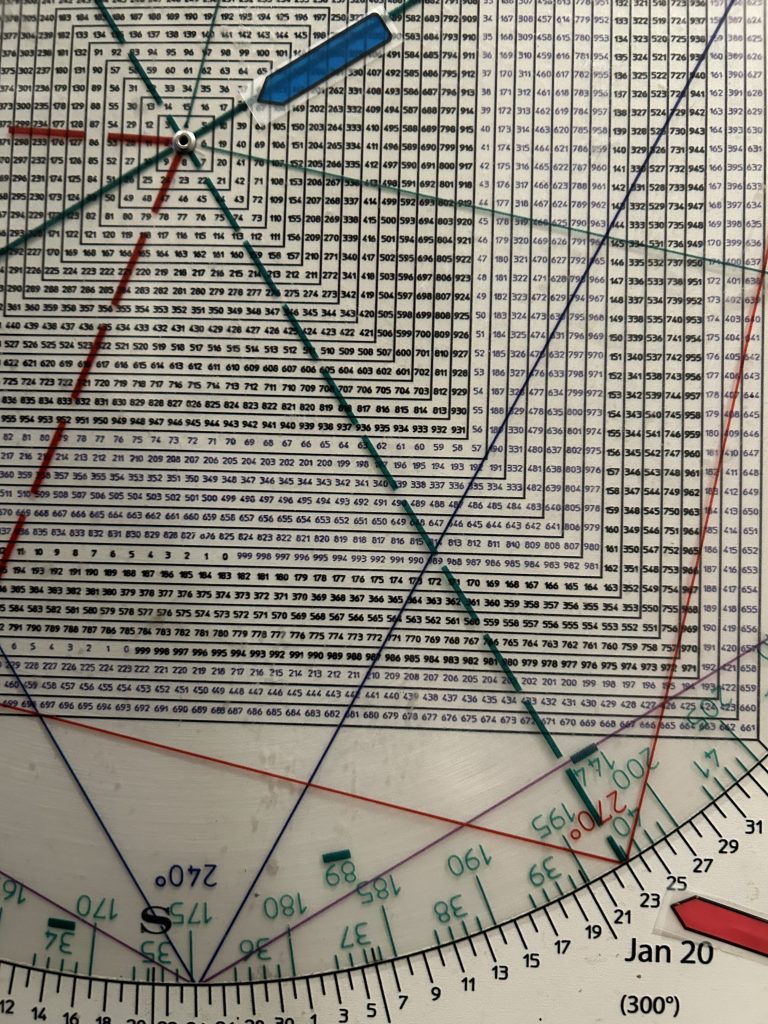
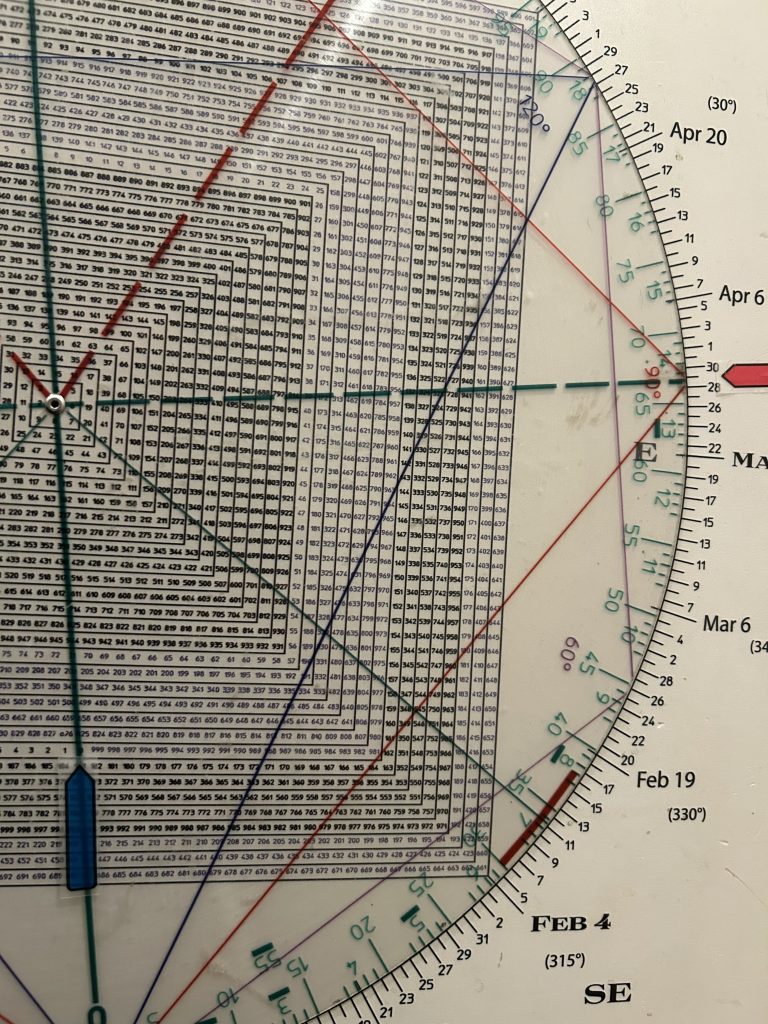
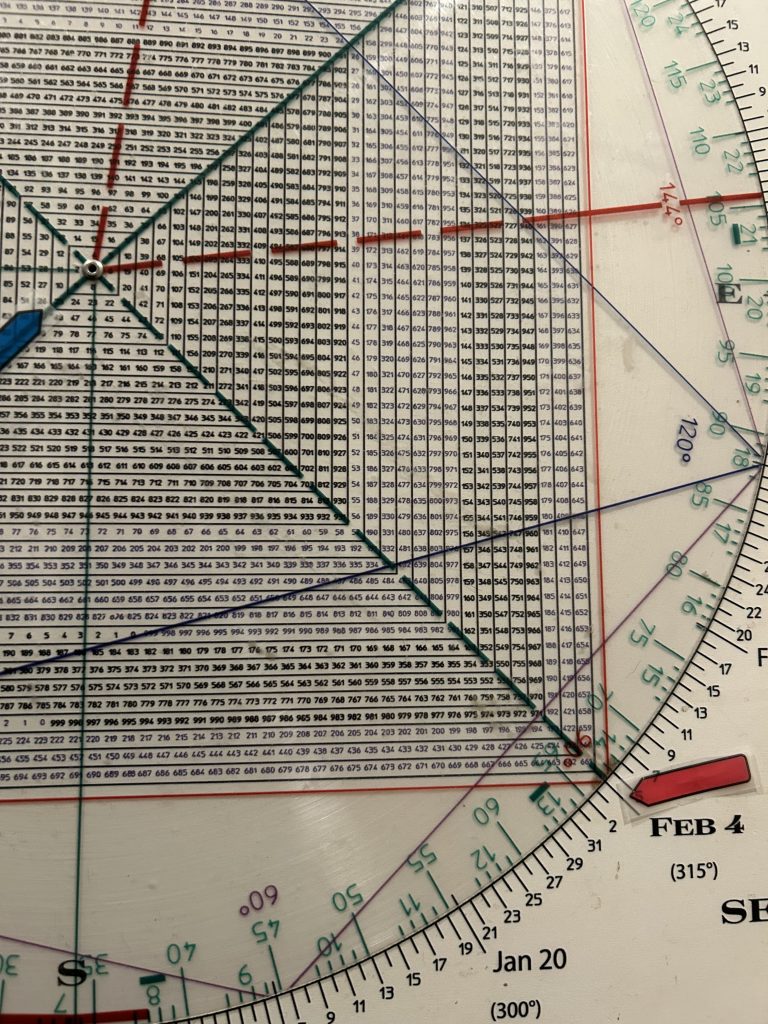
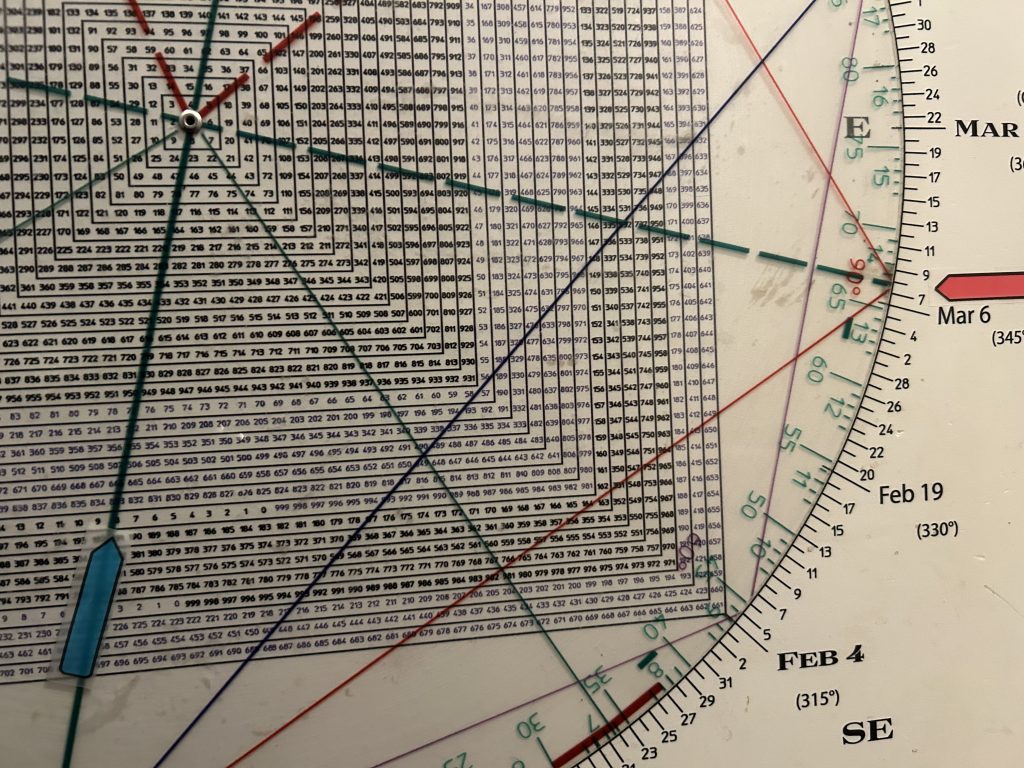
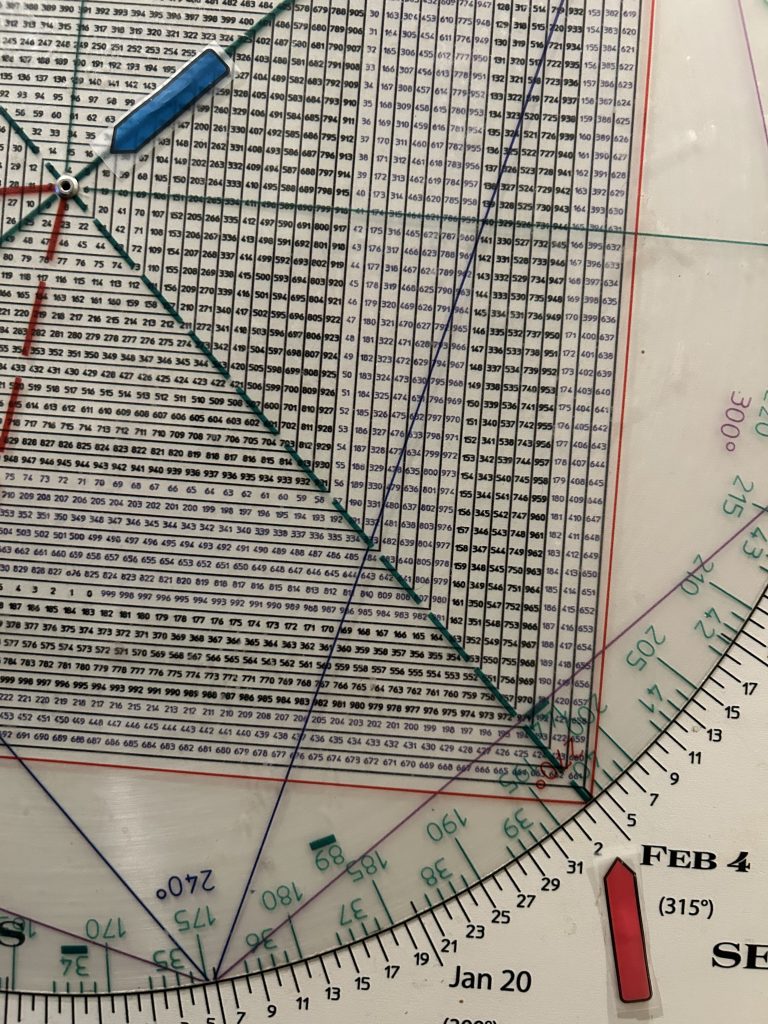
Square of 9 Wheel
Purchase your own Square of 9 Wheel. Shipping to US only. Contact Jeff for shipping outside the US.
The dominant fact in all price movement is the psychology of market participants.
What drives psychology is another matter, but what I am sure of with 100% Biblical certainty is that
Psychology is synchronous with pattern and repetitive because human nature never changes.
This allows us to project time, price and pattern arriving at turning points.
Since my work points to a top in the first quarter, ideally in late January early February, I’m not looking at the other three dates in 2025 on the Wheel that square out with these historic markers.
I’m looking at the square-outs in the first quarter of 2025.
For example there are 4 dates in any given year that will square-out 90 degree decrements of an anniversary year or anniversary period, ie. how many years ago it occurred.
Let’s get right into it and you will quickly see what I mean.
The peak of the Tulip Bulb Mania was in 1636, Anchoring zero to 1636 on the Square of 9 Wheel squares-out with February 12
That was 389 years ago. Anchoring zero to 389 points to Jan 3 and April 3.
The South Sea Bubble burst in 1720.
1720 squares out with Feb 8.
That was 305 years ago. 305 squares out with Feb 11.
The Panic of 1837 was a financial crisis in the U.S. that led to a depression lasting until the mid-1840’s
Anchoring zero to 1837 squares out with Feb 26th.
1837 is 188 years ago.
188 squares-out with January 7.
The Panic of 1857 was a financial crisis that affected the U.S. from 1857 to 1861.
Anchoring zero to 1857 squares out with JANUARY 22.
1857 is 168 years ago.
168 squares out with February 10.

1869 was the Black Friday Panic on September 24. Exactly 60 years later on September 3, 1929 the Roaring Twenties Bull Market peaked.
1869 squares out with March 26.
That was 156 years ago. 156 squares out with February 9.
The Panic of 1873 that began on September 18 was a financial crisis that caused a major economic depression in North America and Europe. It lasted until 1877.
1873 squares out with March 16.
1873 is 152 years ago. 152 squares out with March 12.
The Panic of 1884 or Grants Panic occurred during the Depression of 1882 to 1885.
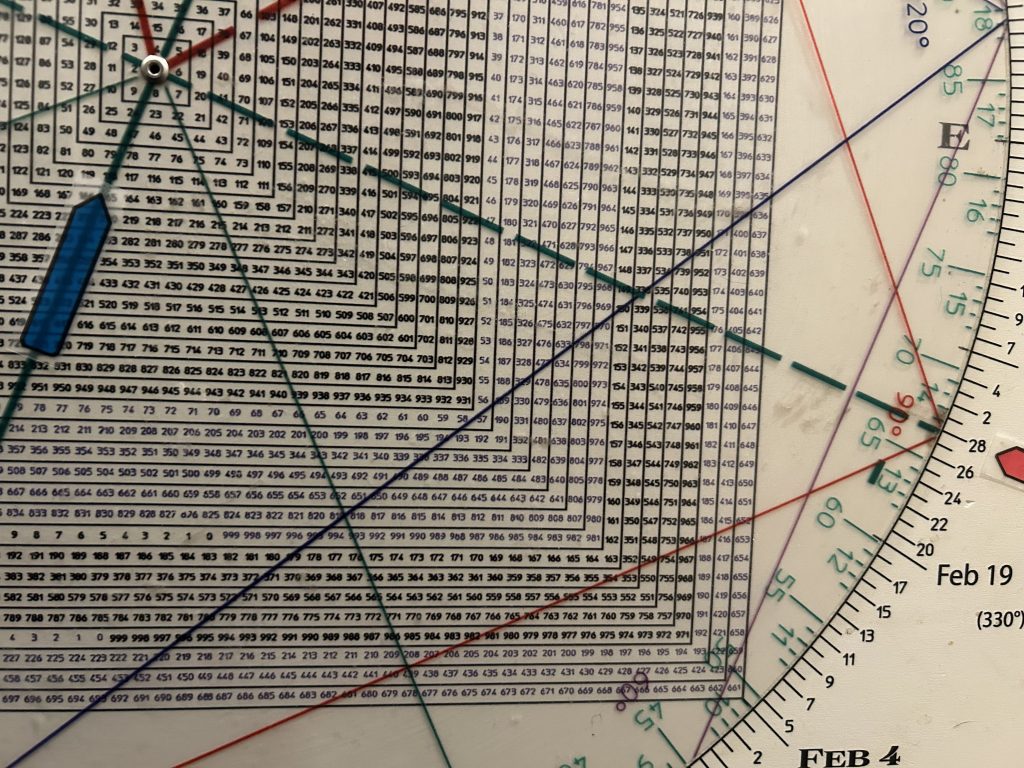
1884 squares out with Feb 19.
1884 is 141 years ago. 141 squares out with March 1st.
The Panic of 1893 ignited a severe economic depression lasting from 1893 to 1897.
1893 squares out with February 4.
1893 is 132 years ago. 132 squares out with Feb 8.
1896 saw a panic in the U.S..
1896 squares out with January 31.
1896 was 129 years ago. 129 squares out with March 2.

1907 was the Rich Man’s Panic. 1907 squares out with January 11. January 11 was the major top in 1973.
1907 was 118 years ago. 118 squares out with Feb 28.
There was a Depression from 1920 to 1921.
1921 squares out with March 6 (interesting that this is the big Bear Market low in 2009).
1921 is 104 years ago. 104 squares out with January 13.
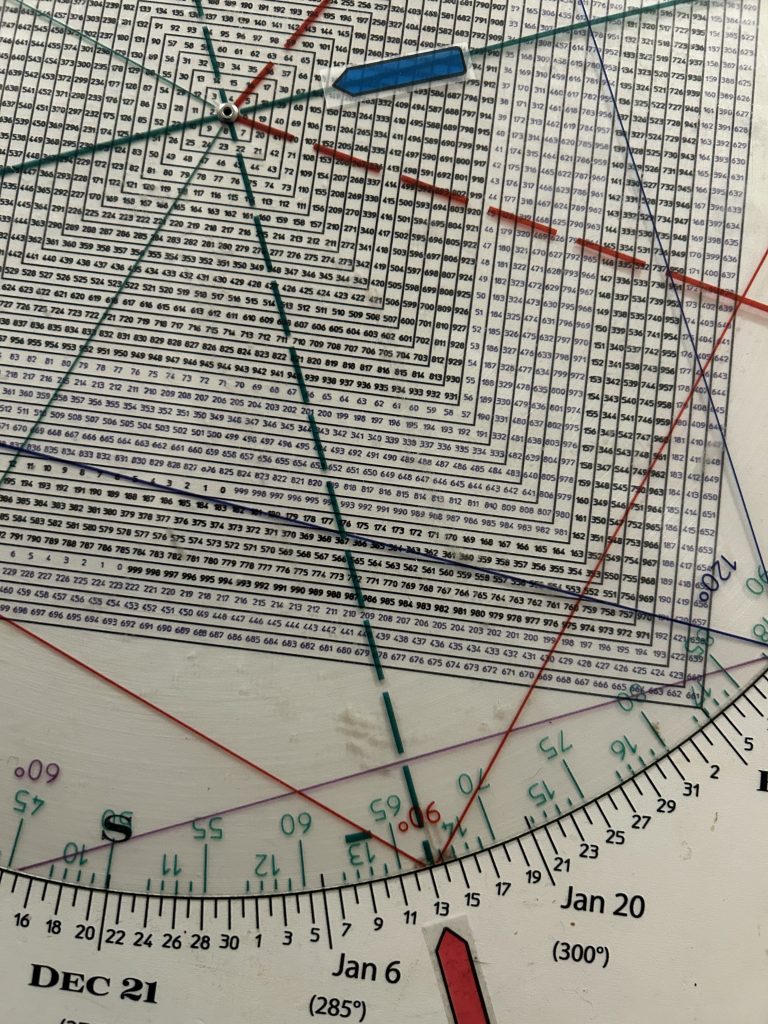
1929 and the Great Crash squares out with January 16.
That was 96 years ago which squares out with March 23 (the Covid Crash low)
1932 was Bear Market PRICE low of the Great Depression.
1932 squares out with February 12.
1932 was 93 years ago. 93 squares out with January 20th.
1987 squares out with January 26th.
Notice also how 1987 also squares out with October 29th, the Big One in 1929.
1987 was 38 years ago. 38 squares out with JANUARY 23.
The March 10th, NAZ high in 2000 was 25 years ago.
2000 squares out with March 29.
25 squares out with February 4.
2008 was the Great Financial Crisis and Lehman Crash.
2008 squares out with March 8.
2008 is 17 years ago. 17 squares out with February 4.
Notice the clusters of dates around early February.
In fact there is a vibration of 12 dates in early February.
As well we have Anniversary Square-Outs with the two great crashes from 1929 and 1987.
Both those crashes occurred in late October.
Late January is 90 degrees square late October.
Many times we’ve highlighted the 5 Year Cycle in this space.
For example the low in 1932 to the top in 1937.
The “real” Roaring Twenties Bull we showed here in December from 1924 to 1929.
The 5 year bull run from 1982 to 1987. Notice how the two great crashes followed 5 year run ups.
The market staged a stunning advance from August 1982 to August 1987. Five years again.
The Mania in the late 1990’s started in Jan 1995. And culminated 5 years later. The DJIA actually topped in January 2000.
The SPX struck a high in February 2015 that would last a year into twin wash-outs in Jan and Feb 2016.
The final high, the Secondary High in Feb 2020 was 5 years after the 2015 high.
To mention a few 5 year cycles.
The pre-crash Covid Primary High was on January 22, 2020.
The Secondary Bull Trap high was on FEBRUARY 19.
As offered in yesterday’s report we want to be on alert for a possible Bull Trap high followed by accelerated momentum. To the downside.
Today is January 22.
From the Jan 22 peak in 2020, the SPX dropped from 3337 to 3214 or just shy of 4%.
As long as we’re looking at analogs, a roughly 4% drop from yesterday’s high equates with the low 5800’s.
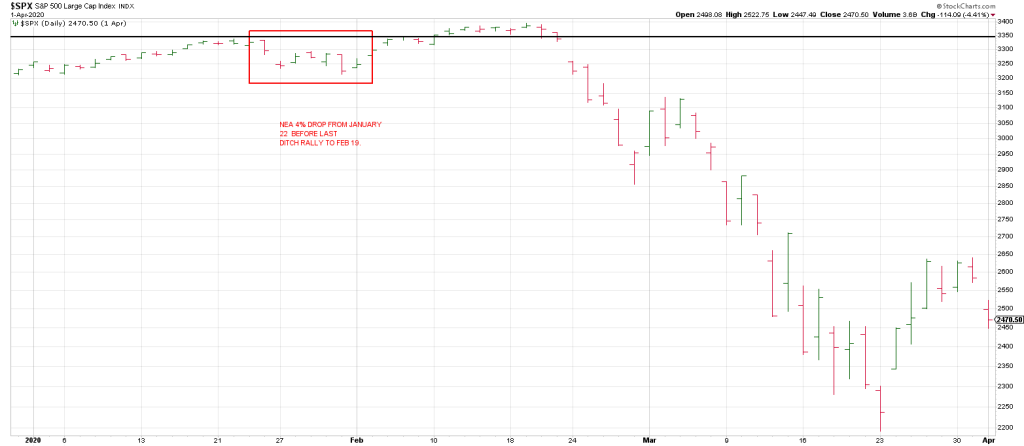
It would be one for the books if the SPX dropped all the way back to test last weeks low just below 5800 and then turned around and struck an all-time high…quickly.
But analogues often get to the fork in the road and take it… to paraphrase Yogi Berra.
Given the SPX’s 6 day 270 point (3 X 90 degrees) rocket, it would not be surprising at all to see a sell-off play out.
Today is day 7 which often is a turning point.
A 50% retrace projects to 5912.
Just above that is the 20 DMA at 5933 and our old friend 5945 which is 180 degrees down from high.
Only breakage below 5812 that sticks will open the door to a test of the 5800 low region.
That said, as offered early this month in The New Volatility, 2025 would be a doozy.
Be that as it may my expectation is a pullback is on the table…probably sharper than is commonly expected after this ramp.
A gap up on the open today followed by a reversal that offsets the gap triggering a Jump The Creek sell signal would be a pretty sell setup.
Today is Day 7 from last Monday’s low.
Turns often occur on the 7th day, week or month of a trend.
The cherry on top is may be a Time/Price square-out:
Today vectors 605 for 6050. The SPX closed at 6049.24 yesterday after striking a high of 6051.51.
“It happens that crashes and panics often are precipitated by the revelation of some misfeasance, malfeasance, or malversation (the corruption of officials) engendered during the mania. It seems clear from the historical record that swindles are a response to the greedy appetite for wealth stimulated by the boom. And as the monetary system gets stretched, institutions lose liquidity, and unsuccessful swindles are about to be revealed, the temptation to take the money and run becomes virtually irresistible.” Charles Kindleberger, Manias, Panics and Crashes