“I’m locked in tight, “I’m out of range.” Things Have Changed, Bob Dylan
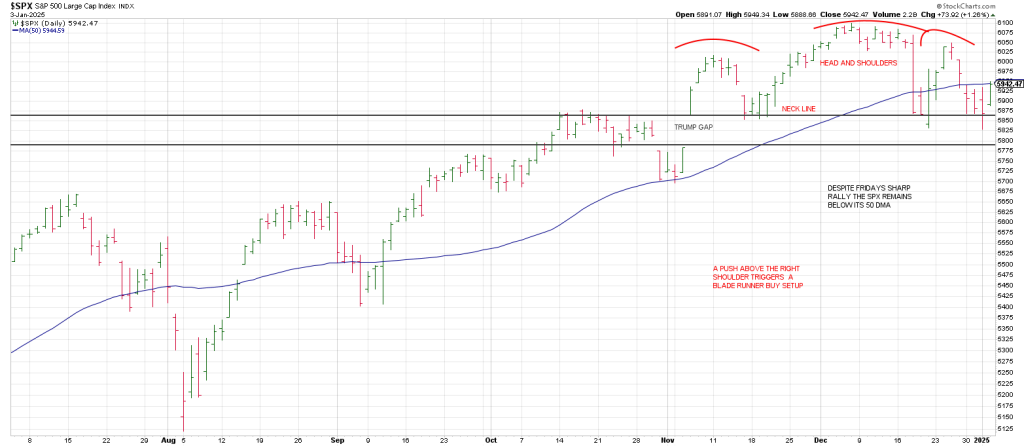
The market is below where it was after the Trump Bump.
After two months the SPX is below where it was on the close of November 6th.
Think about that for a minute.
We’re in a melt-up that hasn’t gone anywhere in two months?
And the SPX has traced out a possible Head and Shoulders top
Remember when people were tweeting after the election “just buy and hold for 4 years”.
People study years to become doctors, lawyers, engineers and teachers (I’m sorry to put lawyers in the same class).
But when it comes to markets and trading, people will point and click with little study or analysis with little understanding of market movement.
The public assumes because Wall Street tells them you always have to be in the market because the market can’t be timed, it is the truth.
In short, in markets the distinction between what is fallacy and truth is masked by momentum.
This is dangerous because momentum is greatest and most persistent at the end of cycles.
Wall Street relishes pointing to strength in the market as strength in the economy.
Was this true in 1929? The US economy was considered to be “roaring” before the Great Crash.
Unemployment was low, consumer spending was high. It was a “Permanent Plateau of Prosperity”
.
Was it true in 2000? Unemployment was low, GDP growth was robust growing at 4% above inflation. It was a New Paradigm.
Was it true in 1966 when it appeared the economy could handle “guns and butter”? It was the “Go Go Sixties”. Just before a secular bear market started that lasted until 1982.
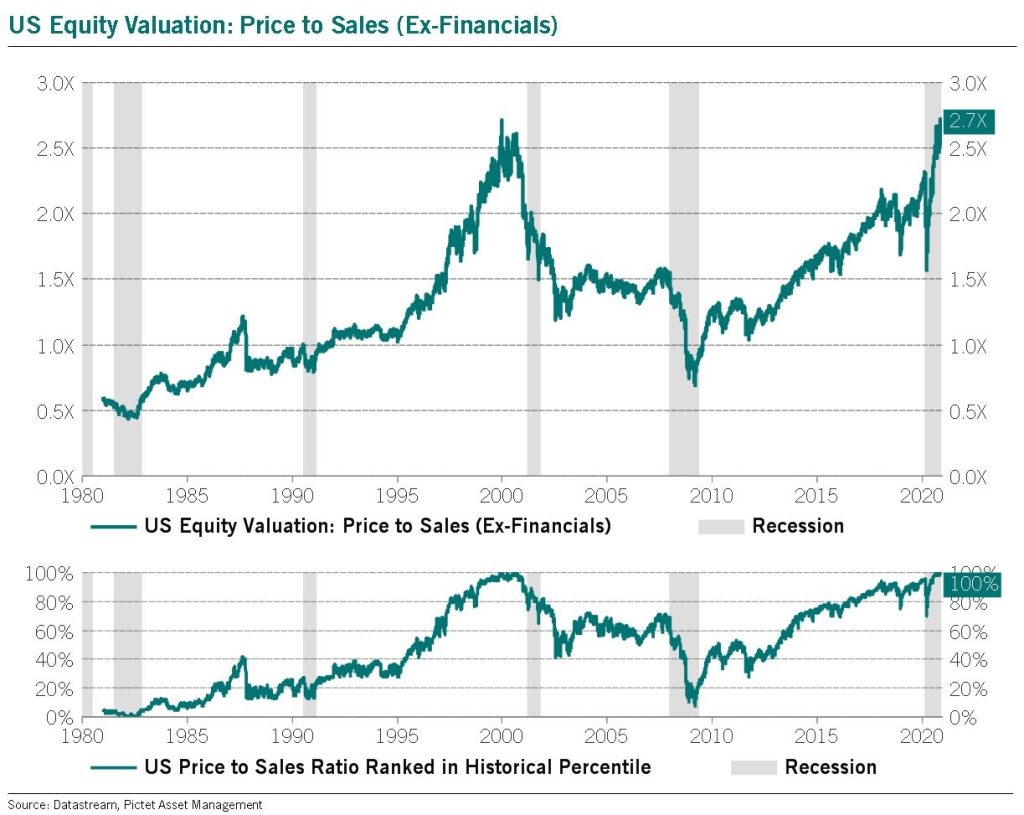
Currently market valuation is extreme.
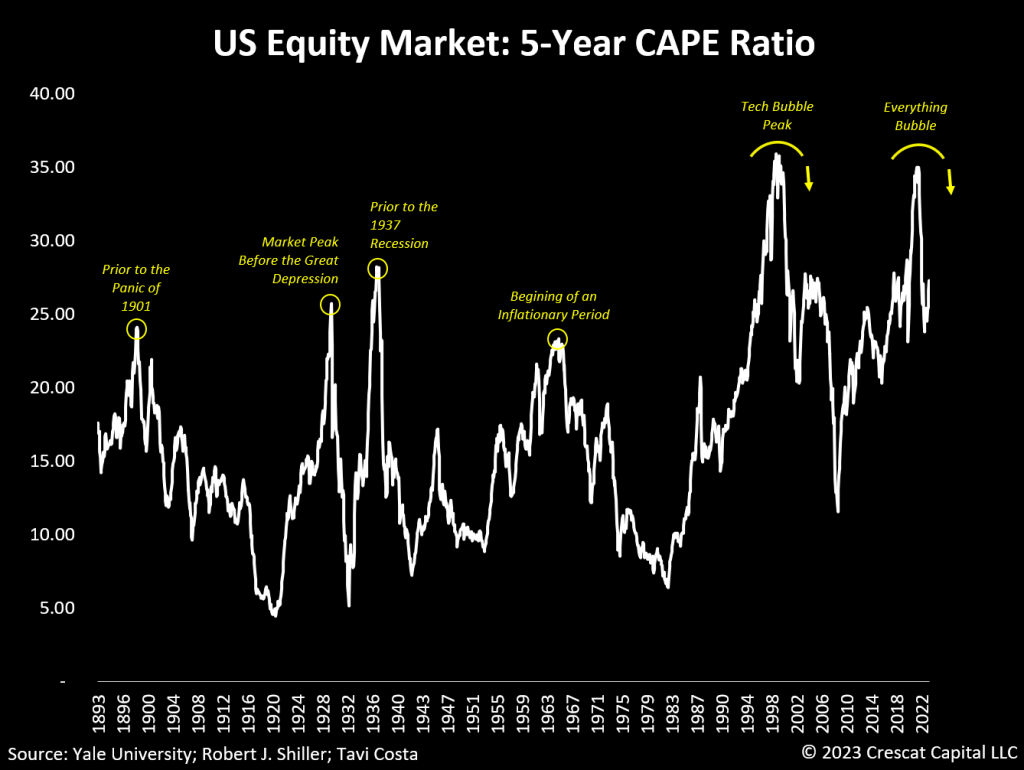
After testing the peak tech bubble levels on a 5 year cyclically adjusted P/E ratio, stocks are still move overvalued than they were before the Great Depression in October 1929.
1) Notice where the ratio was in 1937 prior to an echo of 1929 crash. The Great Crash from 1929-1932 was “in the rear view mirror” or so market participants thought. The advance from the 1932 Depression low to the March 1937 peak was nearly a 5 fold advance, albeit from “depressed levels”.
The advance from the 2009 lows of 666 has seen more than a 9 fold advance.
The decline from the 1937 high was 50%.
2) Now note the test of the tech bubble peak in 2022. The market declined following that test. Is it possible the rally since the October 2022 low is a B Wave following the 2022 bear market A Wave decline?
It is not unreasonable to expect a 50% decline from this double top in the CAPE as in 1937. From the recent 6100 peak that takes us back to the low 3000 region around the pre-Covid crash highs.
Interestingly, just as the 1937 peak followed a 5 year run from the 1932 low, we are roughly 5 years from the 2020 Covid lows.
The message of the above chart is the complete rebound in the CAPE Ratio after two symmetrical debacles: the DJIA from the 1929 peak and the NAZ from the 2000 peak 70 years later.
The DJIA dropped 89% after the 1929 top.
The NAZ dropped 80% following the 2000 top.
The similarity in the busts 70 Gann Panic years apart and the subsequent rebound in the CAPE ratio in 1937 and 2022 is compelling.
Again, the implication is that the rebound from the October 2022 low is a B Wave advance.
Impossible? Not at all. The 5 YEAR RALLY off the 2002 low into 2007 was a B Wave.
The devastating Great Financial Crisis followed.
In sum, the comparisons between the current economic environment and the prosperous period of the 1920’s backstops the bullish narrative.
But back then, in the heart of the 1920’s, the 5 year CAPE ratio was less than 5, the lowest level in history.
The situation is totally different today.
If only the market cared about fundamentals and the economy.
It does. It’s just that cares in its own time. it matters when it matters.
The capitalization weighting of the SPX has complicated things.
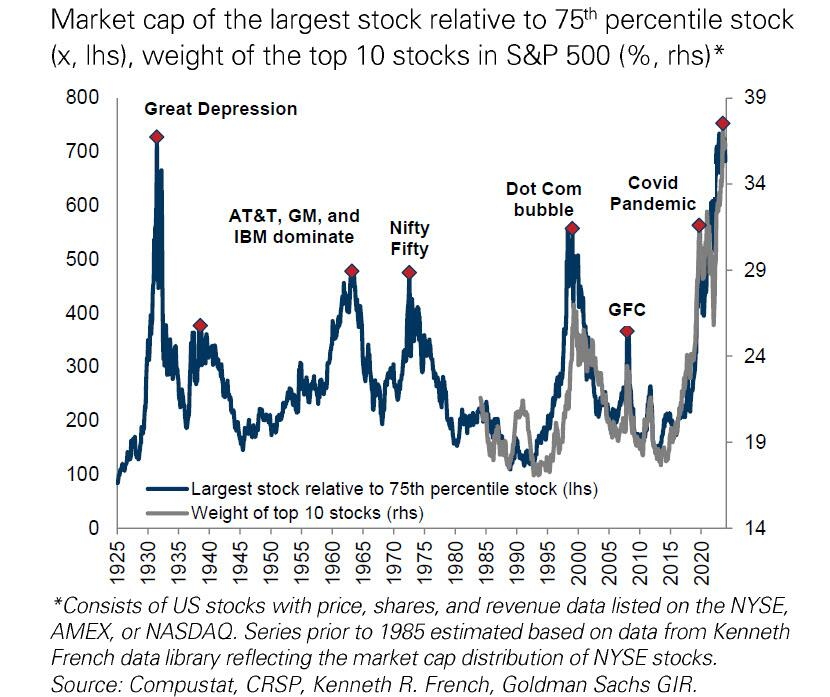
The Magnificent Seven are the tip of the spear of the valuation sword.
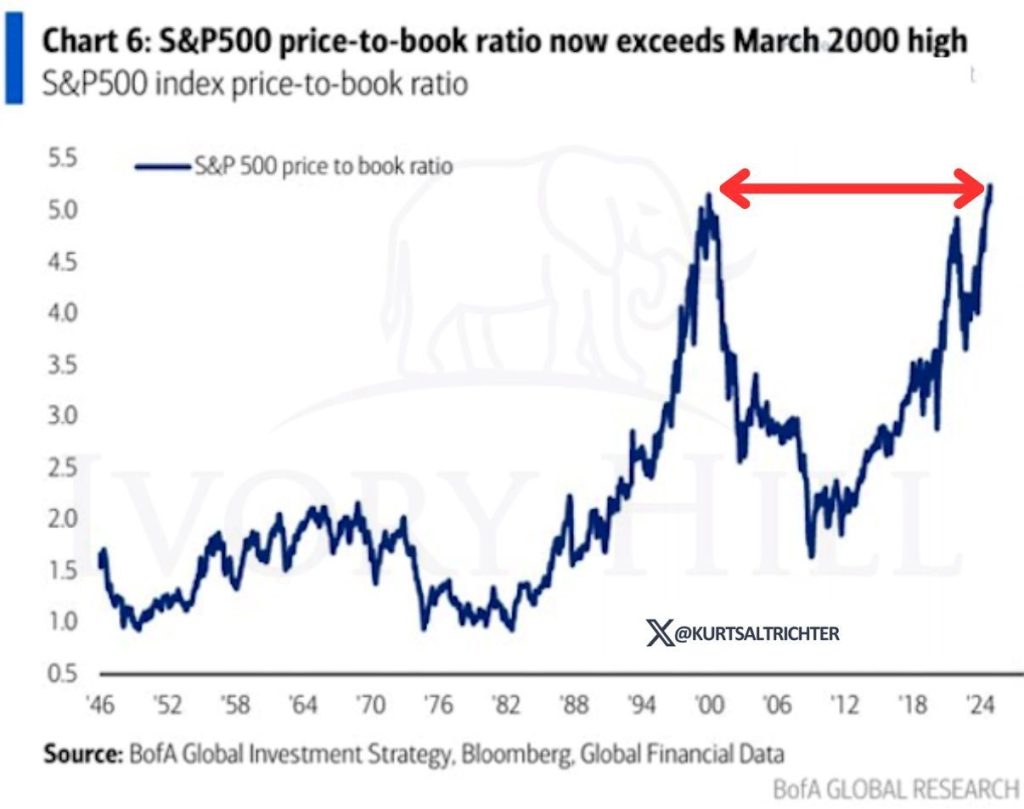
Another measure of extreme valuation is the Price to Book ratio.
At the end very end of big bull markets. the willingness to use leverage is one of the great peak indicator. It is a supreme measure of confidence.
Confidence booms at the end of a confidence game.
The chart below shows the Rydex Total Leveraged Bull/Bear Ratio, which at the week of the SPX top on December 6, soared to within a few points of its all-time high.
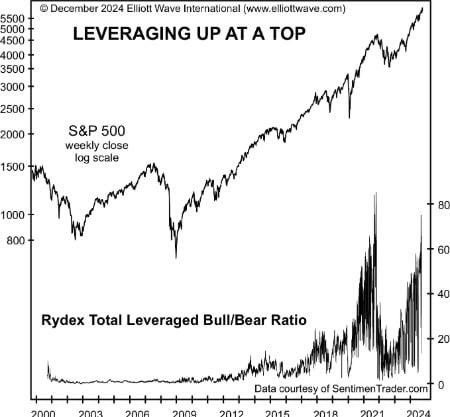
The ratio exposes that leveraged Rydex investors have 80 times more money betting on a rise in the SPX than a decline.
Leverage exposure is Thelma to the Louise of Risk.
When the turn comes, it will be a cliff not a correction. The forced sale of unrelated assets due to margin calls will exacerbate the decline.
Sentiment indicators such as these in tandem with our use of major Time and Price cycles and market structure are the hallmark of our analysis.
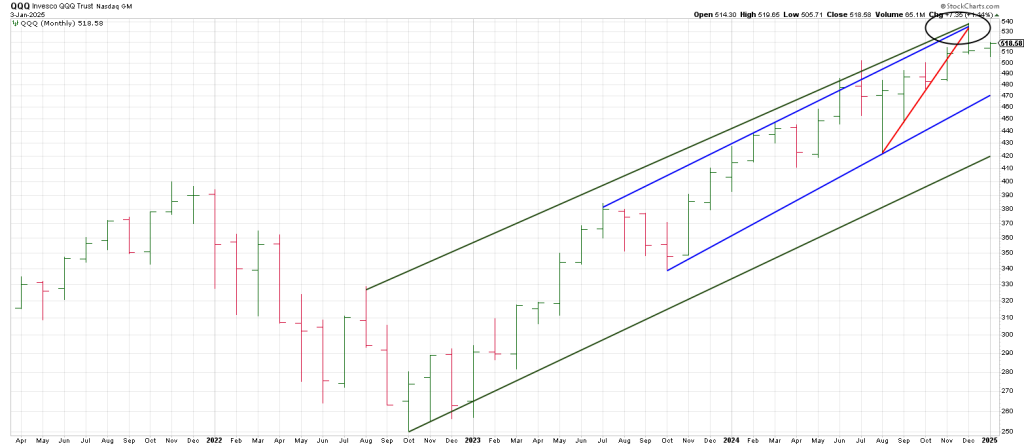
Which brings us to the index the QQQ.
The Q’s have been the clear leader, up more than 20 fold since the 2009 low versus the SPX up 9 fold from the same period.
From the October 2022 low the Q’s were up more than 100% at their December peak versus the SPX up 75% in the same time frame.
A monthly QQQ shows the monthly signal reversal bar in December at the top of a well-defined trend channel
Let’s drill down to a daily QQQ.
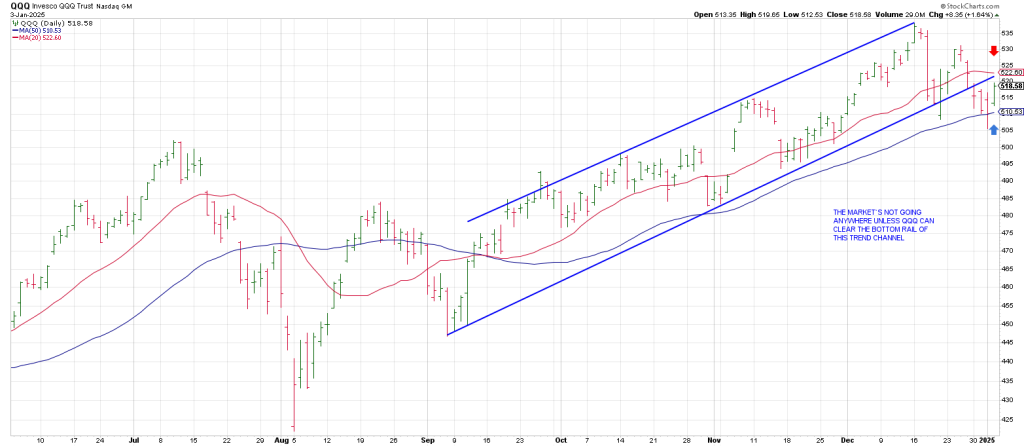
The Q’s show a 90 – 100 day potential blow off from September 6 to December 16 mimicking the roughly 90-100 day blow offs in 1929 and 1987.
What should get your attention is the plum-lie drop directly off the top where a daily trend channel was struck.
Last week we stated our expectation was for a big rally into the weekend.
The market started up on Thursday but faltered then exploded on Friday.
On Thursday the Q’s produced their first close below their 50 day moving average since the early low.
Friday was a Gap and Go above the 50 DMA.
Trade over Friday’s high puts the QQQ in the Minus One/Plus Two sell position…as it was on December 26th when we warned of a Rug Pull on deck.
The market skidded after XMAS.
Allow me to explain. Going into December 26th, the 3 Day Chart was pointing down.
December 26th satisfied 2 consecutive higher highs while the 3 Day Chart was down completing a Minus One/Plus Two sell setup.
So today is going to be pivotal. With the Q’s (and the SPX) closing near session highs Friday it should be easy to see trade above Friday’s high.
If so and the market falters, it’s a dangerous pattern carving out another lower high in the context of a series of lower lows.
The strong likelihood is it would open the door for a second break of the 50 day line.
If so the second mouse will get the cheese for the bears.
Last week the Q’s tested the July peak near 504. Prior resistance SHOULD act as new support. But if it is not then breakage below the 50 DMA opens the door to a failure below the Nov 6 Trump Gap.
Taken together, failure below this technical trifecta of downside pivots is the sign of the bear.
Alternatively, if momentum shows up and sticks we could see another last ditch rally.
While Friday may not have seemed so impressive with the Q’s up 1%, many momentum stocks were on fire.
For example Hit and Run took VST long before the close Thursday. It was up over 12 points.
Hit and Run members bought RDDT on Friday morning. It exploded.
Hit and Run initiated IONQ at 39.30 on Thursday. We rang the cash register on its rip north of 47 on Friday.
Other names on the Hit and Run radar like CRS and COHR paid dividends at the end of last week.
In sum many individual names soared on Friday. We should know if there is any traction or whether the Louise of Risk has driven over the cliff by mid-January when the Gann Panic Cycle will exert its downside influence.