Yesterday’s report was titled New Year, New Volatility.
A 10 min SPX for the first trading day of 2025 bears out that notion
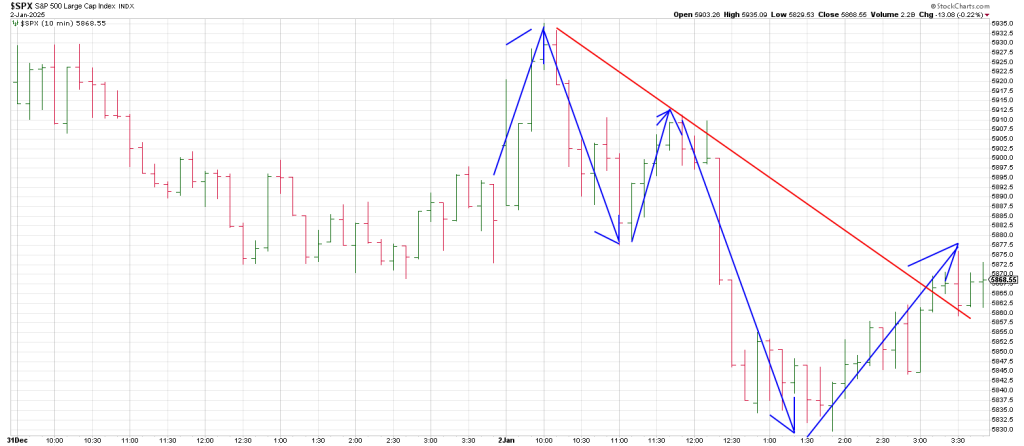
Markets surged on the open with significant breadth and momentum. The SPX attempted to recapture its 50 day line but squandered the opportunity faltering just below its 50 dma.
It reversed from just below the key 5945 square-out, 180 degrees down from the 6100 all time high.
Momentum was in overdrive overnight with the SPX threatening to vault over its 50 day moving average putting it in a position for an drive to test the December 26th 6050 high.
Above that could have seen a nominal all-time high into today/Monday.
But the bulls snatched defeat from the jaws of victory.
The failure from the 50 DMA triggered a deep sell-off.
This is how declines from major highs shape up: rallies are sold producing lower highs.
Either the SPX has bearish 3rd lower high or the next failed rally will produce a 3rd lower high.
The price action underpins the setup into the Gann Panic Window 49 calendar days from high:
Into January 13th.
That is 7 weeks from the Dec 6th all-time high.
Gann stated 7 is the number of panic.
The failure of the SPX to hold its 50 DMA mirror the price action off several major highs.
Notably the October 2007 top.
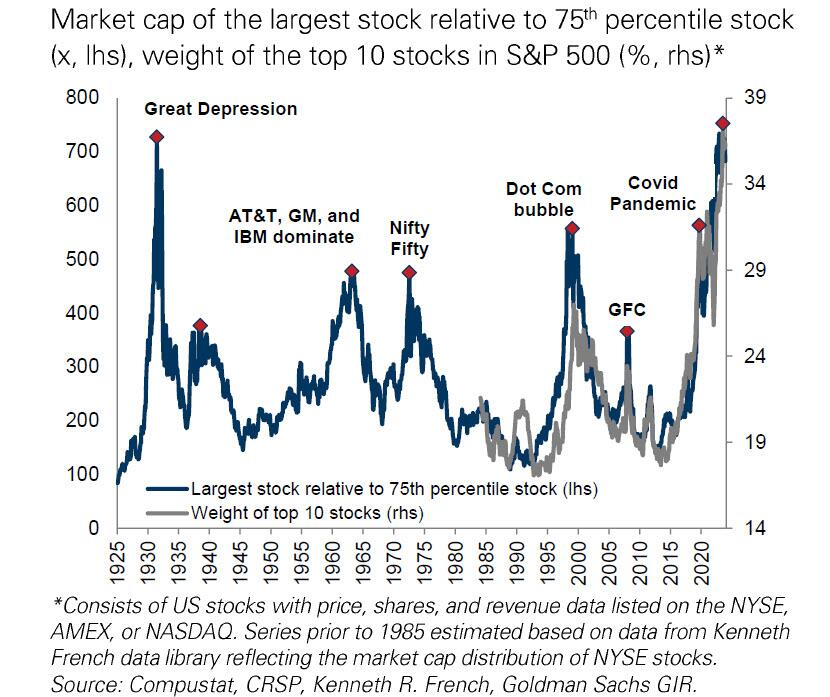
This weekend we will be working on a report for Monday examining the stunning divergence between the market advance in 2024 and the sharp decline in the McClellan summation Index.
Suffice to say that despite the McClellan Summation Index decline of 1471 points year over year in 2024. The SPX ADVANCED 23.3%.
This highlights the rot in the market’s internal structure.
The SPX is a cap-weighted index. The components that comprise the SPX have a percent contribution based on their total market capitalization.
It’s the Mighty Mag, like the Nifty Fifty of the early 1970’s.
The chart below depicts the situation.
TSLA’s recent spike and reversal is a harbinger of the ‘new volatility’.
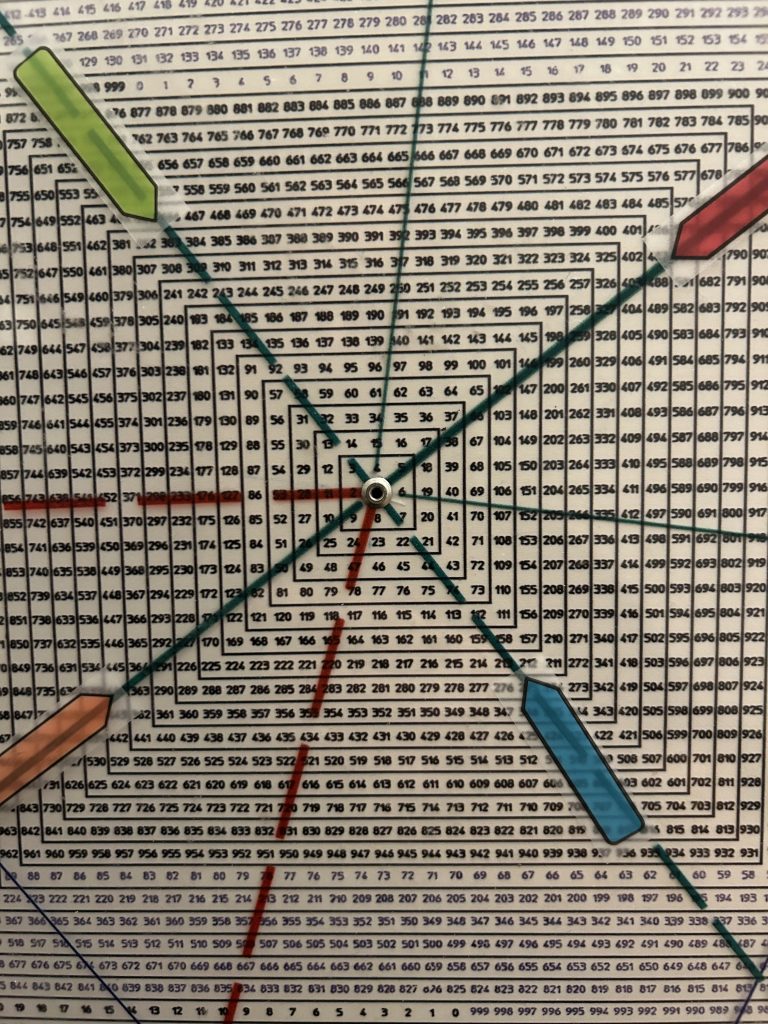
When TSLA was in the 420’s the Square of 9 Wheel projected a drive to 474.
It overshot to 488 where it left a large range Key Reversal day.
A daily TSLA shows the runaway Wave 3 move to 488.
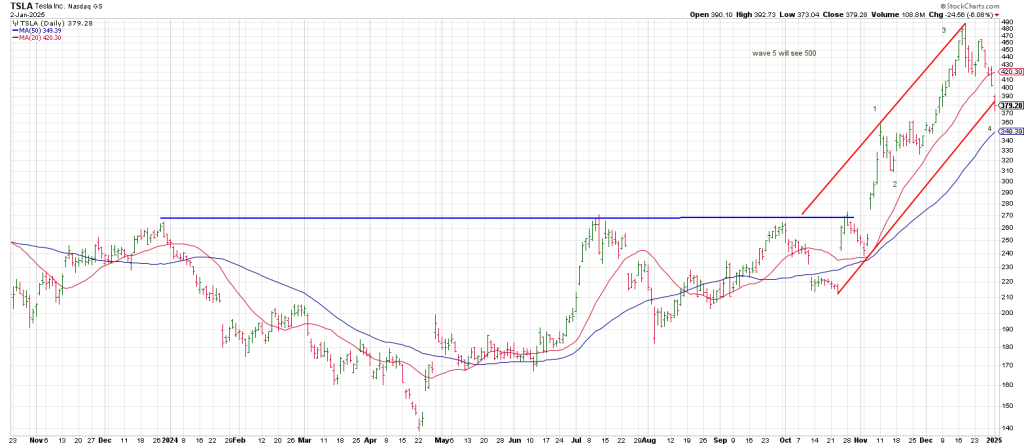
Last week the presumption was that the 404 region would act as support as that is 360 degrees down.
However, it was ill advised not to use a stop just below 404 as TSLA had undercut its 20 day with authority.
TSLA is in a Wave 4 correction that has already test the bottom of a trend channel.
90 degrees down from 404 is 382,
180 degrees down from 404 is 363, This equates to 540 degrees down from the all-time high.
In other words 363 cubes out with the high.
There is a strong likelihood this region will define the Wave 4 low.
It ties to the December 5th breakout.
The odds are TSLA trades below this weeks low next week turning the 3 Week Chart down.
The first time the 3 Week Chart turns down following a vertical run should be a good buying opportunity.
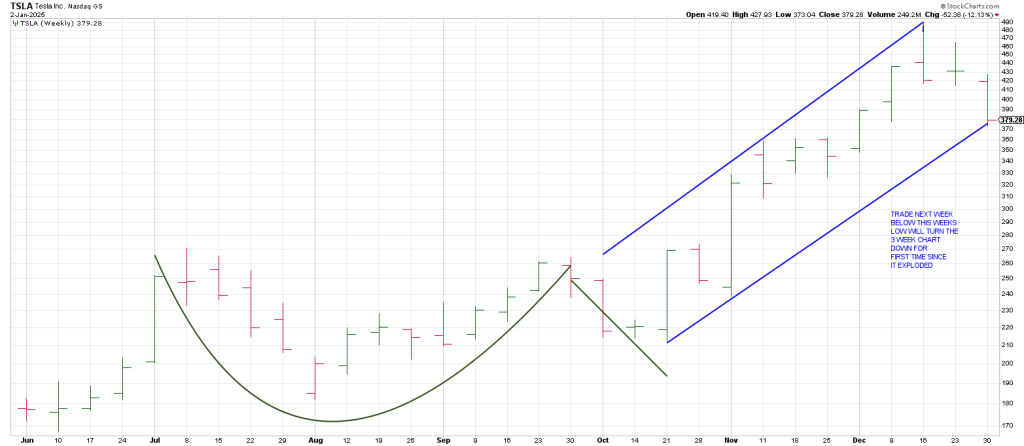
363 squares out with late January so the presumption is that if TSLA drops to the 363 region it will back and fill until late January.
The key 404 region ties to the top of Thursday’s gap window and will be near term resistance.
Until that gap is offset TSLA is spinning its wheels as to Wave 4.
Once the gap is cleared and holds, Wave will be in progress.
QQQ’s series of red candles since its December 16th peak followed by a drop to its 50 day is a hallmark of the outbreak of volatility.
The Q’s have snapped their 50 day line for the first time in 4 months….September 3rd, 120 days/degrees ago.
Notably its 3 Day Chart turned down directly off its all-time high and we are BELOW that level (509.29).
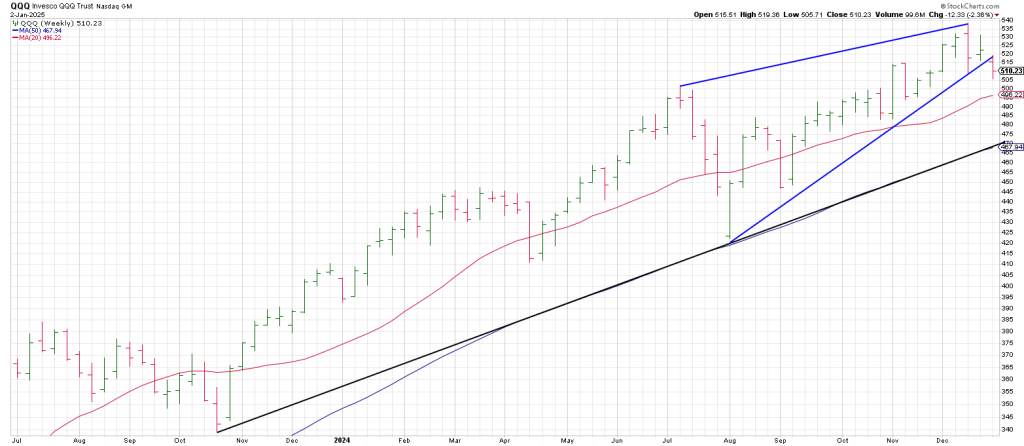
Following a large range Key Reversal Week 2 weeks ago, QQQ fell out of a Rising Wedge this week.
What is the intermediate target?
I connected the October 2023 low with the early August 2024 low.
Currently that line resides at the 470 region which ties to the 50 week moving average which hasn’t been tested since early August.
Early February is 180 degrees from early August setting up a potential time frame for QQQ to be pulled lower.
To what price?
From the 539 peak 90 degrees down = 516.
180 degrees down = 494.
270 degrees down = 472. This ties to the trend line from October 2023.
Breakage below the trend line opens the door to 360 degrees down at 450.
Thursday decline broke the 50 day line but the Q’s rallied to close just a tad below the 50 day.
The Q’s also tested the July peak…503.50.
Prior resistance ‘should’ act as new support
If it does not the door is open to 494…180 degrees down.
Interestingly 494 squares out with Thursday/Friday.
The takeaway is downside acceleration could play out with the Q’s being magnetized to the tickle the 495 strike today/Monday.
In sum, the S&P futes were up 60 points before the open.
The high on the cash was 5935 (just below the key 5945 region, 180 degrees down from high) up 52 points.
The session low printed 106 points from the morning high.
The cross currents between winners like AAPL being sold for tax selling in the New Year and losers like
MDB being bought as money managers that may not have wanted it on their books at the end of the year scooped up down and out names.
Then there are the momentum winners from last year that caught a bid on Thursday.
Names include CRS, COHR, VST and RDDT to mention a few.
Metals got the memo carving out a nice trend day to the topside.
GDXJ had a Gap & Go trend day producing the largest gain since the waterfall decline from its October 22 top at 55.58.
GDXJ was up 2.08 on an expansion of volume.
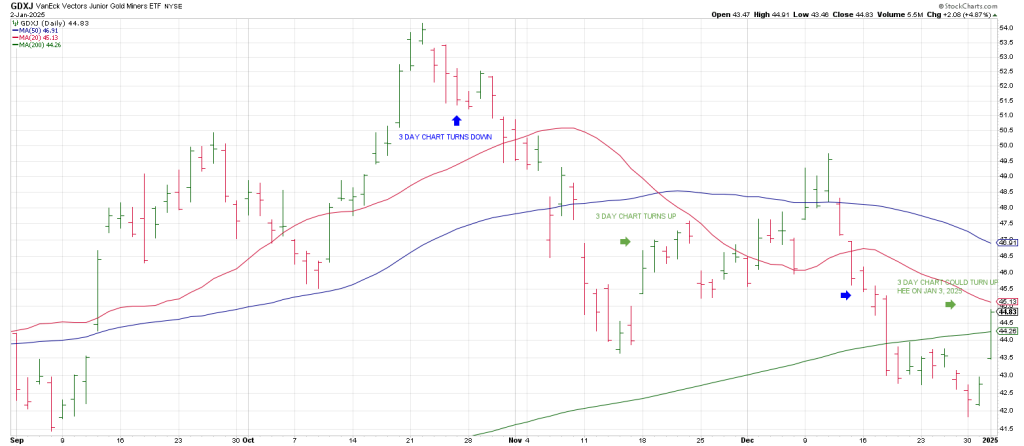
Now comes the moment of truth as GDXJ flirts with its 50 strike into today’s OpEx.
Was this just another squeeze in the Algomatic playbook?
How will we know if a new upleg is on deck?
First, a turn up of the 3 Day Chart and the subsequent BEHAVIOR will be telling.
Importantly, GDXJ’s 3 Day Chart turned down directly off the October 22 high.
It turned up on November 19th which led to a choppy countertrend rally to a false short-lived push over its 50 day moving average in December.
The failure at the 50 day announced a second leg down with the downturn of the 3 Day Chart again on December 16th.
The behavior should GDXJ attack its 50 day line (which is considerably higher at 48) will be critical to observe. But before that it has to contend with its 20/200 MA Bowtie at 45.50 ish.
GDXJ hourly left a Bull Flag yesterday after the initial surge so the door looks open for a push that tickles the 45 strike with micro resistance at 46 region.
In sum, GDXJ could turn its 3 Day Chart up today on a challenge of the near aforesaid resistance, 45-46.
The next pullback will tell the tale.