“Had to find some higher ground
Had some fear to get around
You can’t say what you don’t know
Later on won’t work no more” Tom Petty, Square One

“That men do not learn very much from the lessons of history is the most important of all the lessons that history has to teach.” Aldous Huxley
“Every generation imagines itself to be more intelligent than the one that went before it, and wiser than the one that comes after it.” George Orwell
Below is a monthly chart from 1900.
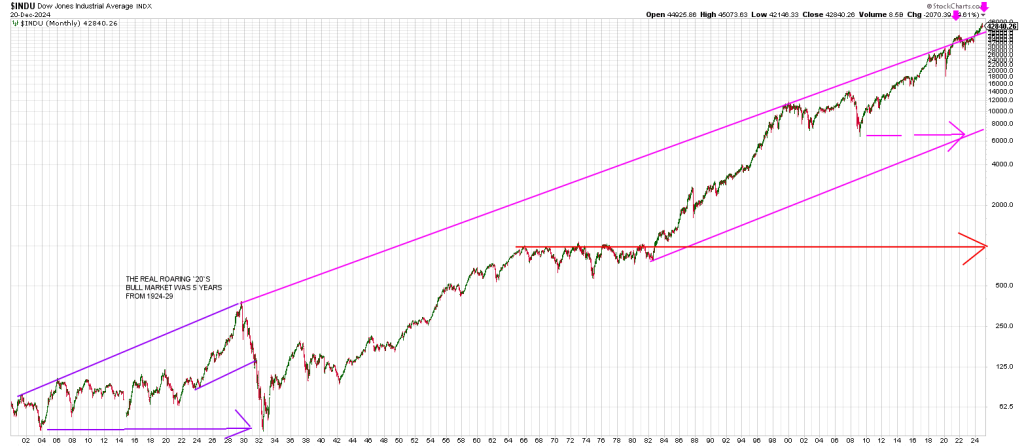
I created a monthly trend channel (magenta) connecting the two highest peaks in the CAPE Ratio (the cyclically adjusted P/E ratio)— 1929 and 2000.
The third highest CAPE Ratio is occurred this year, late in 2024.
Notice how the January 2022 peak Pinocchio’d the trend line.
January 2022 is virtually exactly 100 years from the August 1921 low that marked the low of the decade of the 1920’s.
That low was 63.90.
Moving the decimal point it is interesting that we get 639.
“If you only knew the magnificence of the 3, 6 and 9, then you would have the key to the universe.” Nicola Tesla
Nothin’? Well the bear market low was on 3/6/09 at a price of 666.
The top prior to the Great Depression was on 9/3.
The DJIA high on Jan 4, 2022 was 36,934. 369
The bear market low in 1921 prior to the bull market of the 1920’s was on August 24/1921 at a price of 63.9.
You can’t make this stuff up.
But that’s not what this is about.
Zeroing in on that same trend line from 1900 the monthly DJIA below shows the move above in November on the Trump Ramp and this months reversal right back below this historic trend line.
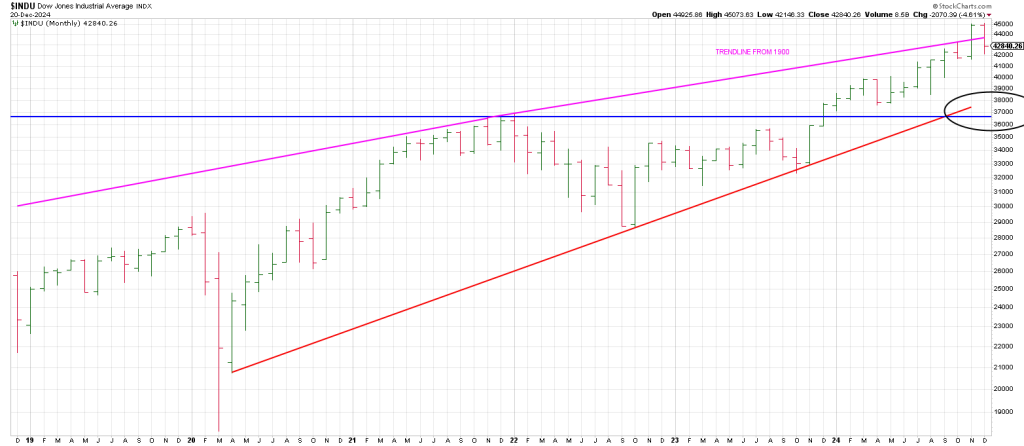
The Maginot Line is around 37,000. Obviously that is 5,000 DJIA points lower.
You don’t want to be lugging longs around if that’s around the corner and 37,000 may act as a magnet due to the confluence of the Bottoms Line from 2020 and the intersection of the horizontal line from the 2022 top.
The 1929 “Plateau of Permanent Prosperity” is thought of as The Mother Of All Peaks.
One reason is that it timed the Great Depression.
Whether it ‘caused’ the Great Depression or was discounting/foreshadowing it is an argument that that still gets waged.
Be that as it may, it was a generational top. It took 25 years for that high to be exceeded.
It took 20 years until 1949 for a new secular bull market to begin.
From 1949 to 2024 is 75 years
From 1932 low to the major 1982 low is 50 years.
From the 1974 bear low to 2024 is 50 years.
The real Roaring Twenties bull started in 1924 as walked through in a report last month.
From 1924 to 2024 is 100 years.
From 1924 low to 1974 low is 50 years.
A momentous Low to Low to High Cycle may be on the table.: 1924 to 1974 to 2024.
These are natural geometric divisions in time that the legendary W.D. taught were of paramount importance.
According to Gann, a 100 year cycle signifies a period of major trend reversals where historical patterns may repeat with notable impact.
100 years is 10 of Gann’s Decennial Cycles by which he forecast markets.
So the question is if the SPX is working on a major top, is it as big a top as 1929?
It may be one degree larger on an Elliott Wave basis.
Is there any one you know who thinks that is a remote possibility?
Probably not. By that standard alone, the time factors and historic divergences we’ve been pointing out over the last few months should not just raise your eyebrows, but the hair on the back of your neck.
The Great Crash in 1929 was not a one off like 1987. The decline from 1929 perpetuated a bear market that tested the DJIA low from 1903.
In 1932 the DJIA dropped to 40.56 actually undercutting the low struck a generation prior, 29 years earlier in November 1903 at 42.15.
I suspect the vast majority of market participants thought the market was thoroughly washed out in 1931 when it “corrected” back to test the breakout point of the parabola testing the bottom of a trend channel (see above chart again). However, the bear was not done. There was another 70% downside over the next year.
On the other side of the Matterhorn, “buying the DIP” is a treacherous proposition.
Oversold sets new records into the abyss just as overbought set new records at the summit.
The Tops Line connecting the 1929 top and the 2000 top was pierced in January 2022 before a correction that tested the early 2000 pre-Covid crash. Textbook stuff.
Now the DJIA once again pushed above this 95 year trend line. Is it another Pinocchio, a false Throw-Over?
This is one of the reasons I’ve suggested that the current advance off the October 2022 low may actually be a B Wave, another Miss Direction B Wave ala the rally into October 2007.
A smaller bearish B Wave played out from October 2019 into February 2020 prior to a crash.
Despite being a persistent runaway move to record highs the structure was not impulsive thus signaling the crash-wave into March 2020.
In other words, the decline from Jan 2022 to October 2022 was an A Wave with the ensuing advance a potential B Wave into 2024. Mirroring the 2003 to 2007 B Wave.
A pernicious C Wave would follow if this is correct.
But that might be within the framework of a bull market.
What if a bear comes out of hibernation?
How low could the DJIA drop?
Could price return to where the advance started in 2009?
If the DJIA returned to where it was a generation ago we’d revisit the lows in 1994/5 at 3600 where the market started the explosion into the 2000 top.
If it breaks the trend channel at 8,000 could the Unthinkable happen with a cataclysmic drop to 1970’s high and the 1982 low around 770?
Unthinkable? It was unthinkable to the vast majority in April 1930 Apres Le Deluge when a ‘return to normal rally’ was playing out that the DJIA would return to the lows a generation earlier.
January Outlook
There are several reasons to think the bear is going to exert his influence with authority in January.
The Hit and Run report for Monday October 28th discussed Gann’s coded novel Tunnel Thru The Air and what I believe points to his terminology of “Wheels Within Wheels”:
W.D. Gann stated that his novel Tunnel written in 1927 contained a “mysterious and valuable secret.”
He went on to say that the purpose of the book is to demonstrate the immutable laws of nature.
Immutable laws are laws which man cannot change (even the Fed) such as change of seasons and the rotation of the planets and their GEOMETRICAL relationships to one another.
It is fascinating that the planets placement to each other follows a Fibonacci relationship.
Does the rotation of the angles of planets to one another and their geometry mirror similar geometry producing timing points in markets?
There is a simple but effective means to measure price and time using what Gann called the Zero Point or beginning point.
When you look at a square, the edge or turn is at 90 degrees, 190 degrees, 270 degrees and 360 degrees.
The Square of 9 solves the age old enigma of squaring the circle. When Time and Price meet, when Price ties to a particular day/week, a turning point can be expected.
Gann stated that every important turning point is a square-out.
He did not add that every square-out is NOT an important turning point.
Not all square-outs are created equal.
Therein lies the T Rex in the trading ointment.
As well, there are price square-outs and time square-outs.
But it is when both time and price are integrated/align that there is the strongest likelihood of a turning point.
Often the strongest square-outs occur in the context of ‘natural cycles’, astronomical cycles.
I have found the beginning of the minor cycle to be the 360 degree year.
18 months is the next cycle as it is 540 degrees/days…540 degrees comprising a true square or cube
(a 6 sided cube is 6 sides of 90 degrees = 540.
This January we will be 540 days/degrees from the important July 2023 high.
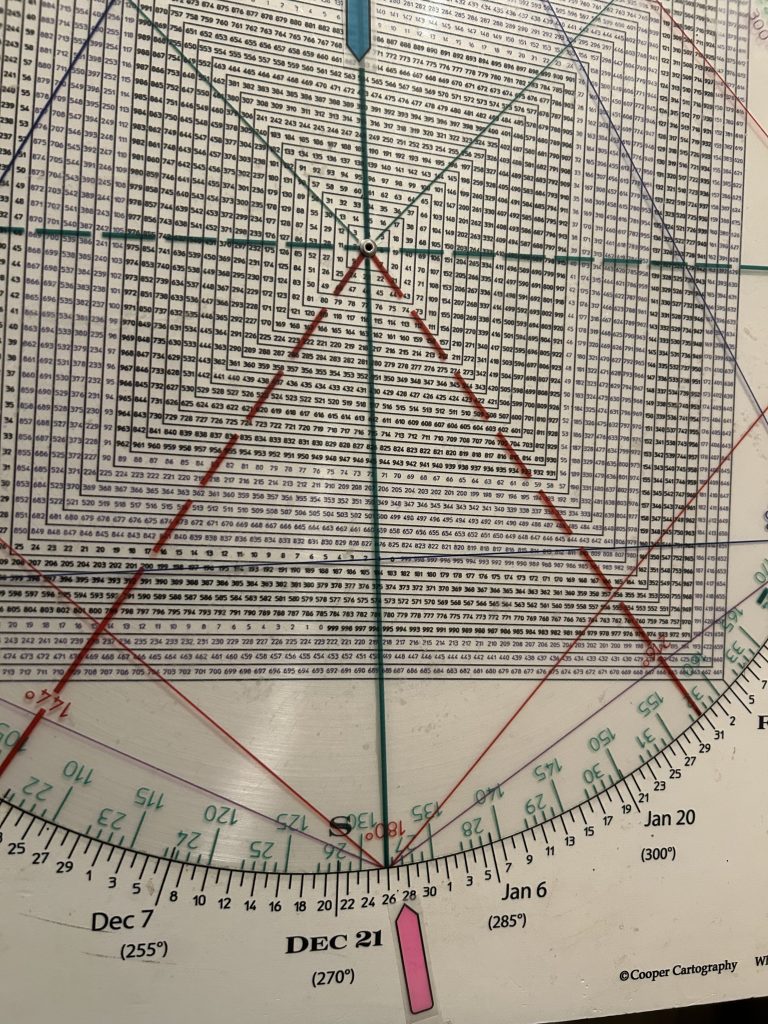
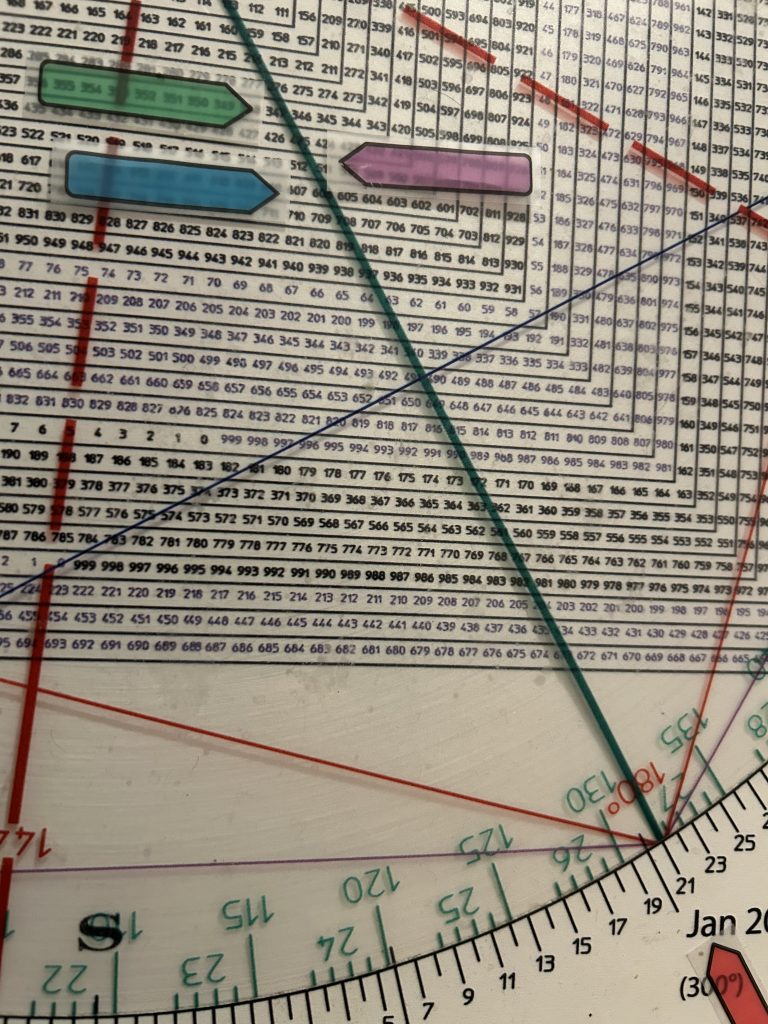
The value in using a physical square of 9 Wheel is that 90% of anything we learn is from what we see.
Place picture of sq of 9 wheel here
You possess the secret to turning points in natural astrological cycles and market cycles when you can see when they will occur in the future and the ability to see price and time on the Square of 9 Wheel.
My methods incorporates market cycles and natural cycles with market technicals.
This takes us back to Gann’s Tunnel Thru The Air and what is in store for 2025.
In Tunnel, Gann refers often to Marie Angel of Mercy.
I believe Marie is Mars.
Allow me to explain.
In many of Gann’s writings he refers to cycles within cycles, wheels within wheels, an outer ‘wheel and an inner wheel”.
In markets there are always two countervailing forces/cycles working simultaneously –a primary and secondary trend. Like a Double Helix.
I believe Gann is referring to the rotation of the inner planets and the outer planets.
Many financial astrologers consider Mars to be a trigger .
Think of it like the minute hand on a clock that triggers aspects of the larger planets which are the hour hand.
When the hour hand lines up with the minute hand may it may trigger a cycle/aspect.
We had such an angle with Mars near the top in March 2000.
There was such an aspect within days of the low in September 2001.
In 2008 with the market in a steep decline, the Mars aspect struck again in 2009 taking it out of its nosedive.
In late March 2020 during the Covid free-fall there were THREE different Mars setups exerting their influence.
Is it any surprise that extreme volatility took place.
I warn you these aspects do not exist in a vacuum. Trend change indications/techniques must be used in tandem with this study.
That said, knowing an aspect exists at some point in the future and seeing a pattern set up for a change in trend offers an opportunity to play both sides—the move into the turning point and the reversal in the other direction.
For example in January 2020 the SPX struck a high and dropped to its 50 day line.
It was the first test of the 50 dma in 4 months and the test elicited a rally as would be expected.
The rally made a nominal new high, but shortly thereafter price knifed below the January high.
It then gaped through the 50 day moving average.
Sound familiar.
The presumption was the market would drop into the aspect in late March 2020.
The Cycle did a good job. It took you by the hand and helped you out.
In late October 2023, the aspect struck again. It was a low leading to a 13 month blow off.
If you used the Monthly Swing Chart as a guide, the 3 Month Chart turned down in October 2023 suggesting at least a bounce. Why? A turn down in the 3 Month Chart is a rare bird.
In September 1929 there were FOUR of these aspects. As you know an historic top occurred on September 3, 1929.
In January 1973, there were THREE aspects within the first 3 months of the year. The presumption based on this cluster is the breakout was false. It was. The market dropped for 2 years.
At the primary low in October 1974, there were two aspects.
At the final low in December 1974 there were three aspects.
Obviously multiple angles/aspects are more significant than a single aspect.
Where are we now.
In July 2024 there were 4 aspects.
The market tanked. It left a Key Reversal Week and turned its 3 Week Chart down.
We got a Flash Crash in early August.
When the market eclipsed the July ‘natural cycle’ it telegraphed higher.
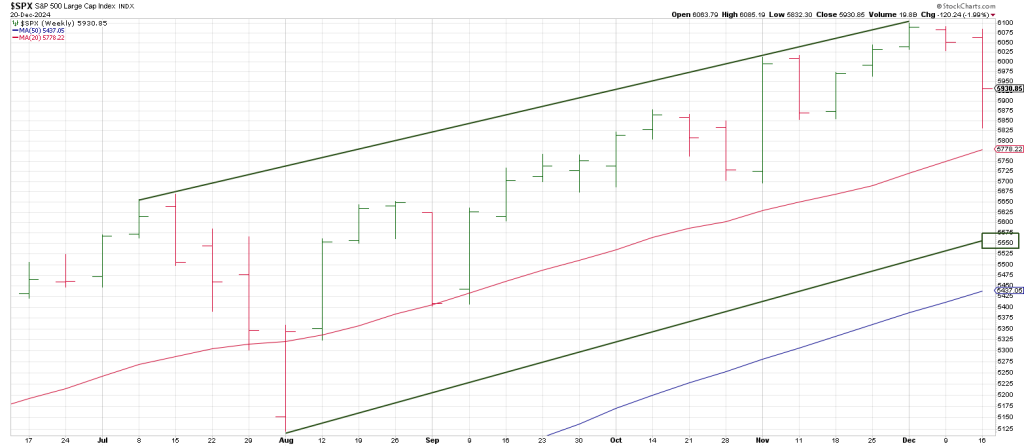
Likewise breakage back below the July 2024 peak of 5640-5660, will signal lower, likely with accelerated momentum.
Interestingly 5640 is 540 degrees down from the 6100 SPX all-time high.
In other words this is a cube down from the high.
In January the 5650 region ties to the bottom of a weekly trend channel.
Interestingly 564 is 180 degrees opposite December 26, the anniversary of the Christmas Crash in 2018.
What would Gann be thinking?
The odds for a downdraft are high.
For example QQQ left a Key Reversal Week last week.
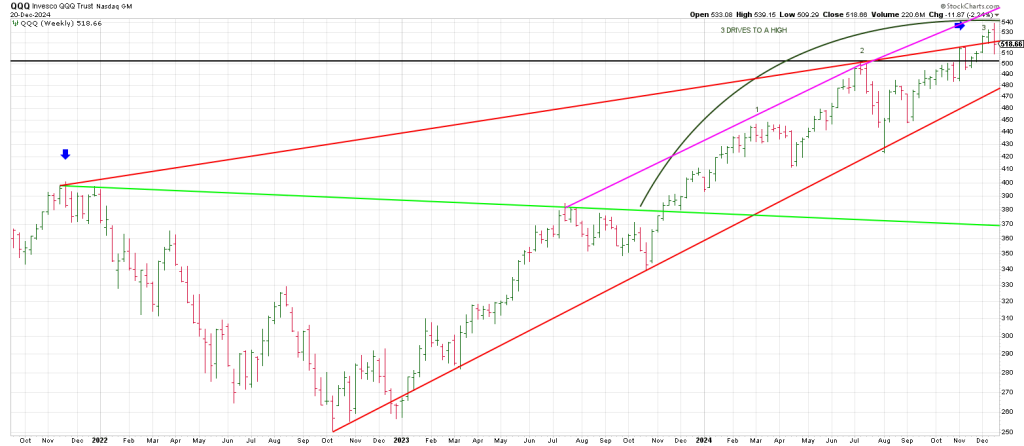
The last time it left a Key Reversal week was the week of the high on 11/22/21.
The July 2024 high is the 5655 which cubes out from the SPX high. The drop down from July 2024 is significant as well because it overbalanced in Time and Price any correction since the October 2023 low. In other words it lasted longer and was sharper than any pullback since the October 2023 low.
Breakage below 5650 underscores that the rally since early August was a blow off.
Prior resistance is supposes to act as new support.
If the July 2024 5650 peak is shattered the expectation is downside acceleration.
It opens the door to a complete unwind of the blow off from the August 5119 low.
511/512 (5119) points to January 20/21.
Is it possible the SPX will be at the August lows in that time frame which aligns with the Gann Panic Window?
If we don’t make a new high above 6100 and drop and stick below the SPX 50 day line again, the answer is yes.
To continue with the ‘natural cycles’ let’s see how they look in January.
A noted in October, there was one of these Mars aspects in late October and none until January 2025 when we get THREE.
We have a confluence of factors that warrant caution in January.
If early December proves to be the high, the Gann Panic Window starts January 11 and runs until January 25th.
January 11 is the anniversary of the 1973 top.
January 14th was the DJIA top in 2000.
1973 was 52 years ago.
On the Sq of 9, the number 52 is opposition January 6th.
In sum, stocks are in a precarious position.
In addition to the major cycles and divergences flagged in this space, we have 3 Hindenburg Omens.
The 3rd Hindenburg was produced on December 16th. There was an historic plunge two days later—one of the largest one day point drops ever in the market.
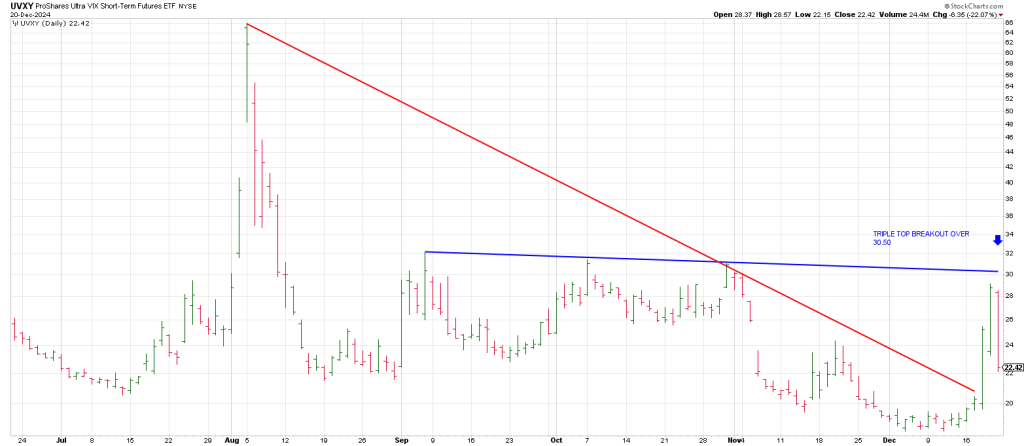
Combined with the potential for a Rule of 4 Breakout, a triple top breakout, on UVXY, a blaring siren is warning of the likelihood of a waterfall in January
The angle of attack to the downside on FOMC Wednesday suggests that was a harbinger of further downside acceleration. Think Covid tape.
Below is a daily SPX
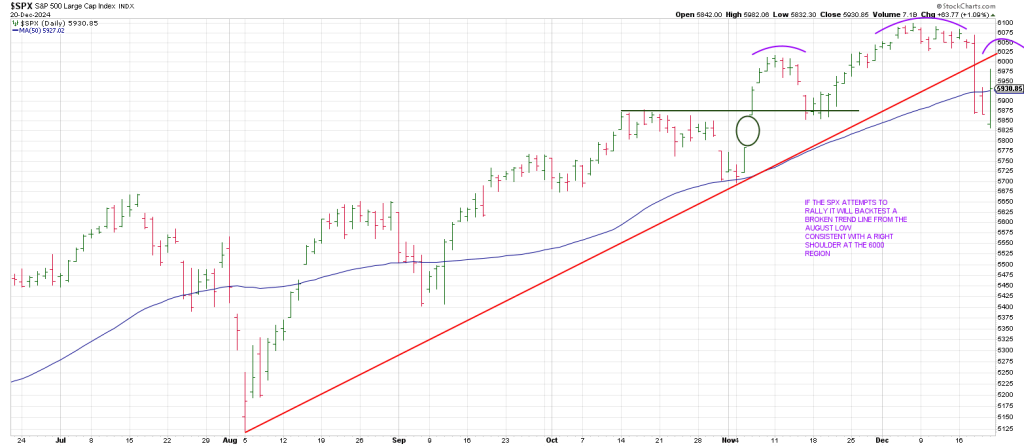
Wednesday broke trend from the August 5 low leaving two closes below the 50 day line last week.
Friday the bulls tried an emotional rescue tracing out a Large Range Outside Up Day (LROD)
Friday’s Lightning Rod may not electrify the market as just overhead awaits a bearish backtest of the broken trend line at around the 6000 region should the SPX push higher.
As well, a rally back to that region may perfect a Right Shoulder of a Head and Shoulders Top.
In sum, any further rally will likely be consistent with a bearish Wave 2.
Given the momentum of Wave 1 down, Wave 3 should be a doozy.
Breakage below Friday’s low triggers a Reversal of a Reversal (Keyser Soze) continuation sell signal.
Expect downside acceleration if that plays out.
Conclusion. There is something compelling about the idea of the SPX falling to the 5119 August low.
- This is consistent with the idea of falling out of a Rising Wedge as shown early last week.
- 511/512 on the Square of 9 aligns with the heart of the Gann Panic Window.
- 512 is roughly 2 revs of 360 degrees up from the 349 (3490) October 2022 low. Remember that 610 i(6100) is 3 revs of 360 down from the 610 peak.
The last few weeks of the advance were negated in a couple of hours.
Because the drop was produced from the 6100 high which satisfied a square-out from the 349 (3490) October 2022 low, the likelihood that the last weeks decline was the harbinger of more selling.
It looks like the August Air Pocket was the first mouse getting the squeeze but downside follow thru will see the second mouse get the bear cheese.
Above we mentioned several B waves that have played including the 2007 top, and the 2020 top.
We cannot rule out the idea of a B wave that makes a new all time high marginally above 6000 this week.
New high or not, my expectation is the market will reverse dramatically when this move burns out without giving a graceful exit.