“There is never anything new on Wall Street, because speculation is as old as the hills.” Jesse Livermore
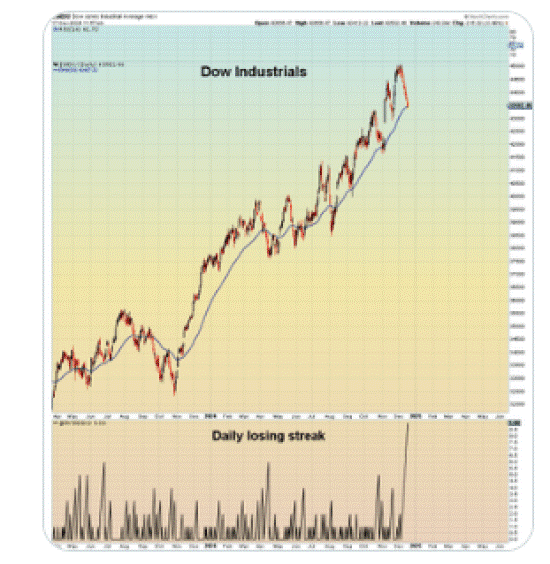
The DJIA topped on December 4th losing 1,296 points on this drop to its 50 day line on Tuesday.
The industrials have suffered the longest losing streak (9 sessions) since 1978.
The SPX topped near our 609 (6090) square-out region on December 6th dropping to its 20 day moving average for the first time since November 20th.
The SPX is threatening to drop below the early November highs of 6017.
A weekly SPX reflects the situation.
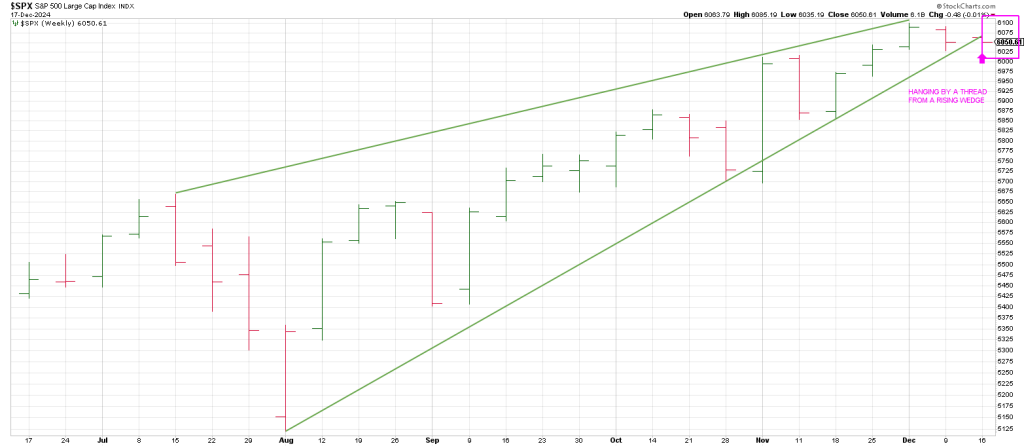
The SPX exploded the week of November 4th following the election.
The index has been digesting (or distributing) that weeks momentum.
Breakage below the early November peak of 6012 with downside follow through warrants caution.
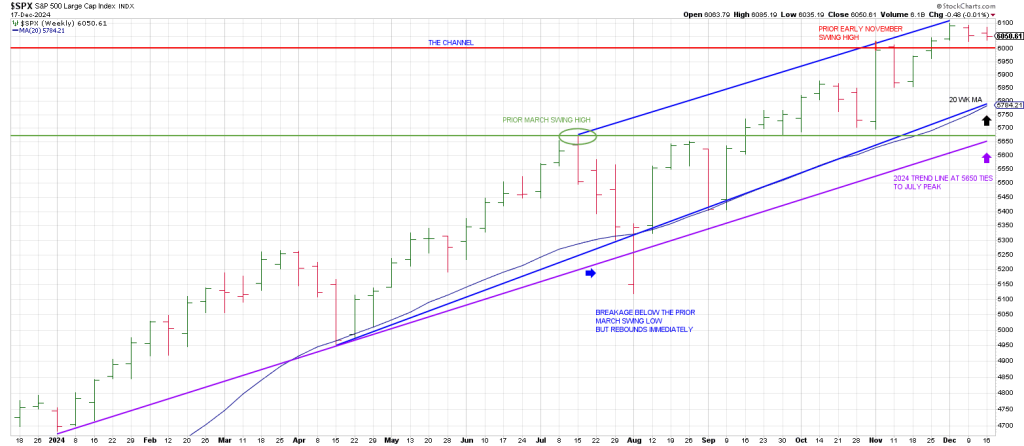
Pulling back the lens shows the SPX dropped below a prior swing high, the March high, in early August; however, it immediately bungeed back above that March peak.
It’s as if that August Flash Crash knew exactly what it had to do to flush out longs creating Blue Sky for the sub sequent 4 month ramp.
If we should knife below the early November high, it will be critical to observe the price action.
because the Principle of Alternation suggests that if the November high is violated with downside follow through, that this time the break will be the real deal…unlike August which was a flush-out.
I connected the important July high with the early November high and it gives the early Dec record high for a 3 point trend line.
I then paralleled a line off the April low. The August low undercut the trendline but CLOSED above it.
The bottom rail of the trend channel catches the early September lows.
The bottom of the channel currently resides around 5700 which ties to the 20 week moving average.
This level will be important should the index get indigestion over the coming month.
Each time the SPX has turned its dailies up since the December 4th high has defined a pivot high.
That’s bearish short-term action but we haven’t broken anything yet.
But the 20 day moving average could break today. It’s an FOMC Cha Cha Day.
With 90 degrees down from high at 6022 near the 20 day moving average (6029) that’s the downside pivot.
That said, breakage below opens the door to 180 degrees down which is 5945.
Is a 100 point drop possible for OpEx Pinball?
The market has bullied Powell into a rate cut. Powell likely doesn’t want to ‘disappoint’ expectations but it may be a hawkish cut.
Momentum below the 20 day moving average could surprise those betting on a Santa Rally with a snow ball to the 50 day line which ties to the aforesaid 5945 region.
Remember a failure below the early November 6011 high is bearish because prior resistance should act as new support.
To recap, the August Air Pocket did knife below the prior March swing high but it was quickly recovered.
Consequently IF we falter below the early November high we want to be on the watch for an Undercut & Rally of for genuine downside momentum.
What are the odds for downside in this normally positive seasonality?
- Big Tech got a Rug Pull on Turnaround Tech Tuesday.
For example MRV cratered after scoring record highs the last two days. It’s sitting on Phil D Gap.
TEAM came apart at the seams dropping to its 20 dma for the first time since it exploded from a kiss of the 20 in late October on earnings. That was a great play for Hit and Run.
Theoretically the 20 day should act as support here, but if not TEAM will be in the penalty box.
CRDO another momentum name left a Soup Nazi sell setup.
RDDT backed off shedding 10 following a record close on Monday.
To mention a few. - Monday the stock market generated a Hindenburg Omen potential crash signal over coming months. This is the third on the clock simultaneously.
- Long-term interest rates continue to spike. This could be a contributing factor for a market downdraft.
- Monday marked a rare unprecedented event in market behavior: the NYSE McClellan oscillator (NYMO) plunged over 99 points from the prior months close through Dec 16, even as the SPX advanced +41.70 for the same period.
This unusual contradiction—an advancing SPX alongside a near 100 point MYMO drop in any half-month has NEVER OCCURRED BEFORE.
The dramatic collapse in NYMO, despite SPX gains, underscores a critical message about the markets internal health. While the index rose, most of its 500 components declined.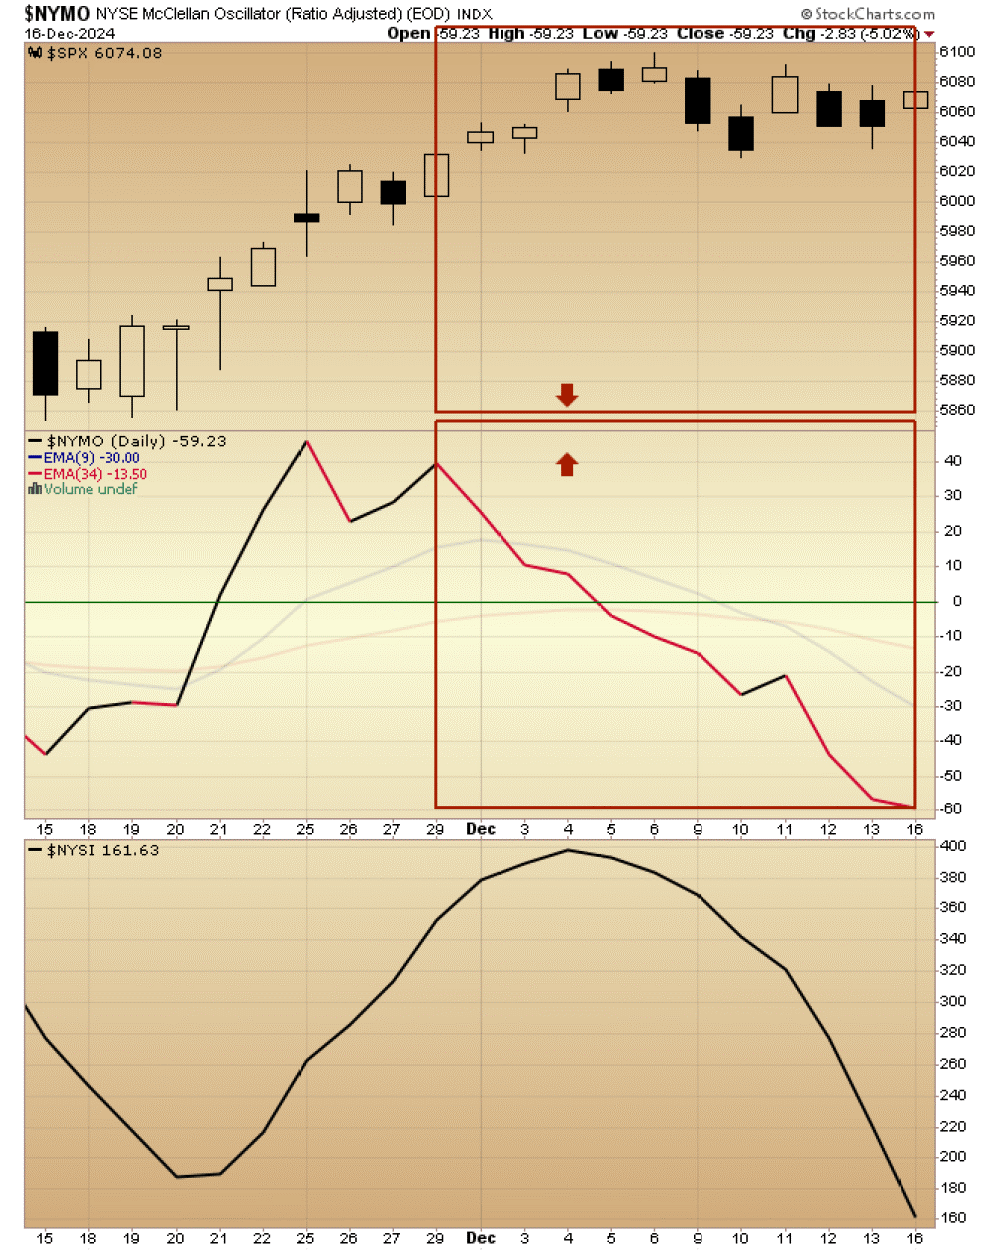
Succinctly, this widening divergence reflects ongoing internal weakness signal the chickens will come home to roost.
Pick your poison today: Doves, Hawks or Chickens.
Tomorrows report will further explore the synergy between 1929, 2000 and the current time period.
Suffice to say the records we are seeing such as the rally in the SPX in December in tandem with a plunging NYMO, the deepest decline ever during a continuous SPX advance and the nine consecutive decliners on the daily DJIA are hallmarks of significant turning points.
This cycle appears to be of a much larger order than short-term, intermediate or even primary cycles.
Today’s FOMC report at 2 P.M. ET is likely to amplify market volatility more than usual.