“The most money is made at the end of moves.” W.D. Gann
Big money can be made when a trend is nearing completion with the most dramatic price fluctuations occurring during the final stages of the trend.
Unfortunately many market participants interpret the dramatic gains in price as a sign of strength versus a crescendo.
These ‘end of moves’ refer to blow offs, the culmination of cycles. They can be very rewarding to play, but very alluring as to overstaying your welcome.
Monday was a big day for Hit and Run members:
We captured 20 point + gainers in TSLA and APP.
Let’s take a look at the setups that telegraphed these explosive gains.
APP turned its 3 Day Chart down last Wednesday, Dec 11 for only the second time since it exploded from its August 5th low of 60.67.
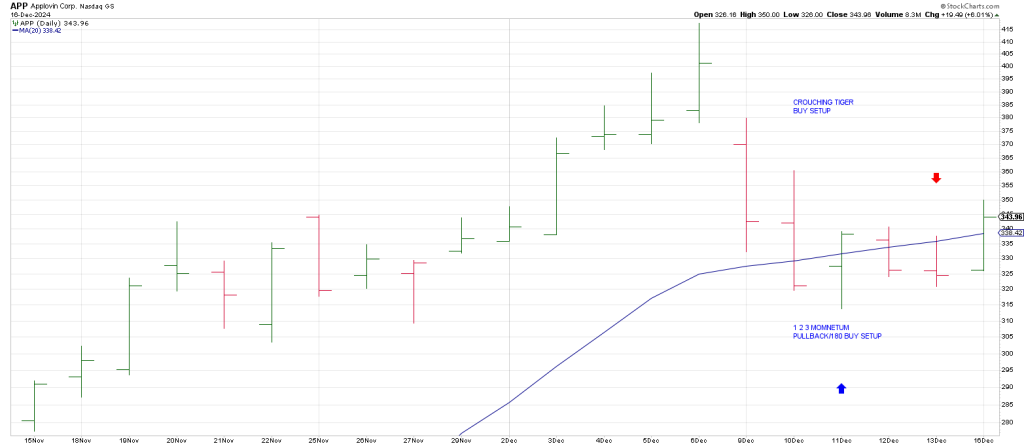
The first turndown in its 3 Day Chart occurred on Nov 4h at 158.33 just before APP exploded to
417 on Dec 6.
The 3 Day Chart is a key tool in the Hit and Run arsenal.
From 158 APP rocketed to 417 in a month.
Amazing.
APP actually left a Combo buy signal last Wednesday: a 1 2 3 Momentum Pullback and a 180 buy signal.
A 180 is simply a close at/near session highs when the previous session saw a close at/near session lows…when the stock is in an uptrend as defined by being above its 20 and 50 day moving averages.
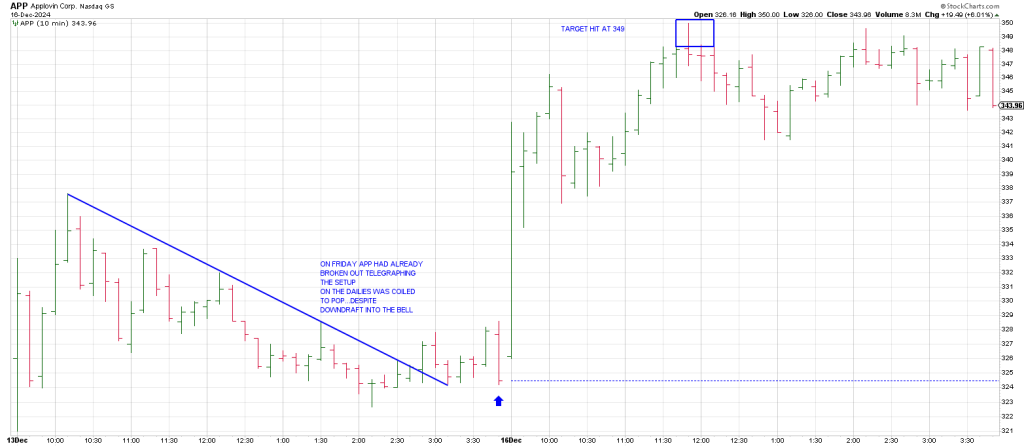
Hit and Run didn’t explode immediately. It stutter-stepped for 2 days before exploding on Monday.
Hit and Run initiated a long swing on Friday in anticipation based on a strategy I developed called a Crouching Tiger. It is basically a double down inside pattern showing the item is coiled.
As well drilling down to a 10 min shows an Angular Rule of 4 Breakout on Friday—a Brreakout over a 3 point trend line.
Last week we flagged a projection in TSLA to 474 courtesy of the Square of 9 Time/Price Calculator.
Place picture of Sq of 9 here
Monday’s gap up suggested 474 was on deck.
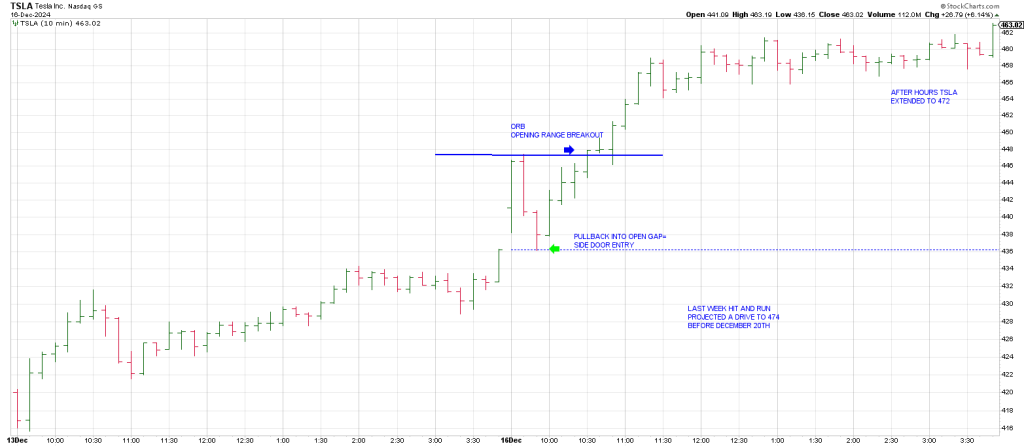
A 10 min TSLA shows Monday’s up-gap followed by a Side Door Entry into Phil D Gap.
An up ORB or Opening Range Breakout got us on board as the train left the station for the 474 destination.
TSLA extended after hours and this morning is trading at 478.
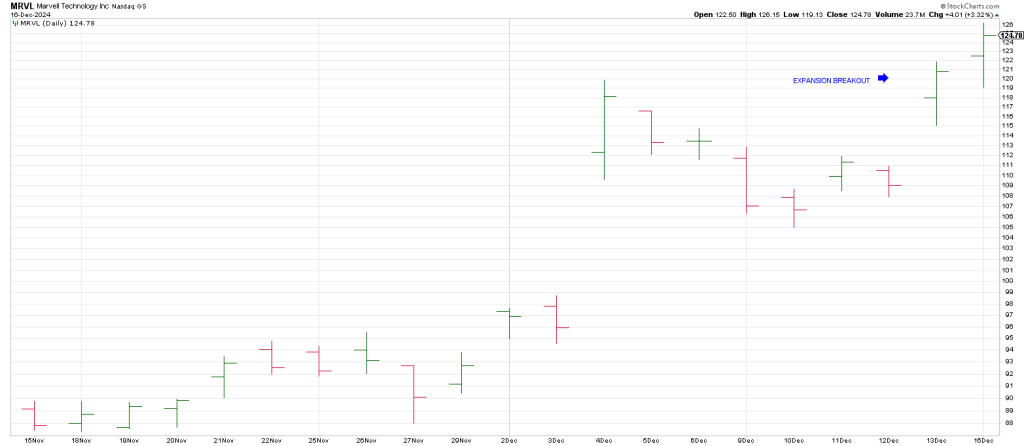
MRVL was a long idea for Monday based on its Expansion Breakout/Breakaway Gap on Friday: it was ripe for an immediate extension.
A 10 min MRVL shows the gap open followed by a snapback for a Side Door Entry as overnight hot money captured the carry over trade from Friday.
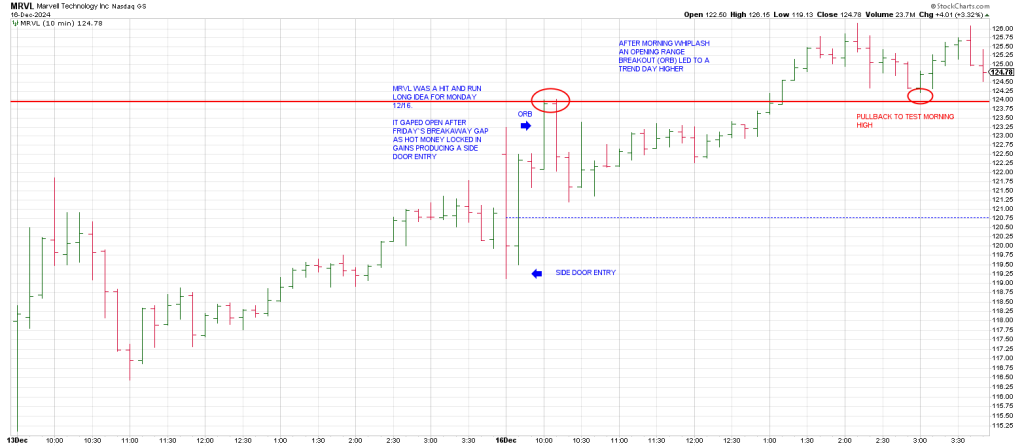
An upside ORB did a good job of identifying a trend day to the topside following the typical morning Whiplash.
Notice the late day test of the Opening Range Breakout.
FSLR has been in a persistent downtrend (again) since its late September counter trend rally pivot high.
Last Thursday it broke a short-tern Bear Flag.
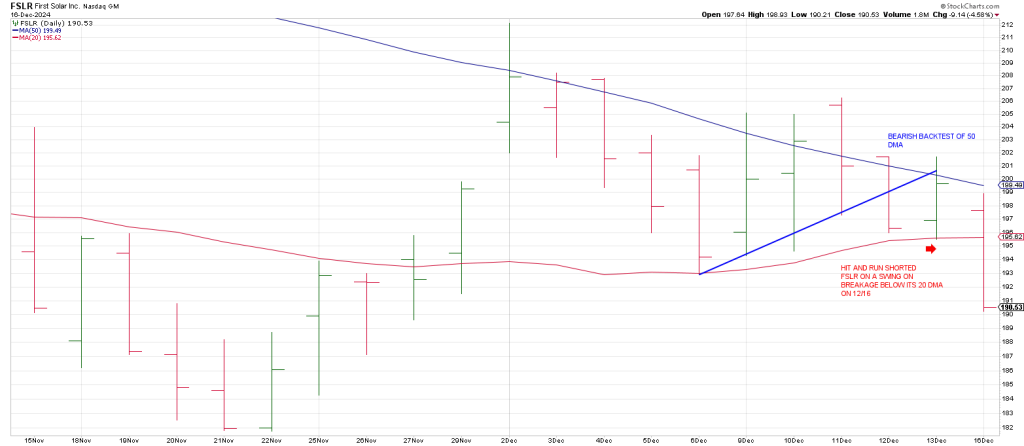
Friday it backtested the Breakdown Pivot and its 50 day ma.
Friday it succumbed failing below its 20 day moving average.
Hit and Run members shorted it mid-day.
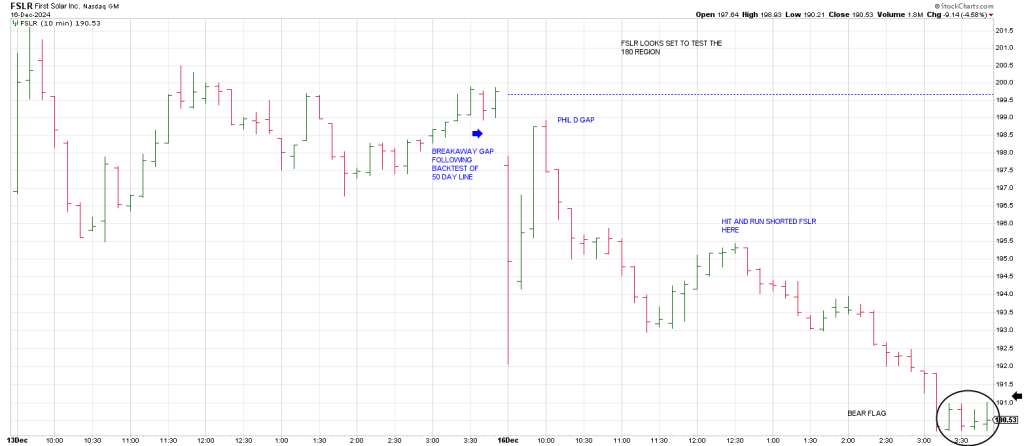
A 10 min FSLR shows the blow by blow leaving a little Bear Flag for a downside extension today.
In sum, these strategies are the same ones from the Hit and Run books I wrote in the late ‘90’s.
They worked then just as they do now.
“The markets are the same now as they were five to ten years ago because they keep changing—just like they did then.” Ed Seykota.
Market dynamics, while constantly fluctuating, tend to repeat patterns over time, meaning trading strategies that worked in the past can be very effective in the present.