“I seem to lean on old familiar ways.” Still Crazy After All These Years, Paul Simon
January 11, 1973 was the top of a 40 year bull market that began following the July 8, 1932 low.
After that peak, the a bear market took with the DJIA losing approximately 50%
The DJIA bottomed on December 9th, 1974, a double bottom with the October 4th 1974 low.
December 1974 was 50 years ago.
That’s an important periodicity as it was 50 years from the major 1932 low to the major 1982 low.
We have a low to low 50 Year Cycle from 1932 to 1982 and a 50 Year low to not a low in 2024.
It remains to be seen if 2024 is a high.
But early December is the anniversary of the 1974 low and we know we have a potential square-out on December 7th (plus or minus).
To recap December 7th is opposite 666/667, the bear market low in 2009.
It follows that the high would rhyme with the low.
As well, 666/667 squares out with March 6, the low in 2009.
616 or 6160 is on the same axis as 666/667.
Additionally all these dates and prices square early September.
We’ve been talking about a possible 95 year cycle from 1929 and of course early September was the high in 1929.
In other words, the top prior to the Great Depression in 1929 is opposite the low of the Great Recession on March 6, 2009.
Is it possible the SPX spikes to 6160 here in December?
Of course it’s possible?
Is it probable?
With the kind of Earnings Lollapalooza we saw after Tuesday’s close I’d say the odds are good.
CRM + 34 after reporting
MRVL + 10 after results
OKTA +13 post-earnings
CRDO + 22 after earnings on Monday
DOUL and RDDT didn’t need no stinkin’ earnings to rip…+ 15 and + 9 points respectively.
As well the SPX left a Combo buy setup on Tuesday.
It left a second NR 7 Day (the Narrowest Range in 7 Days).
As well the SPX turned its dailies down on Tuesday before rally to close at session highs.
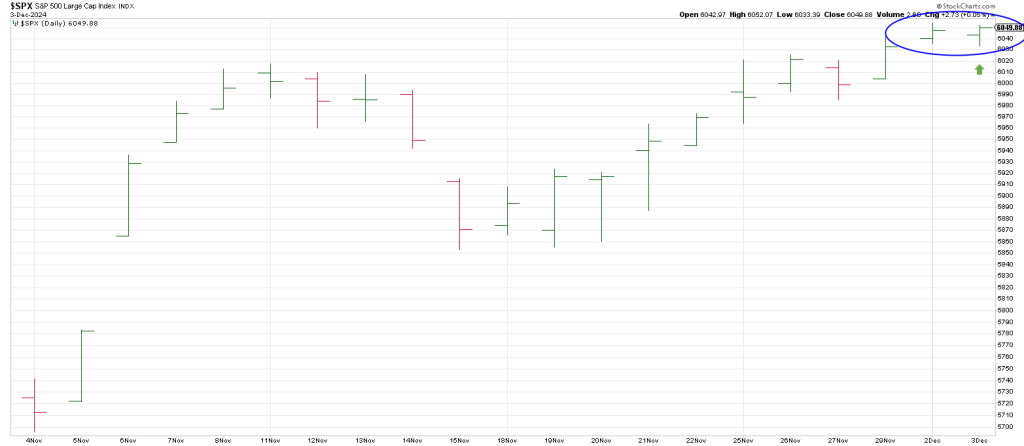
The double NR 7 Days is a volatility coil signal. In other words, it suggests an expansion of volatility.
The first turn down in the dailies from a swing high that is a TD or 1st Turn Down buy setup.
If a cherry on top spike to this banana boat is ever going to play out now is the time.
Early December is another important anniversary. December 4th is the closing low after the crash in 1987.
As noted yesterday December 26th is the 6 year anniversary of the crash low in 2018.
Late December 2021 was the DJIA closing high prior to the 2022 bear.
The market exploded to the topside in December 2012.
The DJIA topped in early January 2000.
A 5 year melt-up started in December 1994.
Aside from the ‘interruption’ in 2022, the market has been advancing for 5 years.
5 years is an important period in markets.
It is 90 degrees of the key 20 year cycle.
Think 1932 rally to 1937 and 2002 to 2007 advance and the aforementioned 5 year advance from late 1994 into early January 2000 in the DJIA.
Perhaps most important is the square-out this week with the two other P/E overvaluation spikes in 1929 and 2000.
It was 71 years from 1929 to 2000.
It is 24 years from 2000 to 2024.
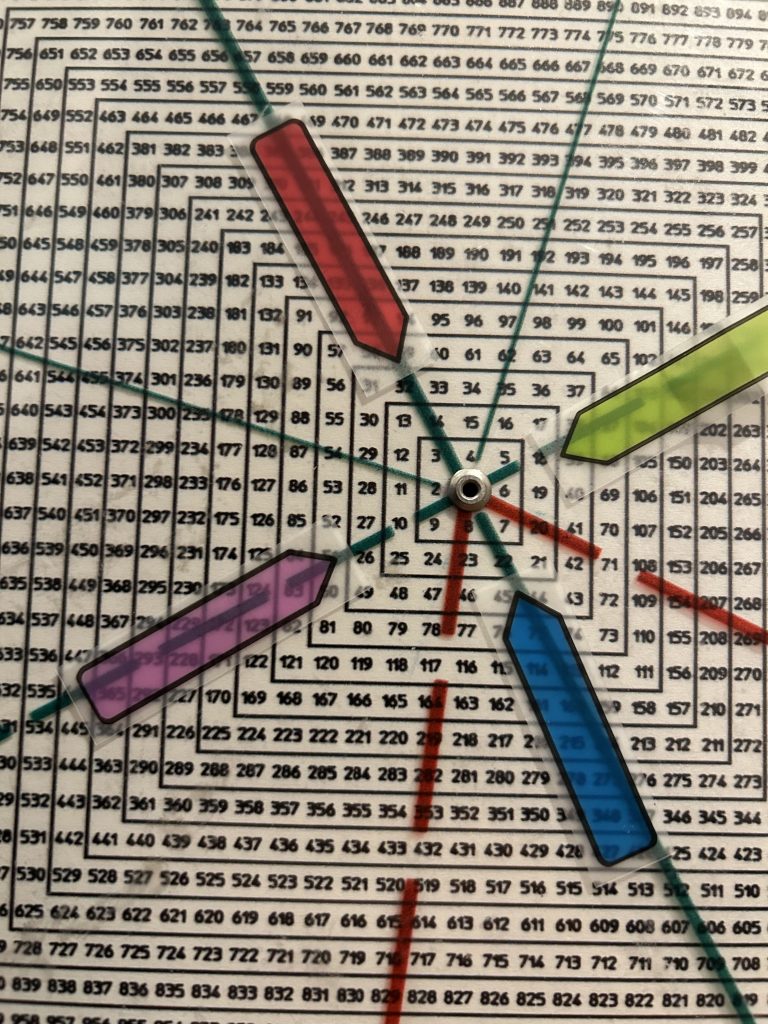
71 squares 24 on my Square of 9 Wheel.
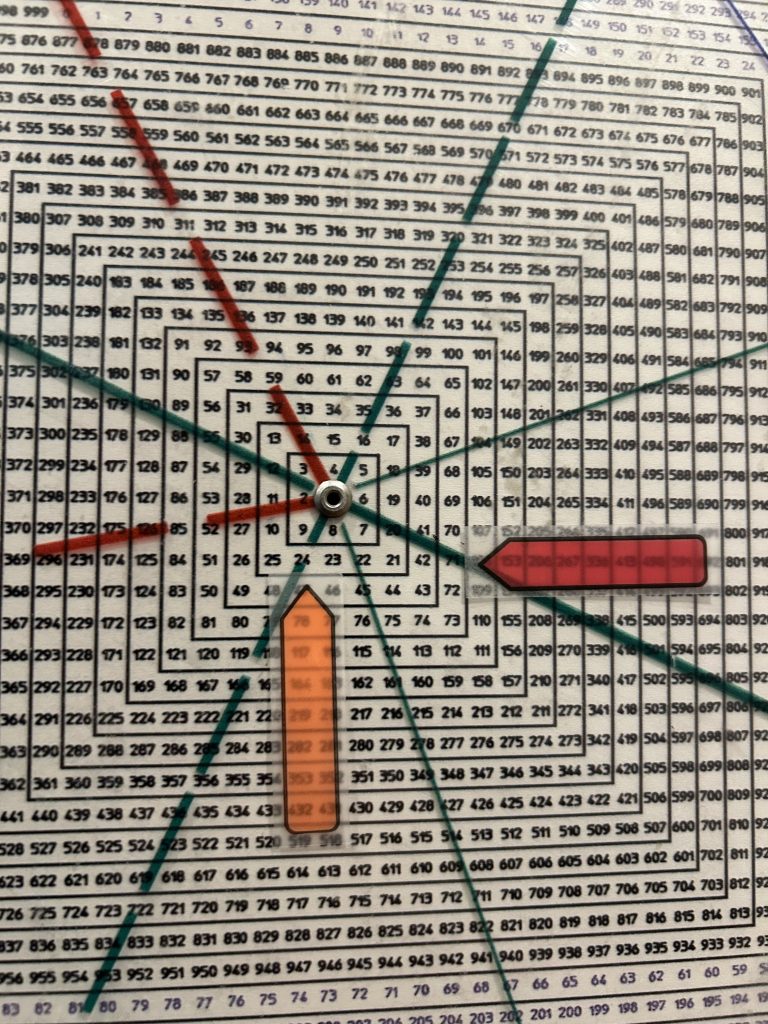
Place image A here
Is the Sq of 9 voodoo?
I don’t care what it is as long as it prints money.
Combined with pattern recognition, the Square of 9 is the most powerful Combo setup I’ve ever seen.
Let’s look at an example, NBIS.
Hit and Run played NBIS long a few times after it went public in October.
We reloaded last week at 22 and 21.
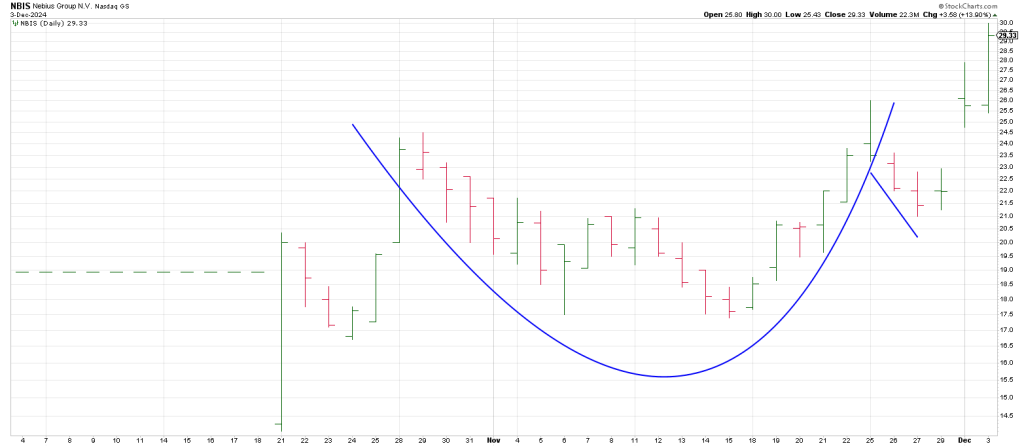
Notice that NBIS gaped out of a Cup and Handle pattern on Monday.
The Handle was our Plus One/Minus Two buy pattern: the 3 Day Chart was pointing up followed by two consecutive lower lows.
On Monday on the Hit and Run Private Twitter Feed we tweeted that clearing 26 opened the door to 32.
Why?
From the 14 low, 90 degrees up is 18.
180 degrees up is 22.
270 degrees up is 26.
A full 360 degree move equals 32.
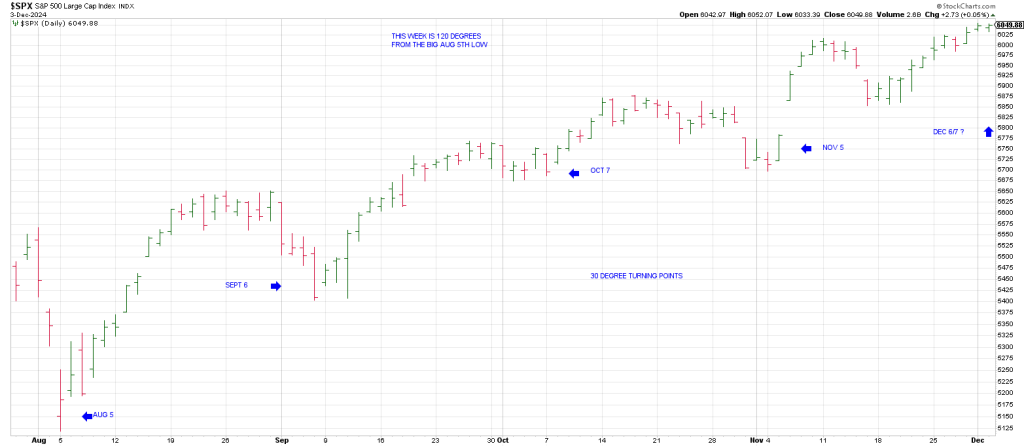
In sum this week is 120 days/degrees from the important August 5th low.
Every 30 degrees since that Flash Crash low has seen a turning point.