“I was crowned with a spike right through my head.” Jumpin’ Jack Flash, The Rolling Stones
There is a flash-point that hits in early December.
83 years ago on 12/07/1941 Pearl Harbor was attacked.
Apparently exactly 83 years later there are an amazing number of planetary returns that vibrate off the Pearl Harbor chart.
We have discussed the cycles of war in this space before that tie to the late 1700’s, the mid- 1800’s and the 1940’s that are due to exert their influence over the balance of this decade.
What is interesting is that 83 is opposition 1945 which is when the Hiroshima and Nagasaki nuclear bombs were dropped.
What’s interesting about December 7th is that it’s what I call a Master Square for the U.S.
In addition to it being the U.S. entry to WW2, it is opposite June 6th, D-Day which was the beginning of the end of WW2.
It is square the first week of September, which was the start of WW2 in 1939. (by the way on the 10 year anniversary of the top in 1929).
It is square March 6th which is the Articles of Confederation, the forerunner to the Constitution.
Of course March 6th is also the major low in 2009.
December 6th, 2024 is a Friday. Mars goes retrograde that day.
Mars is often a trigger. Think of it like the second hand for the hour and minute hand of a ‘timer’.
My expectation is a lot of “energy” can be released on Monday December, 9th.
12-09-24
That reduces to
3-9-6
Of course the low in 2009 was 3-6-9.
“If you only knew the magnificence of the 3, 6 and 9 , then you would have the key to the universe.” Nicolas Tesla
Tesla’s belief was that these numbers held a special significance and potential power related to the fundamental energies of the universe, often interpreted as reference to specific frequencies or vibrational patterns.
Most likely we will be buying puts on December 5th/6th.
WW1 started on July 28th, 1914.
Interestingly July 28th squares the aforementioned ‘83’ and points to October 28th, which was the biggest crash day in 1929. A lot of energy was released.
Emotions should run high in December in league with the potential for panic.
1929 was 95 years ago,.
How does 95 relate to 2024?
The Metonic Cycle is a period of 19 years in which the Moon’s phases recur on the same days of the solar year.
The Metonic Cycle is the Moon’s 19 year cycle where the Moon returns to exactly the same place in the sky. It synchronizes the lunar phases with the solar year.
In sum, it means that the moon and the sun are in roughly the same place in the sky as they were 19 years earlier.
The Metonic Cycle is made up of 235 lunations or synodic months which is 6,939 days.
6-9-3
The point is that 5 Waves of 19 years is 95 years.
We are 95 years from 1929.
The expectation is that any top will be a very big top.
Will December be a Santa Claus Rally or a sleigh ride from hell?
Have markets ever crashed in December?
In the first week of December 2018 the Christmas Crash started.
That was 6 years ago this December which is a cube-out in time. (a cube has 6 sides squaring the circle…360 X 6).
In 1914 after the start of WW1 in July the NYSE closed …until December when it reopened down 25%.
Is there a setup here for a plunge?
Yesterday the SPX struck a new high and NYSE breadth was -831.
Since the inception of the S&P 500 in 1957, there have been 47 days where the index closed at a new record high while the NYSE recorded net declines (more declining issues than advancing issues) at the close.
This phenomenon typically indicates underlying weakness in market breadth, as fewer stocks are ;participating in the rally. Such occurrences are often viewed as potential warning signs of market exhaustion or approaching corrections, as they suggest that gains are being driven by a smaller group of stocks rather than broad-based strength.
The NYSE’s most negative breadth occurred on July 19th, 1999, the day the SPX closed at a record high.
That day there were 1,129 net declining issues.
This occurred during the late stages of the Dot.Com Bubble, a period characterized by extreme market divergences. Similar to 1987, this negative breadth reflected a narrowing of leadership, with gains concentrated in a small group of high-profile stocks while the broader market struggled.
From July 1999 the SPX corrected THREE MONTHS. The SPX turned its 3 Month Chart down right off an all-time high.
From the October 1999 low the SPX advanced to a new high into DECEMBER 1999.
From there a Monthly Plus One/Minus Two buy setup played out with the SPX tracing out 2 consecutive lower monthly lows into February 2000.
But December 1999 was the Primary High.
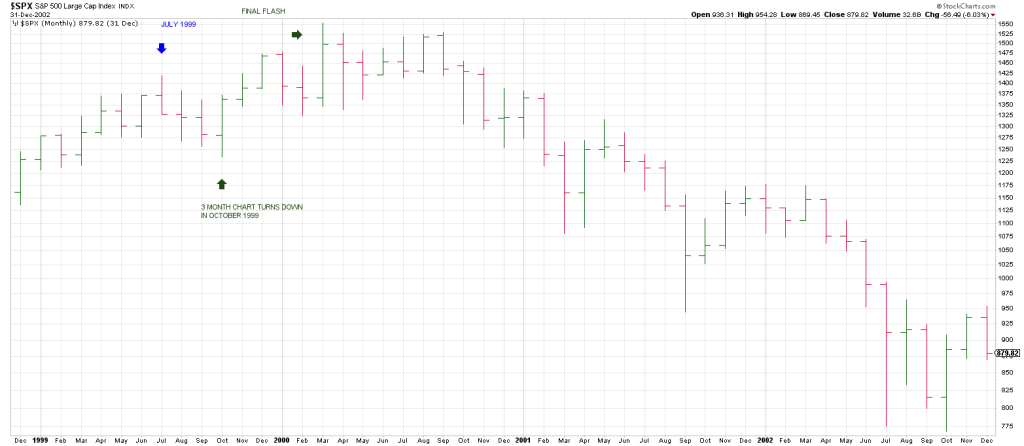
In other words the 3 Month Chart was up followed by 2 consecutive monthly lower lows.
That monthly buy setup perpetuated the final fling higher into March 2000.
The point is the market was flashing warnings since July 1999.
It took 6t to 9 months for the Primary and Secondary (March 2000) Tops to play out.
We are 4 months from the July 2024 high and counting.
In sum, the market can continue to hold up in a non-linear fashion…in other words without a melt-up, with, at any time, one final fling ala March 2000 leaving party-goers thinking it was the beginning of something, not the end.