“It would be silly to expect every bear market to turn into the Great Depression. It would be equally wrong to expect that a fall from overvalued, to more fairly valued, couldn’t badly overshoot on the downside.” Seth Klarman
“I’m not afraid of you running away, honey
I get the feeling you won’t.” Breakdown, Tom Petty
“The rally from the August 5th SPX low shows a clear 5 waves up to the 6017 high and 6001 close on Monday to the top of a trend channel.
While 609 (6100) perfects 4 price cycles of 360 degrees up from the 340 October 2023 low, it is worth noting that Monday’s high represents a Time/Price square-out:
November 11 squares-out with 6000”
The above is from Thursday morning’s Hit and Run report, Disconnect.
In Wednesday morning’s report, The Pullback, Hit and Run reiterated the path lower:
“ …a C wave or Zig Zag decline could satisfy 5940.”
Since Monday’s high we’ve stated our expectation that negative breath and unsustainable price action in some high flyers indicated the next move was to a minimum of 5940 with breakage below that level opening the door to 5863.
Why?
5940 is 90 degrees down from high.5863 is 180 degrees down from high.
Thursday night as I write, futures are gapping thru 5940.
The market is ordered and geometric in nature. Otherwise, these price harmonics wouldn’t persistently play out.
The last low on the SPX was 5696 on November 4th.
In fact we made a call for a drop to the low 5700’s to play out from the mid-October low before a Trump Spike to over 6000.
The low 5700’s is 180 degrees down from the Oct 17th 5876 peak.
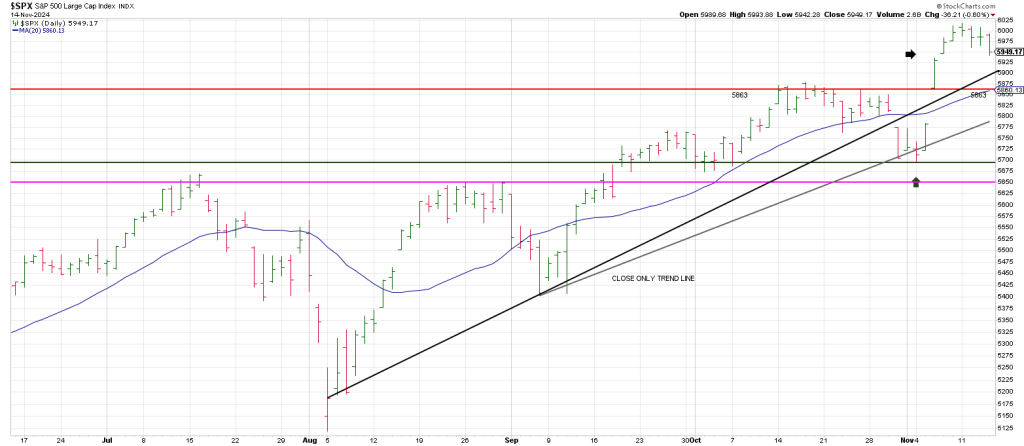
If the SPX follows through with overnight weakness it increases the odds of a drop to 5863 offered above.
5863 ties to the October highs and is currently where the 20 day moving average resides.
Offsetting Phil D Gap from November 7th at 5929 further increases the downside probabilities of a drop to the October highs.
Below the October highs 5860-70 is a red flag.
Below the October lows in the low 5700’s is a blaring siren.
Below the summer Twin Peaks (5660-70) is a Get Out of Dodge Sell Signal.
Let’s look at one stunning example of geometry in the markets that Hit and Run members had on their radar before the fact.
After reporting earnings on Thursday, CAVA exploded from 145 to an open of 168.
It pushed a tad higher to 172 before puking. It closed at 147.
But the give-up wasn’t over, CAVA plunged to 138 on Thursday.

Anybody can bet big on earning’s in this tape, but the truth of the tape is knowing when to ring the cash register.
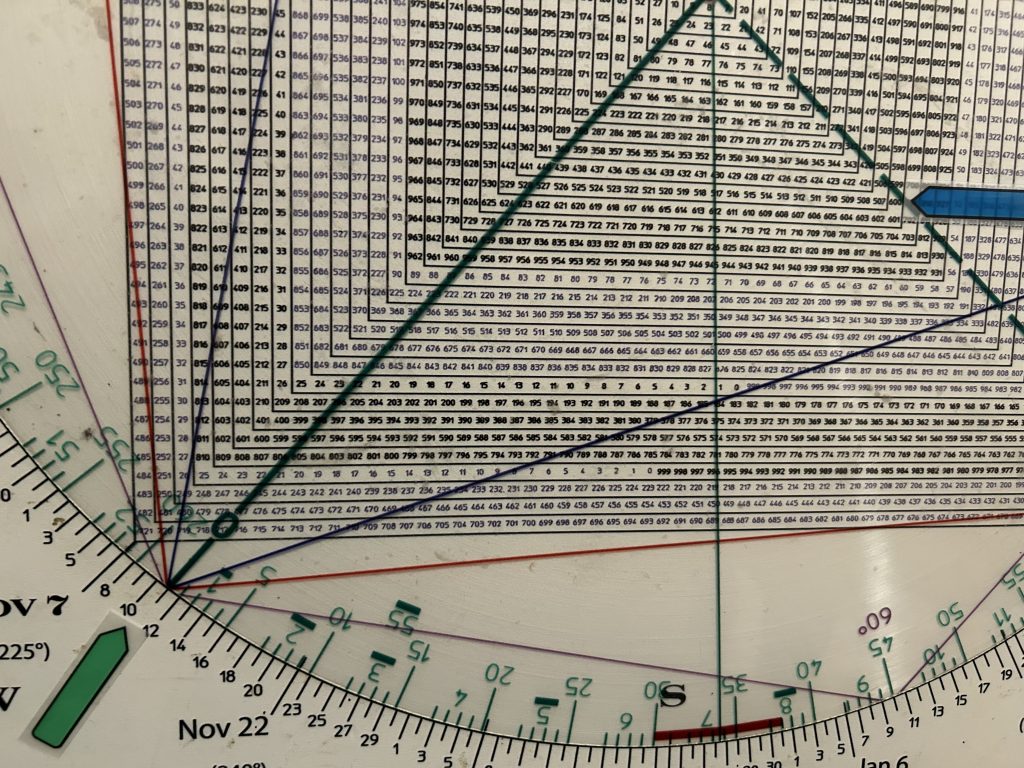
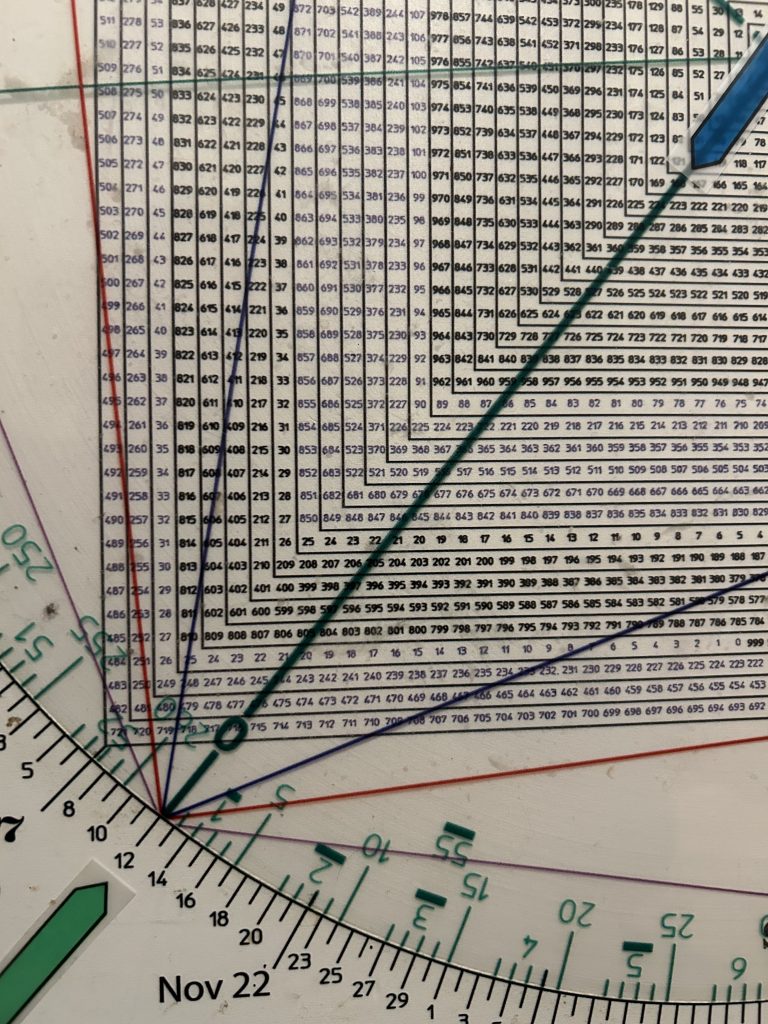
That is the undeniable power of the Square of 9 Wheel.
168 squares-out with November 12th.
Market participants who cite chapter and verse about “buy and hold” like Hare Krishna’s in a conga line on the floor of the NYSE, are more muted one would expect after one of their golden idol “never sell” stocks like CAVA take it in the shorts the last two days.
We have an Earnings Reversal strategy. Earning’s Oops.
When a stock explodes to a potential Time/Price square-out, such as CAVA, then when it triggers a down ORB, an Opening Range Break (first 30 minute range), then it can be shorted.
Notice that CAVA triggered an Earning’s Oops on Thursday at 158.10.
The normal expectation is for a knee-jerk bounce on the first pullback following a rocket.
A 10 minute CAVA shows a short-term rebound to 163.
When the ORB was triggered the second time, CAVA started the skid to 136.
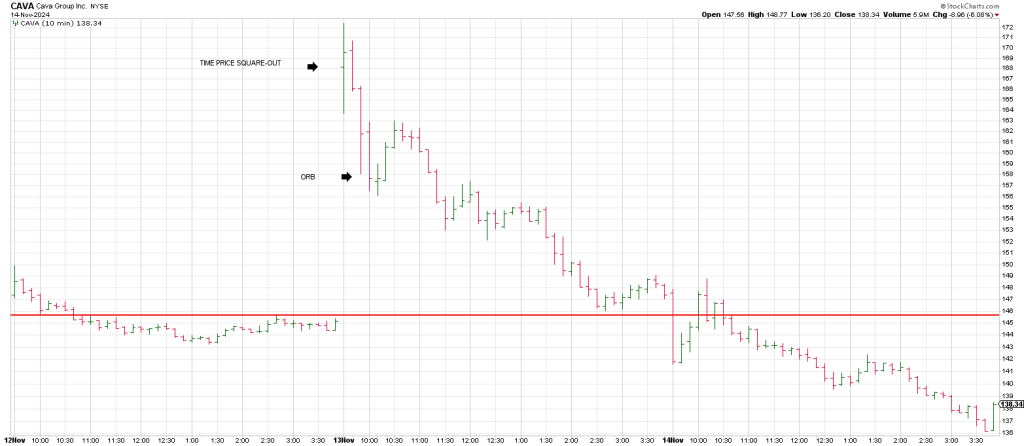
The second mouse got the cheese.
In sum, 360 degrees down from high is 5711.
This ties to the early November low.
Said another way, the SPX exploded 360 degrees to the topside in 5 days.
The market is respecting that 360 degree advance and pulling back.
However, a breakdown of the entire rally from early November enhances the probabilities that a Buying Climax has played out.
Breaking down below the massive November 6th gap triggers a Jump The Creek sell underscoring that probability.
Let’s check out GDXJ which has had a steep drop every since our square-out on GLD at the 255 region.
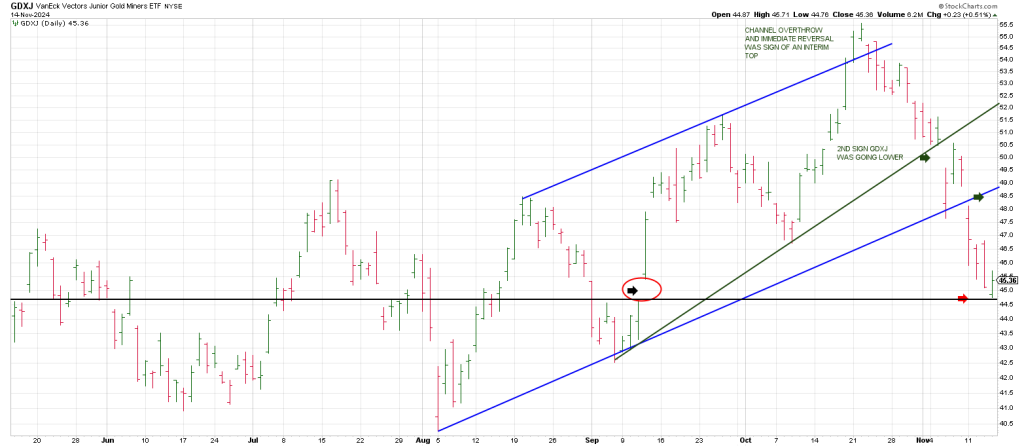
I connected the early August and early September lows. I then paralleled a line from the August peak thru the late September peak.
It shows two things:
- The push above and then immediate back below the top of the channel in mid-October warned of a Throw-Over Top.
- The gap below the bottom of the channel opened the door to sharply lower prices.
A Rule of 4 Sell signal (green trend line) preceded breakage below the bottom of the channel.
This is why we sold out and have been staying away from the metals…until now.
Now, GDXJ has satisfied the Breakaway Gap from September 12.
It left a little Gilligan Buy signal on Thursday—a gap to a new 60 day low with a close at/near session highs.
Clearly GDXJ has its work cut out. It needs to recapture the bottom of the channel at the 48.50 region.
If it can do so it opens the door to 52.
However a drive to 52 might bring out the gold bears they might be dreaming of a right shoulder at that juncture.
And they could be right. However, if GDXJ follows thru to the low 50 region and pulls back and then knifes thru 52, its going to see smoke the shorts.