“For red is the color that will make me blue
In spite of you, it’s true
Yes it is. It’s true
Yes it is”, The Beatles, Yes It Is
Many argue that a top or bottom is not made clear until after the opposing move has already begun. I disagree. While we can never know for sure whether a market has found a top or bottom until after the opposing move has begun, we can determine the probability of such a move through the use of technical patterns and signals. Whether we like it or not we’re all in the pattern recognition business; learning to use price action is essential to your success as a trader, regardless of the trading strategy you use.
My entire Hit and Run Methodology revolves around pattern recognition.
One of the most powerful patterns identifying tops is a Low to High to High pattern or a Low to Low to High pattern.
The SPX shows a monthly Low to High to High pattern. However, instead of using linear time, I’m using Fibonacci time progression.
The SPX shows a Fibonacci 21 month advance from the Covid Crash bottom to the January 2022 high.
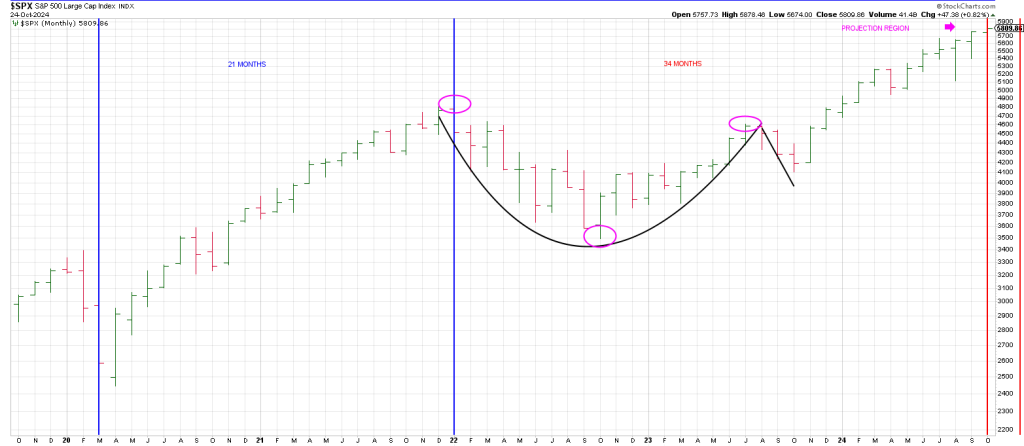
From the late Dec 2021/early Jan 2022 top a 34 month Fibonacci time period equates to October 2024.
October is set to carve out the narrowest range month since the advance from October 2023 started.
Contractions in range are typically followed by expansions in volatility in the opposite direction of the trend.
The SPX has been in a Runaway Move since it came out of a Cup and Handle pattern; each pullback on the monthlies has seen only one month below a prior months low. The presumption is that since the index has only inhaled (pulled back) twice on the monthly time frame that the next change in trend will last more than one month.
Measuring from the Cup and Handle gives a projection of around 5724.
I took the October 2022 low, the bottom of the Cup to the right side of the Cup which is 1117 points.
Adding 1117 to the July 2023 high (right side of the Cup) gives 5724.
Measuring from the left side of the Cup at 4808 (January 2022 top) to the bottom of the Cup is 1317 points. Adding 1317 to the July 2023 right side of the Cup produces a projection of 5924.
The SPX struck a high last week of 5876, the high end of the projection window.
Time and Price may produce a major high in October 2024/early 2025.
Big tops take time to play out. They also often see a false breakout before the reversal.
Such was the case in January 1973 with a false breakout before a vicious 2 year bear market.
It took a decade for the market to produce an uptrend.
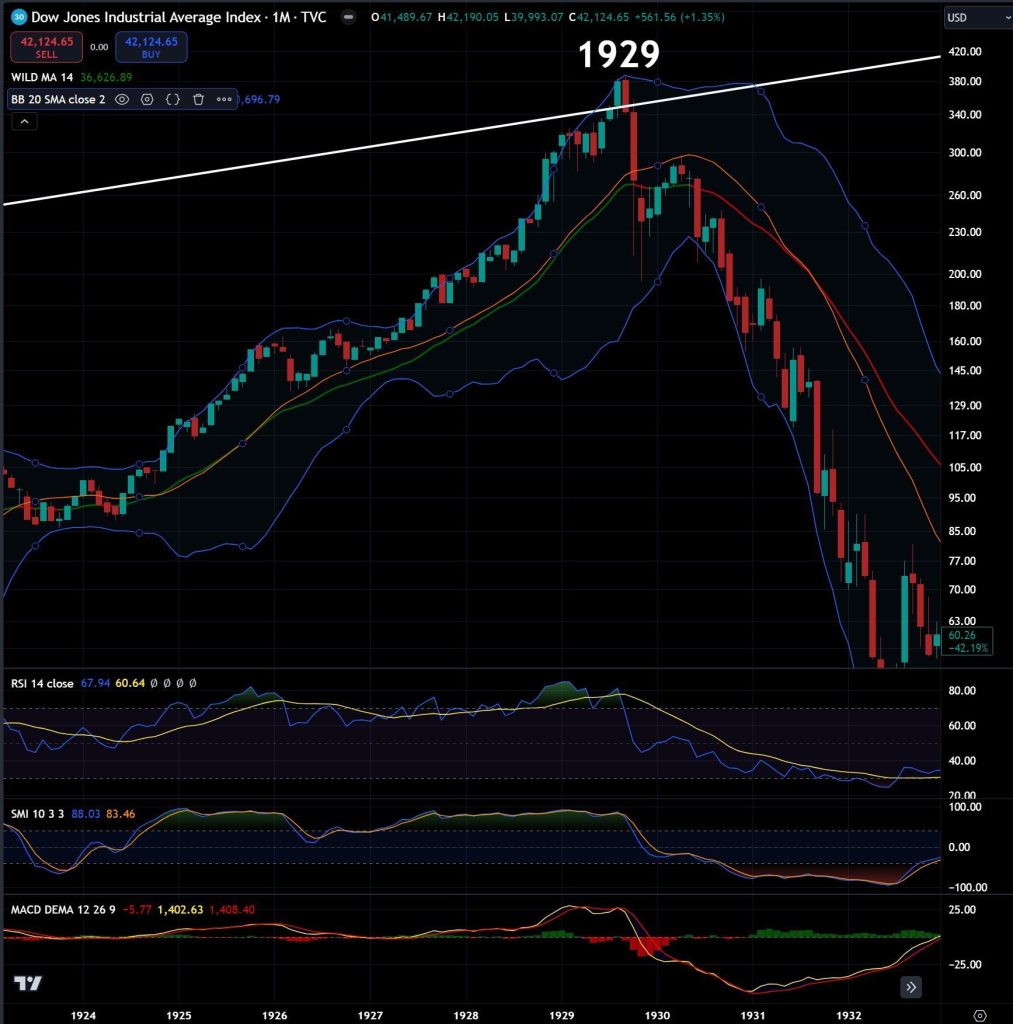
In 1929 the DJIA broke above a major trend line for two months before turning.
It took 25 years for that top to be eclipsed.
Currently the SPX shows a two month run above the July 2024 top which preceded sharp reaction.
Is it possible that the SPX saw a Primary High in July followed by a Secondary Top this fall?
That’s the big picture.
Hit and Run makes money using short term patterns.
We use price patterns. And we ise time patterns that revolve around my Swing Method: the Plus One/Minus Two buy setup and the Minus One/Plus Two sell setup—on the daily, weekly and monthly time frames.
Below are a couple of Hit and Run patterns that have played out this week.
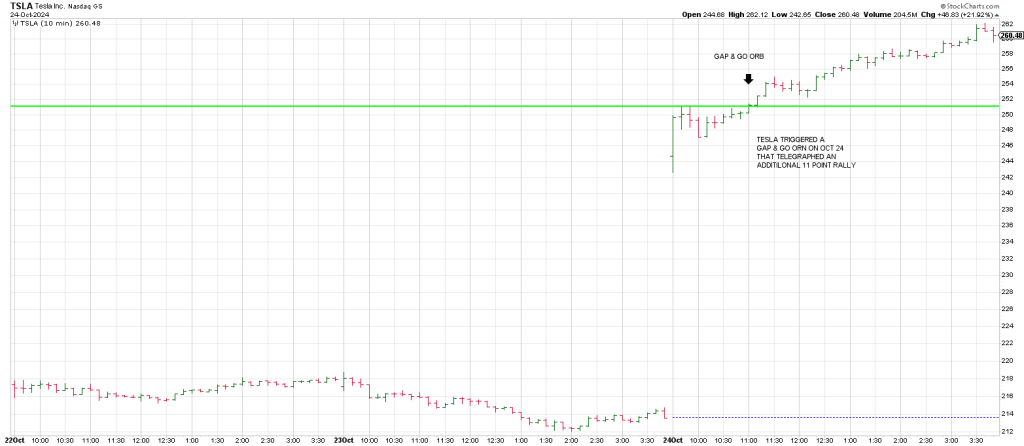
There was no buy setup in TSLA before it exploded yesterday.
However TSLA triggered a Gap and Go ORB (Opening Range Breakout—a move above the first half hour high) which generated 11 points of gain.
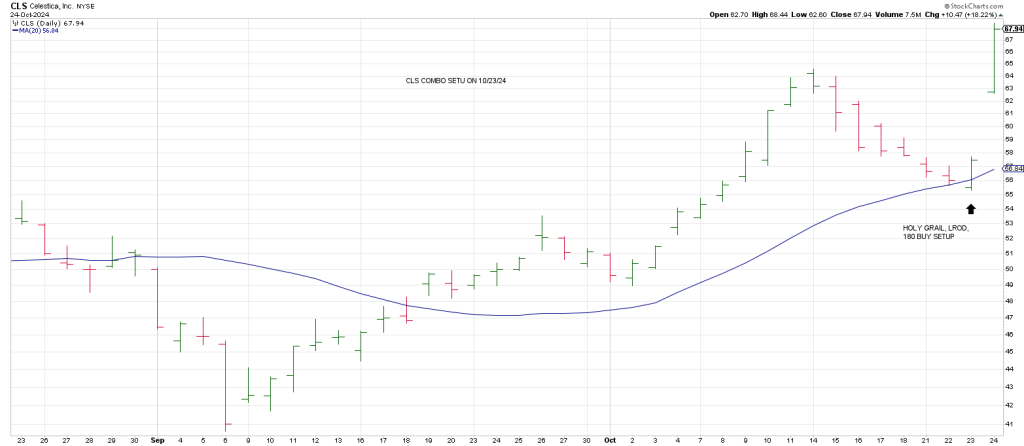
CLS was a long idea for Thursday based on a Combo Buy setup: a Holy Grail/LROD/180.
A Holy Grail is a pullback to the rising 20 day ma from a strong uptrend.
An LROD is a large range outside up day.
A 180 is a continuation signal: a stock in a strong uptrend closes near session lows and then closes at session highs.
GEV carved out an Expansion Breakout/LROD buy signal on Wednesday leading to an explosive move on Thursday.
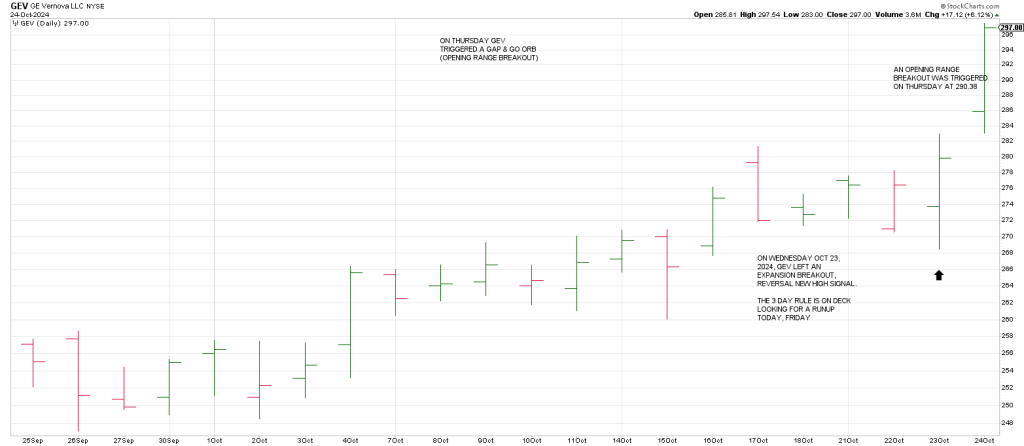
Notice that the GEV’s ramp on Thursday followed Wednesday’s Plus One/Minus Two buy setup.
The 3 Day Chart is pointing up and Wednesday satisfied 2 consecutive lower daily lows for the Minus Two part of this Swing Method.
In sum, stocks inhale and exhale on all time frames in the context of patterns of distribution and accumulation. Hit and Run’s job is to capitalize on both sides using Time and Price, the Lennon and McCartney of trading.