We haven’t looked at the DJIA for a while.
It struck a record high on Friday, October 18th at 43,325 (433).
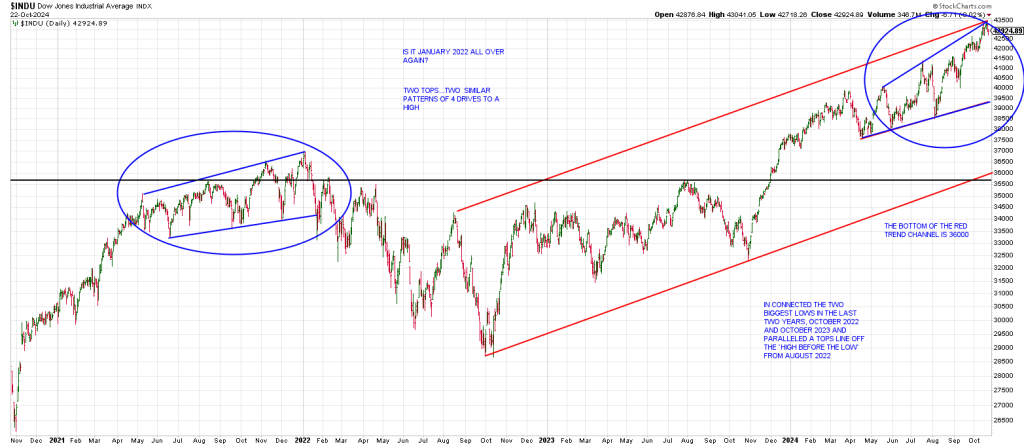
The pattern of the run up into the January 2022 peak looks similar to the current run up from April 2024.
Both were 6 month patterns of 4 Drives To A High.
Remember W.D. Gann stated there are 3 phases or sections in bull or bear campaigns…sometimes a 4th.
Two similar patterns; two tops?
I connected the two biggest lows in the last two years—the Oct 2022 low and Oct 2023 and then paralleled a Tops Line off the high before the low from August 2022.
This is the red trend channel
Notice the DJIA has struck the top of the channel for the first time.
The market should respect this touch, especially because it is coincident with the top of the Wedge from April.
We have confluence.
Notice the bottom of the red trend channel over coming weeks ties to the important July 2023 high—the black horizontal line.
Extending this black line backwards, notice the breakout failure to convert this level in November 2021, a quick drop back to support and then a final fling higher into January 2022.
When the black line was violated for the SECOND time, the bear market was on.
This time around support is a rising 3 point trend line from the August low that ties to the 42,000 region (trend line not shown).
Breakage below 42,000 opens the door to 39,500.
Breakage below 39,500 opens the door to the confluence of the bottom of the red trend channel and the horizontal black line at 35,500-36000.
That’s 7,000 points down from here.
The big question is if the setup is triggered, will it be an elevator or an escalator.
The Principle Of Alternation suggests it will be an elevator since the 2022 decline was an escalator.
If the October 18ith high remains the high, it is worth noting that October 18th/19th squares out with 386. That was the DJIA high in 1929.
October 19th this year was a Saturday.
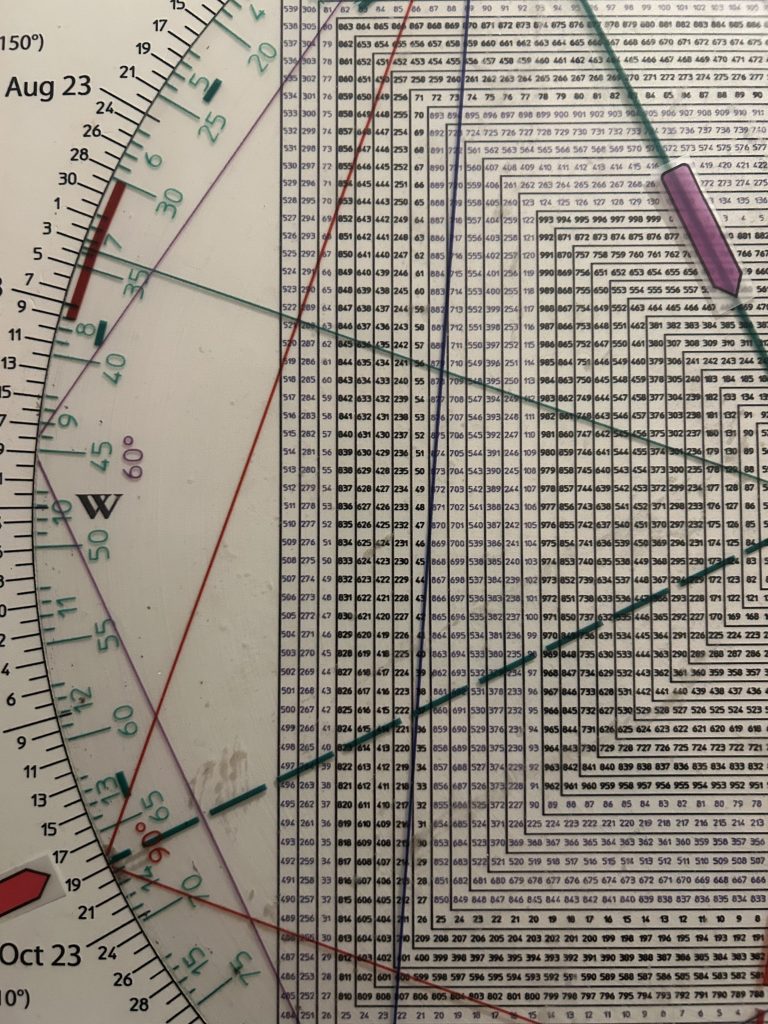
We’ve discussed several times the time/price synchronicity between 1929 and 1932 with October 2024.
This is just another relationship.
The DJIA turned its 3 Day Chart down on Tuesday because we have 3 consecutive lower daily lows.
It did so right off an all-time high.
If the DJIA cannot push higher and instead moves down below Tuesday’s 3 Day Chart low and extends below the aforesaid 42,000 level, we may have a major top on our hands.
Notably the DJIA 20 day moving average is currently at 42,528.
So breakage below 42,000 by definition is a significant Grail Fail (a failure below the Holy Grail, the 20 day ma.).
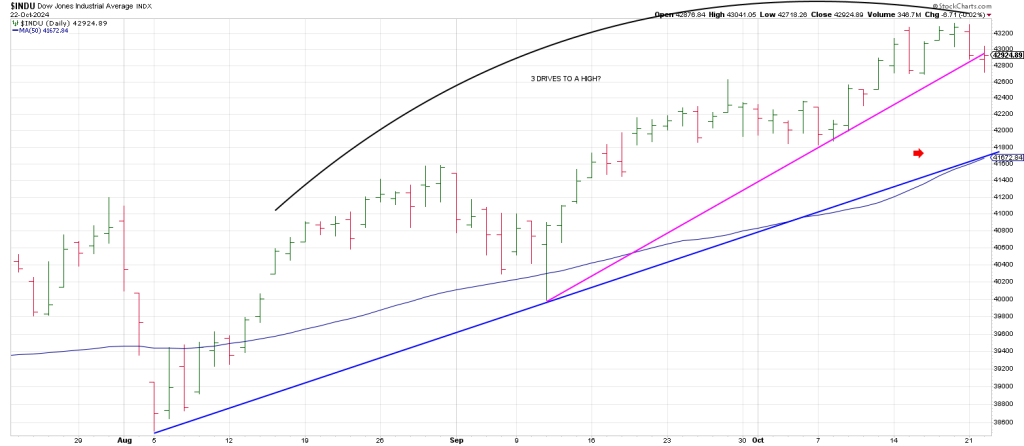
On Tuesday the DJIA clung to a close at a short term trendline.
Trade below Tuesday’s 3 Day Chart low and a close below the magenta trendline is in the Bear’s Wheelhouse.
This 42,000 region is significant because just below at 41,750, a Bottoms Line from August 5th intersects with the 50 day moving average.
The dominoes are lined up for a Waterfall Pattern…if the first domino flips—the 20 day moving average at the 42,500 region.
Silver
Following an explosive advance starting in April , SLV went into a Monthly Plus One/Minus Two Buy setup in August.
It came out in September with guns blazing.
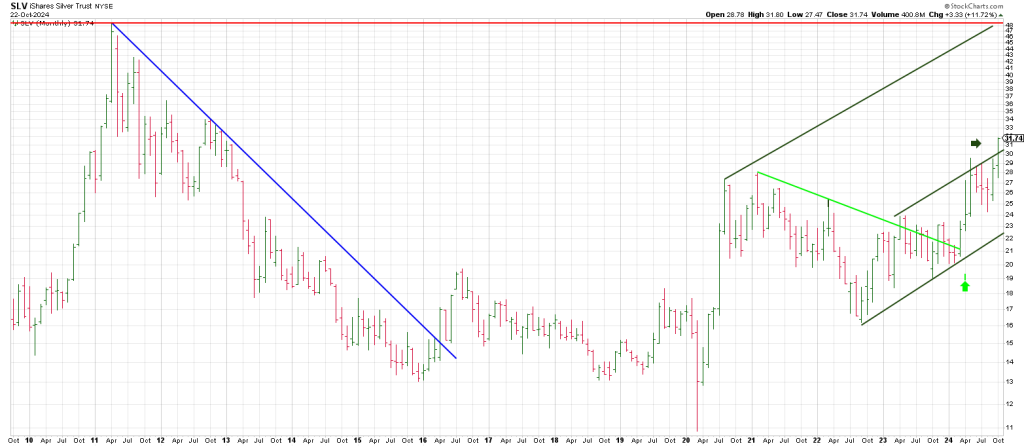
The April low is 24.25.
90 degrees up is 30.
180 degrees up is 36.
This week squares-out with 32.
Consequently momentum above 32 could see SLV sprint to 36.