“I couldn’t recognize my mistakes if I couldn’t forgive myself. To others, being wrong is a source of shame; to me, recognizing my mistakes is a source of pride. Once we realize that imperfect understanding is the human condition, there is no shame in being wrong, only in failing to correct our mistakes.” George Soros
“Your daddy said I took it just a little too far” Sweet Emotion, Aerosmith
Back in 1999/2000 there was the Dot Com Bubble.
Valuations were stretched beyond belief.
Expectations were great in the stock market.
People were saying the market can’t hold, there’s going to be a correction, when is it coming.
The market defied everyone’s expectations.
Why go back in time? One of the best ways to learn trading is through second-hand experience by learning what NOT to do from the mistakes of the greatest investors.
They weren’t born great. They became great.
Learning what not to do from mistakes of others is very cost-effective way to learn.
The other option is first hand experience. It’s expensive, but stickier—less easily forgotten to be sure.
The T Rex in the ointment of experience: it won’t make you immune from repeating mistakes.
All the information in the world is useless when emotions drive decisions.
Take Stan Druckenmiller.
He is one of the best investors ever. He averaged 30% per year over a 30 year career, with no losing year.
To achieve the kind of results that Stan has made takes extremely concentrated bets with a lot of leverage.
The exact opposite of the Wall Street bromide to be well-diversified.
You can’t do what everyone else is doing and expect to get superior returns.
To attain the kind of gains Drunkenmiller has requires something else in addition to concentrated bets with leverage: most importantly it requires an openmidedness to change your mind when you’re wrong.
People don’t like to admit they’re wrong.
“I’ve thought a lot of things when I’m managing money with great, great conviction, and a lot of times I’m wrong. And when you’re betting the ranch and the circumstances change, you have to change, and that’s how I’ve always managed money.” Stan Druckenmiller
And yet, emotions drove Stan to do something he knew was a mistake but did it anyway.
Druckenmiller retold he story of his worst mistake ever at the peak of the Dotcom boom in 2000.
“I made a lot of mistakes, but I made one real doozy. So this is kind of a funny story, at least it is 15 years later because the pain has subsided a little. But in 1999 after Yahoo and America Online had already gone up like tenfold, I got the bright idea at Soros to short internet stocks. And I put 200 million in them in about February and by mid-March the 200 million short I had, lost $600 million on, gotten completely beat up and was down like 15% on the year. And I was very proud of the fact that I never had a down year, and I thought well, I’m finished.
So, the next thing that happens is I can’t remember whether I went to Silicon Valley or talked to some 22 year old with Asperger’s. But whoever it was, they convinced me about this new tech boom that was going to take place. So I went and hired a couple of gunslingers because we only knew about IBM and Hewlett Packard. I needed Veritas and Verisign. So we hired this guy and we end up on the year—we had been down 15 and we ended up like 45 percent on the year. And the Nasdaq’s gone up 400%.
So, I’ll never forget it. January of 2000 I go into Soros’s office and I say I’m selling all the tech stocks, selling everything. This is crazy…at 104 times earnings. This is nuts. Just kind of as I explained earlier, we’re going to step aside, wait for the next fat pitch. I didn’t fire the two gunslingers. They didn’t have enough money to really hurt the fund. But they started making 3 percent a day and I’m out.
It is driving me nuts. I mean their little account is like up 50 percent on the year. I think Quantum was up 7%. It’s just sitting there.
So like around March I could feel it coming. I just—I had to play. I couldn’t help myself.
And three times the same week I pick up a—don’t do it. Don’t do it. Anyway, I pick up the phone finally. I think I missed the top by an hour. I bought $6 billion worth of tech stocks, and in six weeks I had left Soros and I had lost $3 billion in that one play. You asked me what I learned. I didn’t learn anything. I already knew that I wasn’t supposed to do that. I was just an emotional basket case and couldn’t help myself. So, maybe I learned not to do it again, but I already knew that.”
Fear of missing out. FOMO. Or, as Druck said, the need “to play” are just a few Magnets of Mistakes.
Emotions can cause even the best investor to do foolish things…even when they know it’s foolish.
You’ve been there. I’ve been there: we’ve all felt the pull of Magnets of Mistakes.
But try as we might, like Dr. Strangelove, we get ‘alien hand syndrome’ and can’t keep our hand away from clicking the buy/sell button.
It’s all too easy today to get into a trade. There’s not the time iteration of time there used to be of a phone call to place an order.
Emotion is the mother’s milk of speculation. September and October( so far) which historically rain on speculative fever have instead seen the market ramp.
September started to swoon from a lower high in August, a lower high to the July peak but reversed on September 11th.
Why? You know what they say: never let a crisis go to waste.
The Japan Carry Trade Unwind caught a lot of big players wrong-footed.
It seems ‘the market’ has learned the playbook well: whenever there’s a crisis and a need to pump liquidity, bulls mug the market.
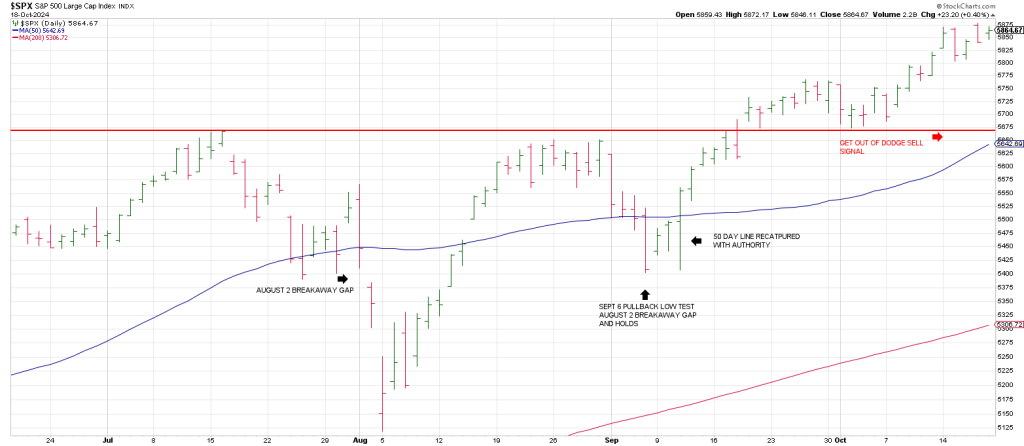
Since the August 2nd Breakaway Gap was recaptured, FOMO has trumped the tape. Notice the September 6th pullback stopped at precisely the level of the August 2 Breakaway Gap —5410.
When the 50 day line was recaptured with authority it was off to the races.
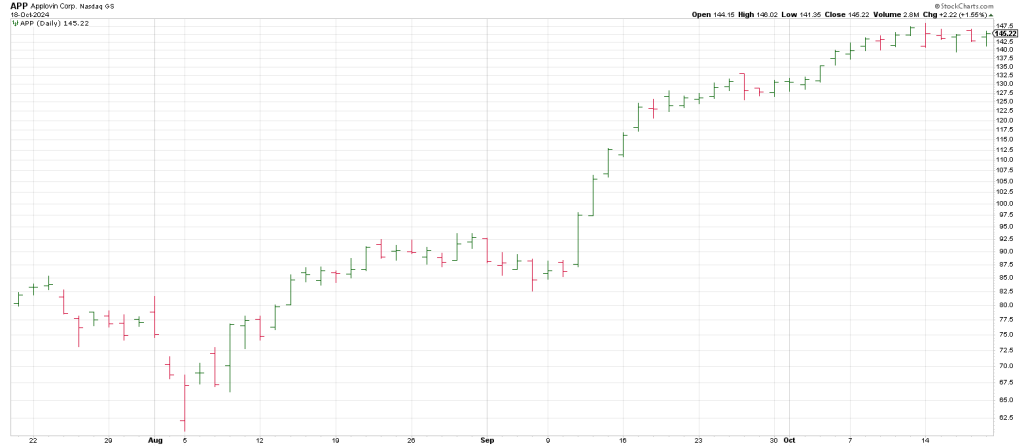
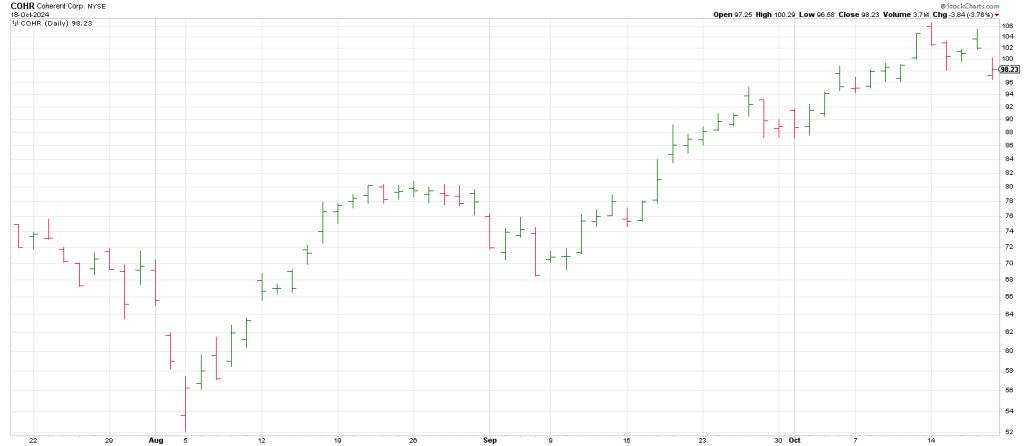
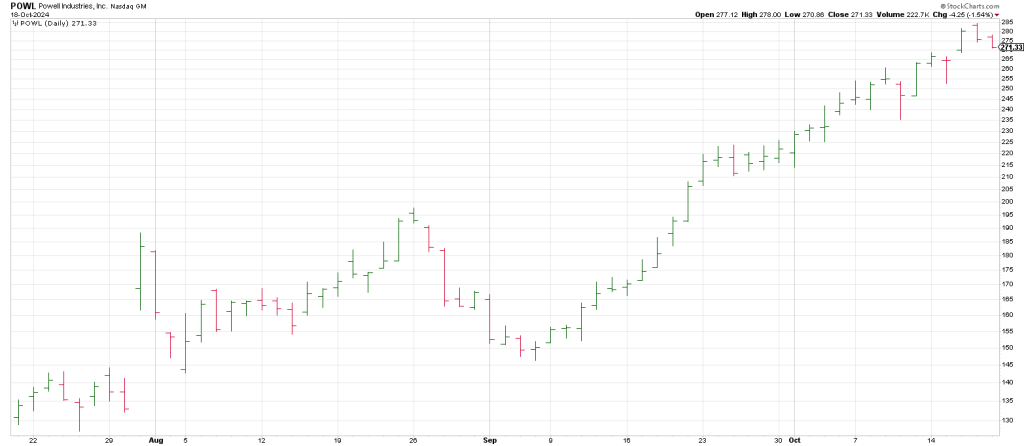
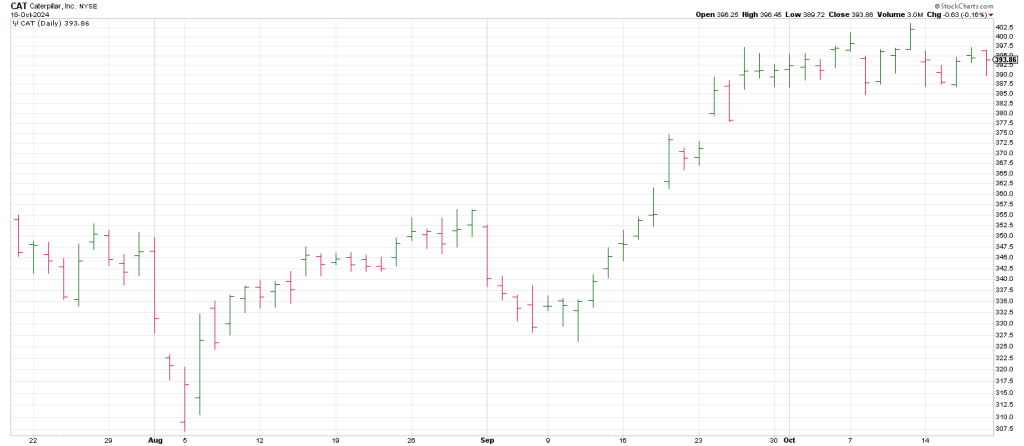
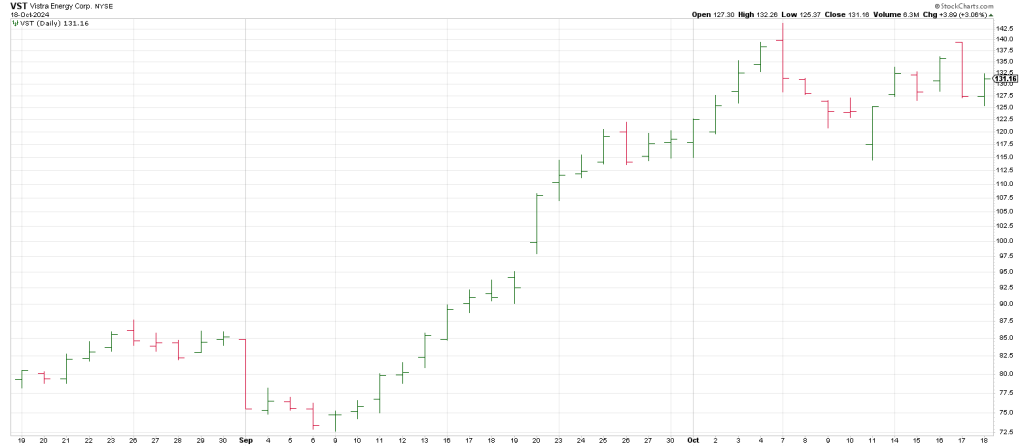
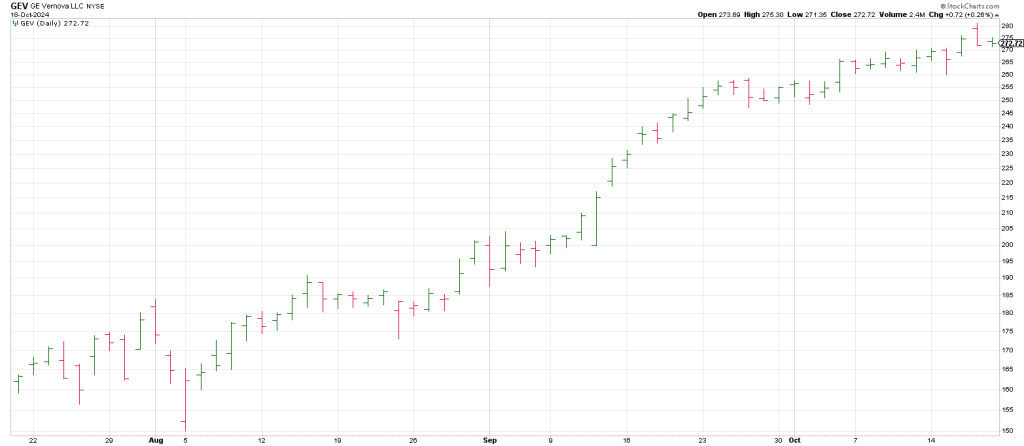
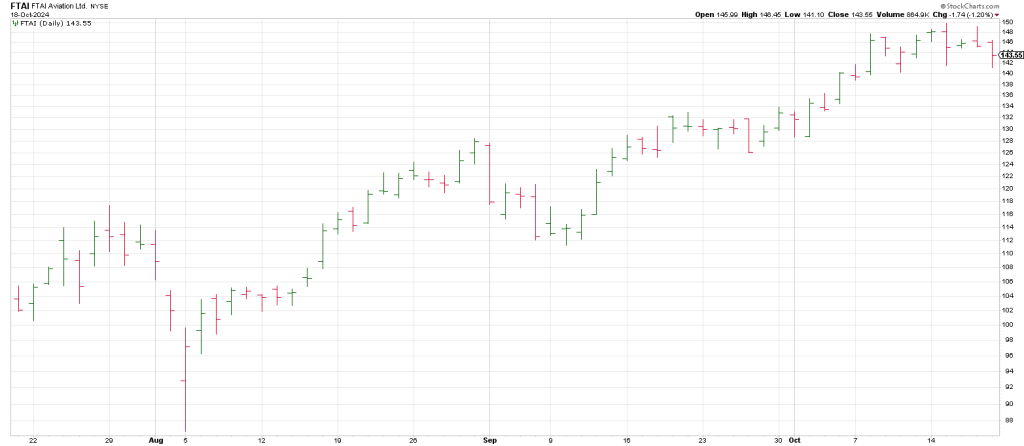
While the SPX and DJIA may not have gone vertical, many stocks have,
Names include:
APP
COHR
POWL
CAT
VST
GEV
And FTAI, to mention a few.
On September 6th, the SPX looked like it was headed to a test of the August 5th Flash Crash low.
But something funny happened on the way to the 200 day moving average which hasn’t been tested since last October 20th. Exactly one year ago.
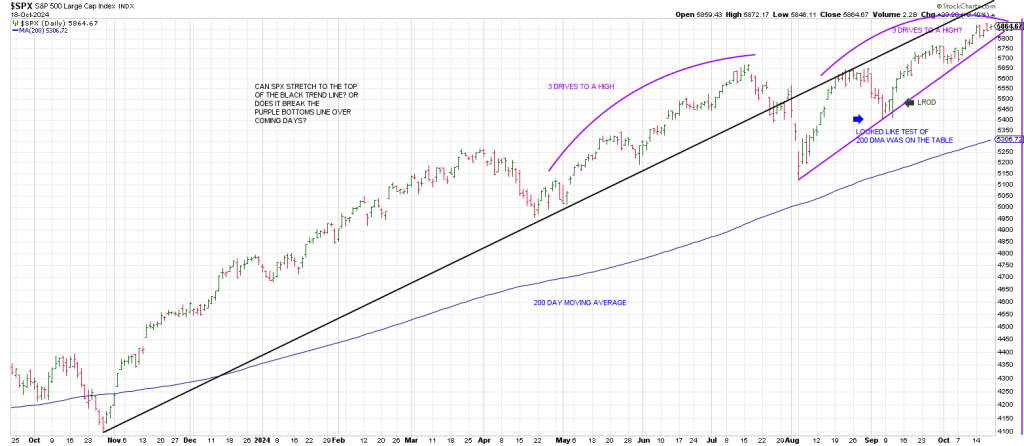
The September 6th stab lower failed to perpetuated downside follow through.
Instead, 3 sessions later, the index carved out an LROD, a Large Range Outside Up Day.
We’ve been grinding higher ever since to the 584 (5840) square-out region flagged last month.
While the SPX closed at a record high on Friday, north of 5840 at 5864, the SPY did not.
It closed at 584 on the weekly closing basis.
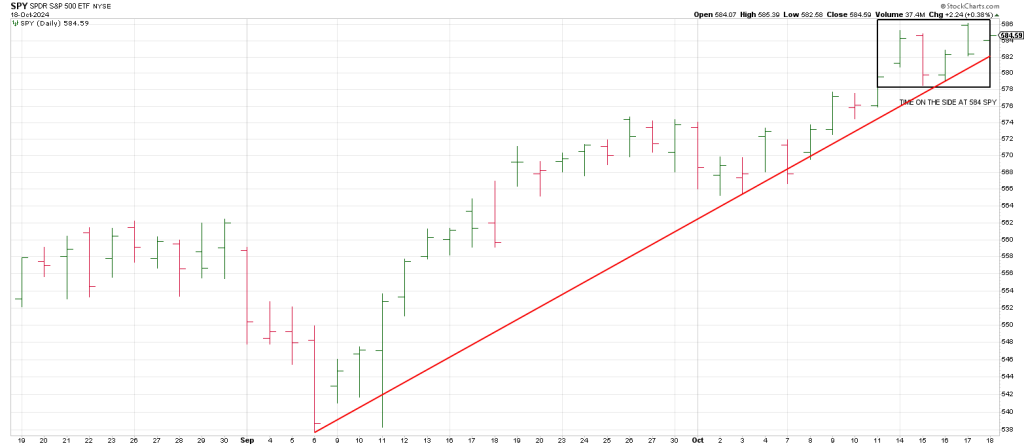
As well, last week momentum waned; both the SPY and SPX traced out a sideways stint.
Of course it could be a high level consolidation—a Bull Flag, but 584 squares out with October 16th.
At potential pivots, it’s always the “week off”.
Additionally the SPY left a Gilligan sell signal on Thursday.
This is a pattern I created that does a good job of identifying exhaustion.
It is a gap up to a new 60 day high (or low in the case of buys) with a close near session highs.
This week is the 95th anniversary of the air coming out of the market on October 24th, 1929.
So this one week pause from last weeks square-out into the October 24th anniversary is interesting,
Especially as ‘95’ squares out with October (October 4th specifically)
Last weekend I found a remarkable ‘natural time factor’, a cycle I had never seen before, that has nailed tops and bottoms, whether interim or major turns.
Tomorrows report will walk thru this discovery and what it means for the future.
This year The Cycle showed up on March 28th, just before a downdraft into April 19th.
It showed up on July 20th, July 21st AND July 22nd, This ‘trifecta’ preceded a Flash Crash.
Remarkably, this ‘hidden cycle’ showed up on August 6th. The low of the Flash Crash was August 5th.
On September 30 we got a hit. It was a very minor top. My take away is that breakage below the September 30th high of 574 SPY will be the first sign of a top.
What’s fascinating is that on October 24th The Hidden Cycle hits…the anniversary of the pin popping the bubble in 1929. We also show a hit on October 28th AND October 29th this year—
The anniversaries of Black Monday and Black Tuesday in 1929.
Taken together the DJIA lost just shy of 25% on those two days.
We’ll be showcasing this Hidden Cycle in Hit and Run Reports going forward. It looks particularly significant in 2025.
Suffice to say that it must be used in tandem with other technical measures to determine the nature of The Cycle.
In sum, this time frame is important: the Airpocketism in 1929 started along with the Black Monday, Oct 19th, in 1987.
The 1932 low was 92 years ago. 92 squares-out with October 29th.
Amazing.
This potential big picture synchronicity is in the context of 584 being opposite late last week for a possible Time/Price square-out.
Checking a daily SPX from the important April 19th low shows 3 Drives to the July 16th high,
Almost a perfect 90 day/degree Gann cycle.
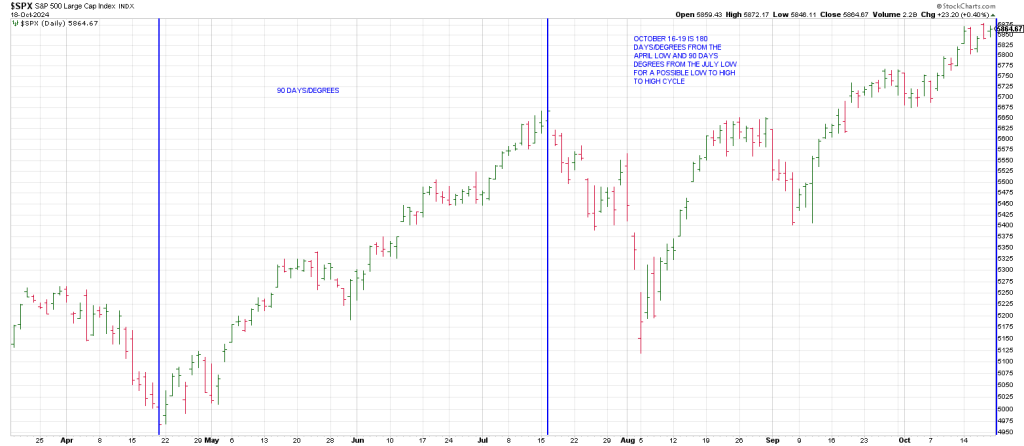
The SPX has also traced out 3 Drives higher from the August 5th low.
Of course it is premature to say the current drive is complete.
That said we are 180 degrees/days from the April 19th low and 90 days/degrees from the July 16th high.
A Low to High to High Cycle is on the table.
As well end of this week is 360 degrees/days from the major October 27th low.
90 degrees/days from the big August 5th 2024 low is the election, November 5th.
In sum, this week and into the election sets up a strong confluence of turning points.
Bet the Ranch Setup?
Perhaps, but momentum beyond this week and this 584 SPY region opens the door higher.
Going back to the election, odds.checking.com has a GOP sweep surging to 33% odds.
The experience of history in the GOP sweep in 2016 may not serve market participants well.
The 2016 GOP sweep was sweet for stocks and oil but sour for gold.
The price action this past week two weeks in front of the election show gold and oil are diverging:
Oil is sour and gold is sweet
As well last week tech had its largest weekly outflow since June while gold had its biggest inflow in 12 weeks.
Based on “experience” from previous Republican Sweeps, gold should be lower and oil significantly higher.
Does this suggest oil may be finding an interim low and gold an interim high?
It just goes to show correlation can kill…as it has killed those who bet against gold and the market rallying together in the last year.
Gold was in a bear trend from August 2011 to December 2015 while the popular stock indices were in bull markets.
Gold advanced from late 2015 to August 2020 where it reversed to trending down for two years into October 2022.
Conversely, the stock market continued higher into the end of 2021 before buckling into the October 2022 bottom
Since October 2022 both have been rallying in tandem.
I believe gold is driven by uncertainty in government, the fiscal train wreck in the U.S. underpins gold’s record streak.
Some believe gold is driven by inflation. If that is the case someone’s lying about the inflation rate in the U.S. retreating.
Be that as it may, since both gold and the stock market have been in runaway moves since October 2023, a turn in gold it may speak to a top in markets as well.
Let’s take a look at gold.
Gold is following the path we laid out two years ago when GLD staged a breakout in early November 2022
From that 150.50 low we forecast a 360 degree run – up to 203 with a drive over 203 opening the door to 232.
232 being 540 degrees up and straight across and opposite from the 150.50 low.
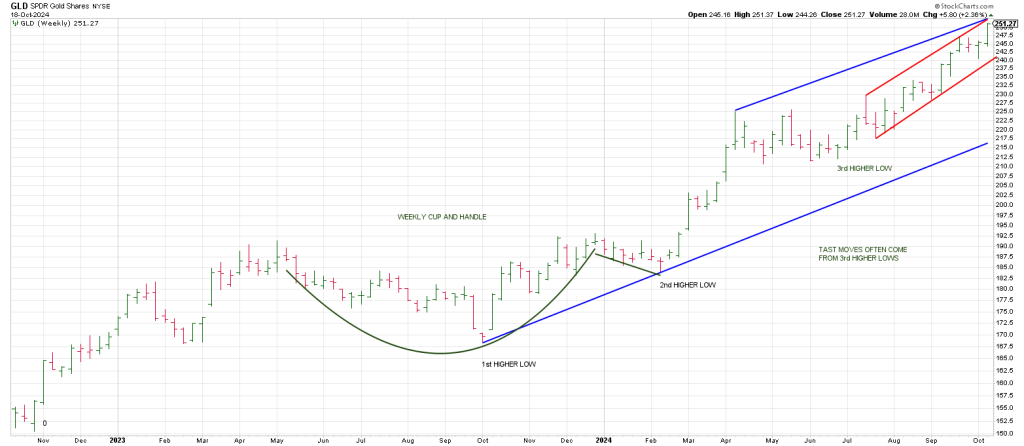
Bullishly GLD hovered below 203 at 191 tracing out a Cup and Handle.
Consequently, when GLD cleared 203, it exploded
When creating projections with the Square of 9 Wheel, one must consider intervening lows to measure from.
The low one year after the October 2022 low in October 2023, the Intervening Low, occurred at 168.
360 degrees up from 168 is 224.
Look at the multi-month high level consolidation at the 224 region.
540 degrees up from 168 is 255. GLD reached a record high of 251.37 on Friday—just shy of 255.
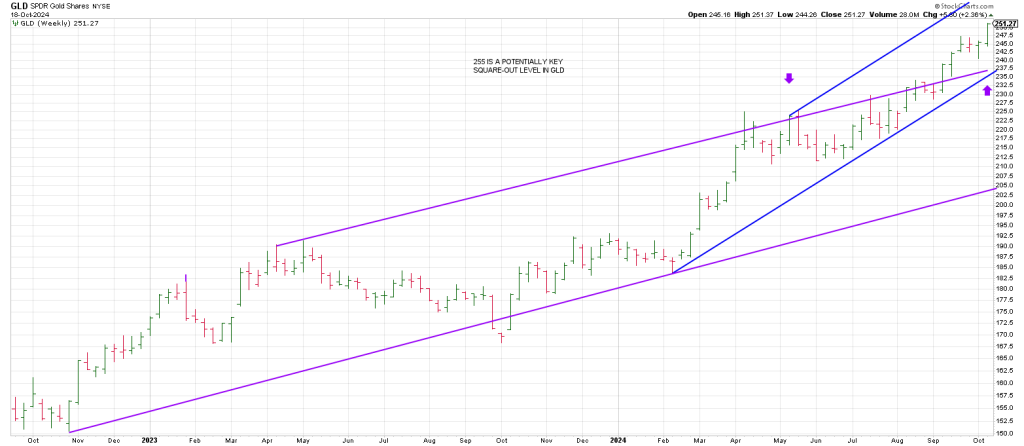
This ties to the top of a weekly trend channel as well.
I think this 255 region may be very important.
Drilling down to the dailies from the August acceleration shows a daily channel also ties to 255 region.
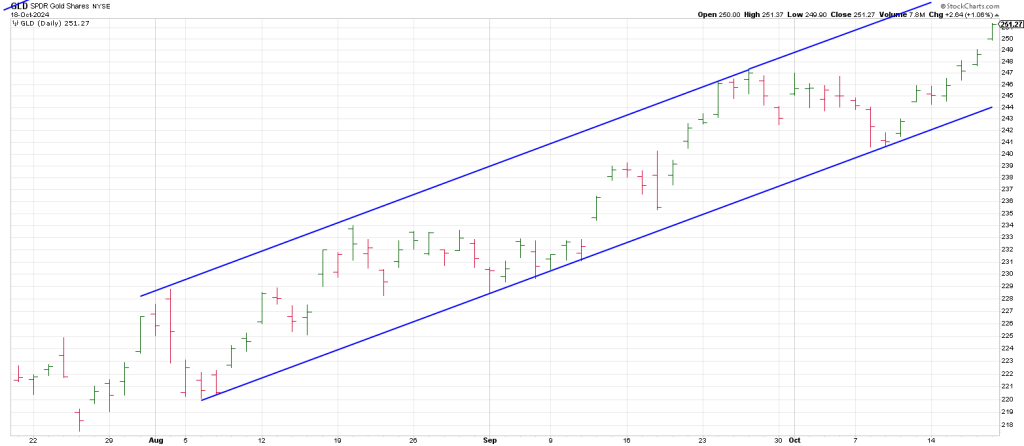
This week is opposite 260. Does GLD Pinocchio the top of the trend channel and reverse?
gold ran all week exploding to a record high of 2722 on Friday while the SPX was essentially flat all week having struck a record high Monday.
Interestingly 2722 is a potential Time/Price square-out as 2722 is 180 degrees straight across and opposite this week.
Throughout the last years advance in gold, Wall Street yawned.
Now the Street is climbing on board the train?
Are they pulling a “Druck”?
Hit and Run members have been rewarded by their patience in long SLV November, December and January 2025 calls as silver outpaced gold on Friday with a stunning breakout.
A daily SLV shows a Triple Top Breakout (a Rule of 4 Breakout) above May July and September tops.
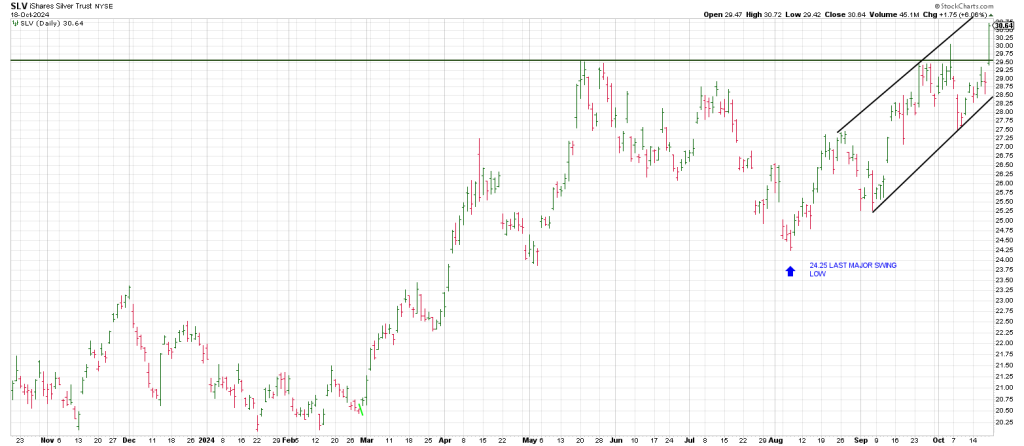
The last swing low was 24.25 on August 7th,
90 degrees up is 30.
Since SLV eclipsed 30 with authority on Friday closing at 30.64 the door is open to 36, the next decrement of 90 degrees higher.
This week squares out with 32.50.
The strong likelihood is that 32/33 will be struck this week
Giving Hit and Run an opportunity to lock in gains on some of the November and December calls in SLV and WPM.
SLV is at 11 year highs. While it may explode to 36 here, it is worth noting that 36 is also 360 degrees up from the fall 2022 low of 16.
While silver is likely going much higher in coming over time, with the election also 90 degrees/days from the early August low and a square-out on deck,
Emotions are running high. Risk is running high while on October 14th we reached the most extreme valuations in the history of the U.S. financial markets
That does not mean things cannot get crazier, but you cannot outrun risk.
QQQ holds the key.
Following Tuesday’s large plunge, the Q’s stabilized the rest of the week.
Friday QQQ left an NR 7 Day, the narrowest range in 7 days.
These contractions are typically followed by expansions in volatility within the next few days.
Breakage below the 20 day moving average in the context of the current pattern 3 Swings To a Test of all time highs warrants caution.
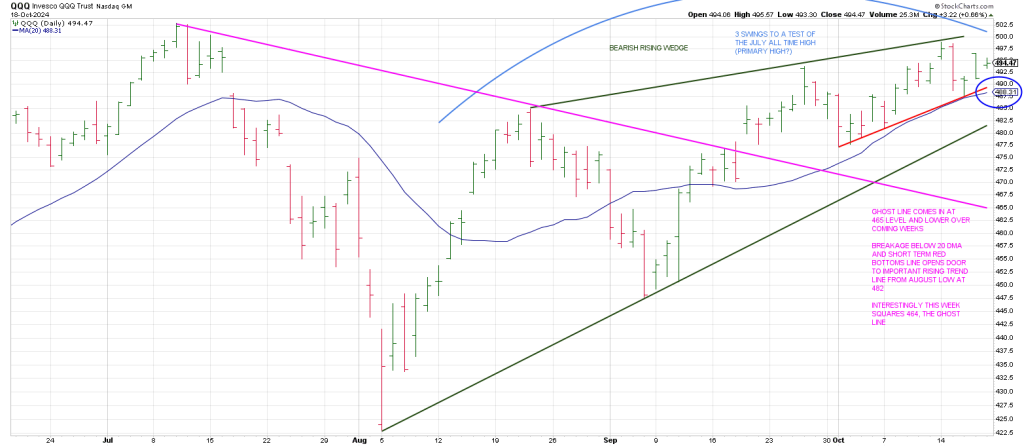
Within this pattern of 3 Swings To a Test, the Q’s also show a bearish Rising Wedge (green).
Below the 20 day moving average opens the door to the bottom of the Rising Wedge at 482 this week.
Breakage below 482 region opens door to a Ghost Line at 465/464 this week.
This important week squares 464.
With chips like AMD reversing from our 175 square-out and AMAT down for the count, is it time to bet the ranch short QQQ?

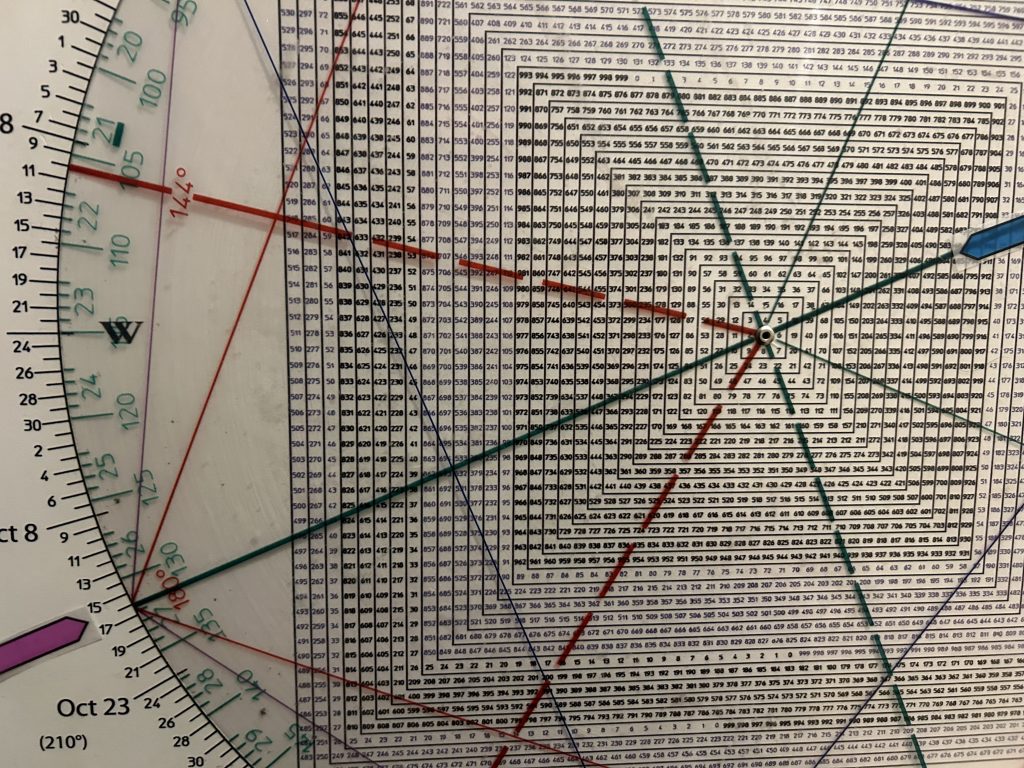
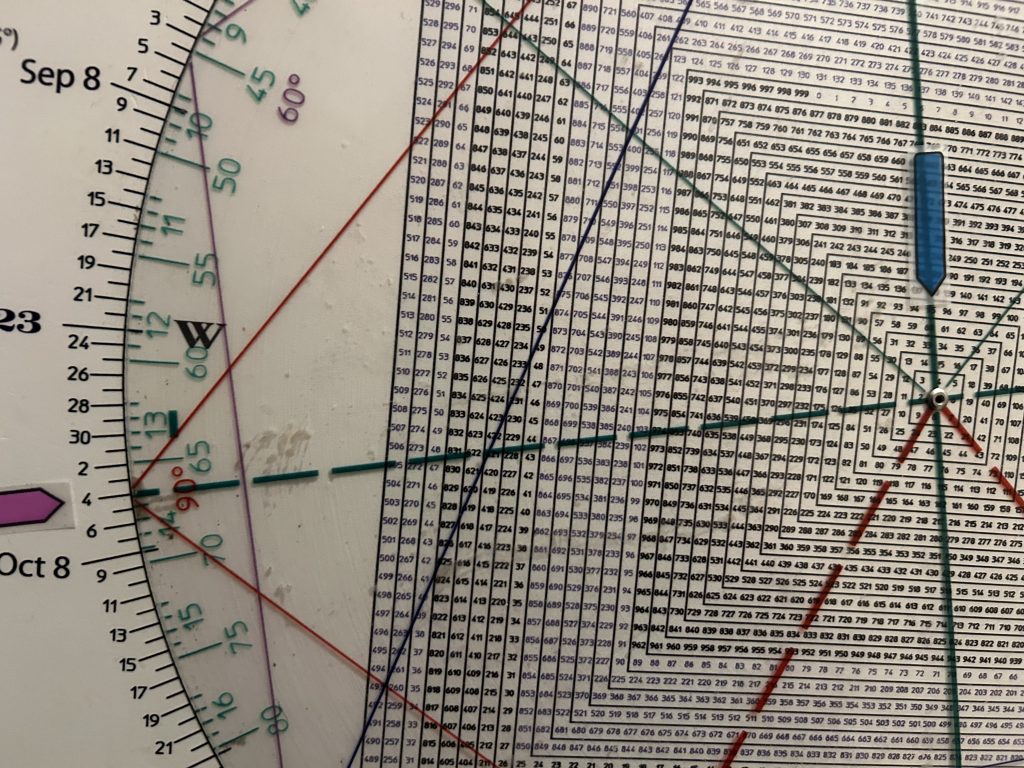
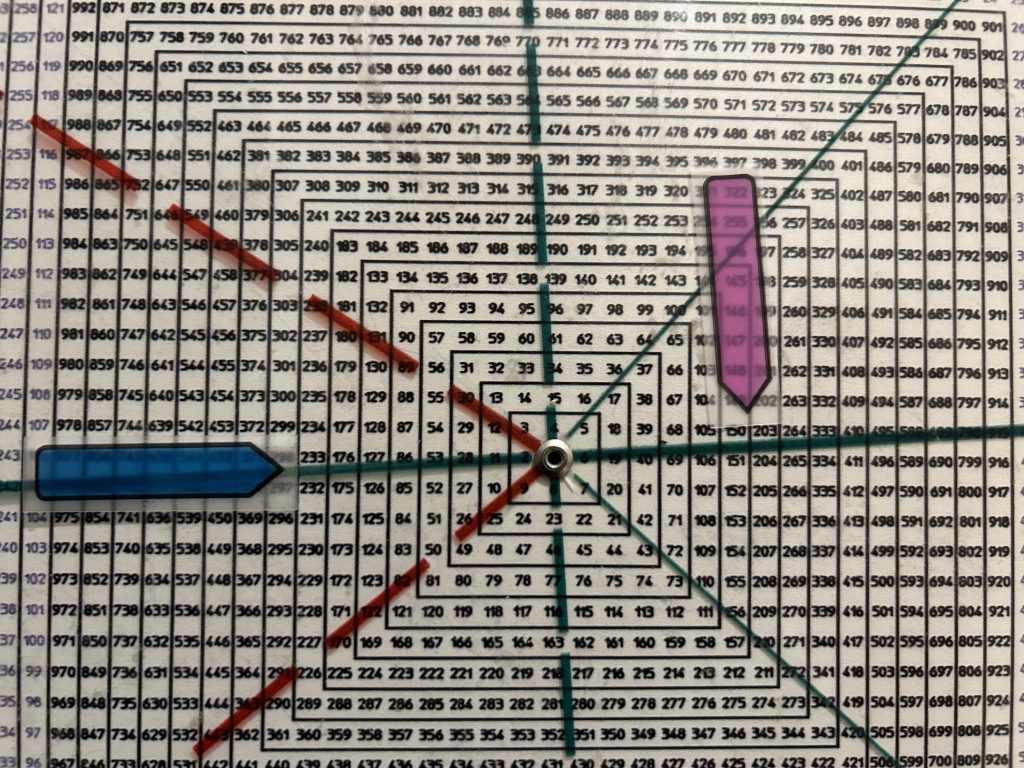
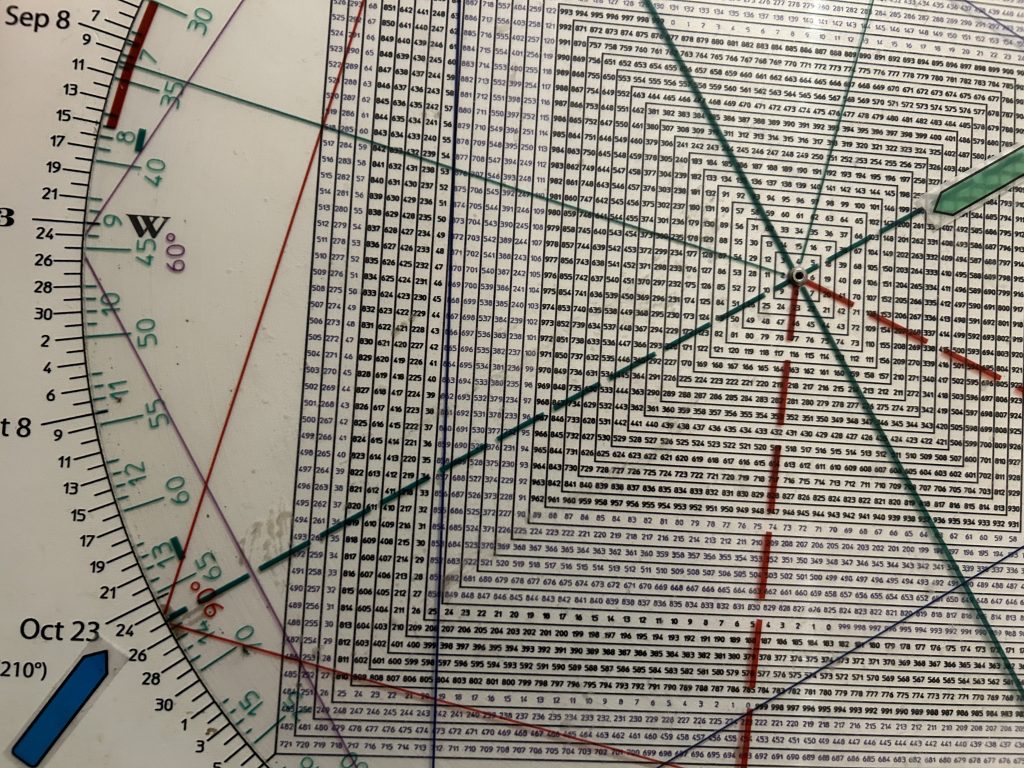
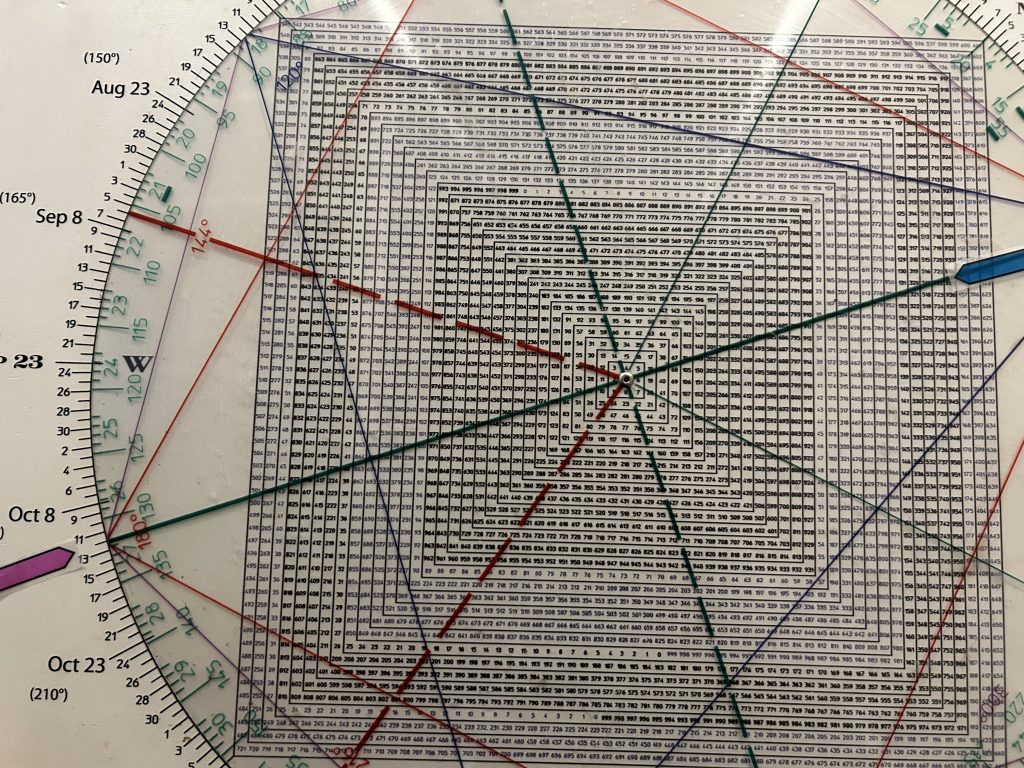
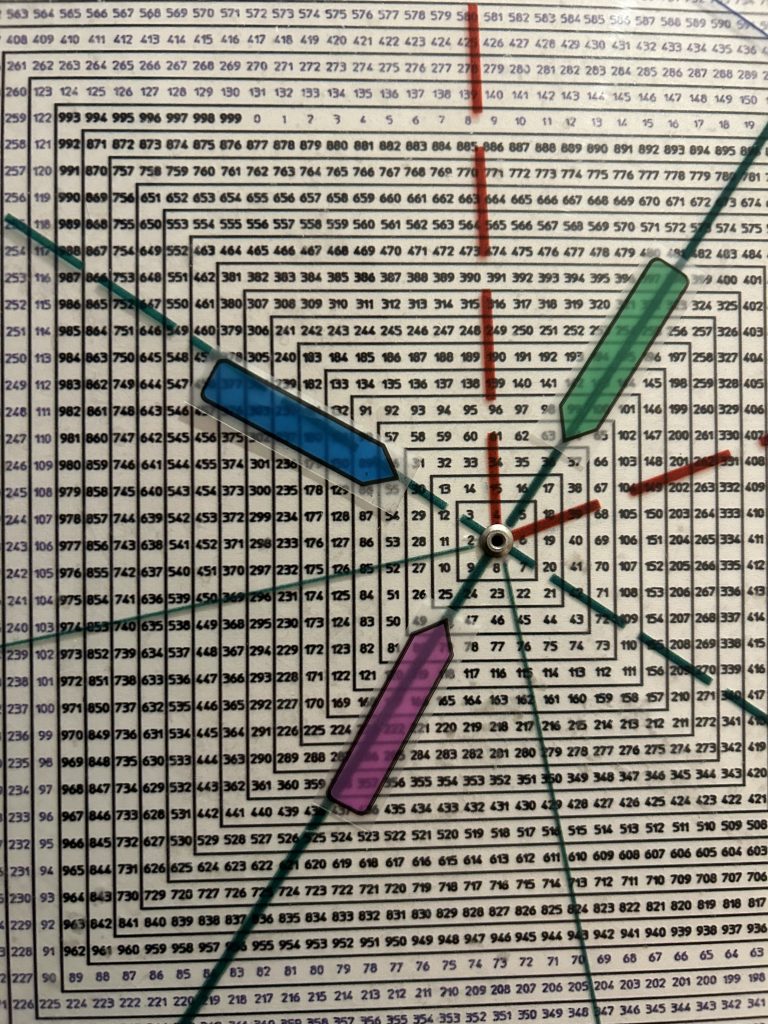
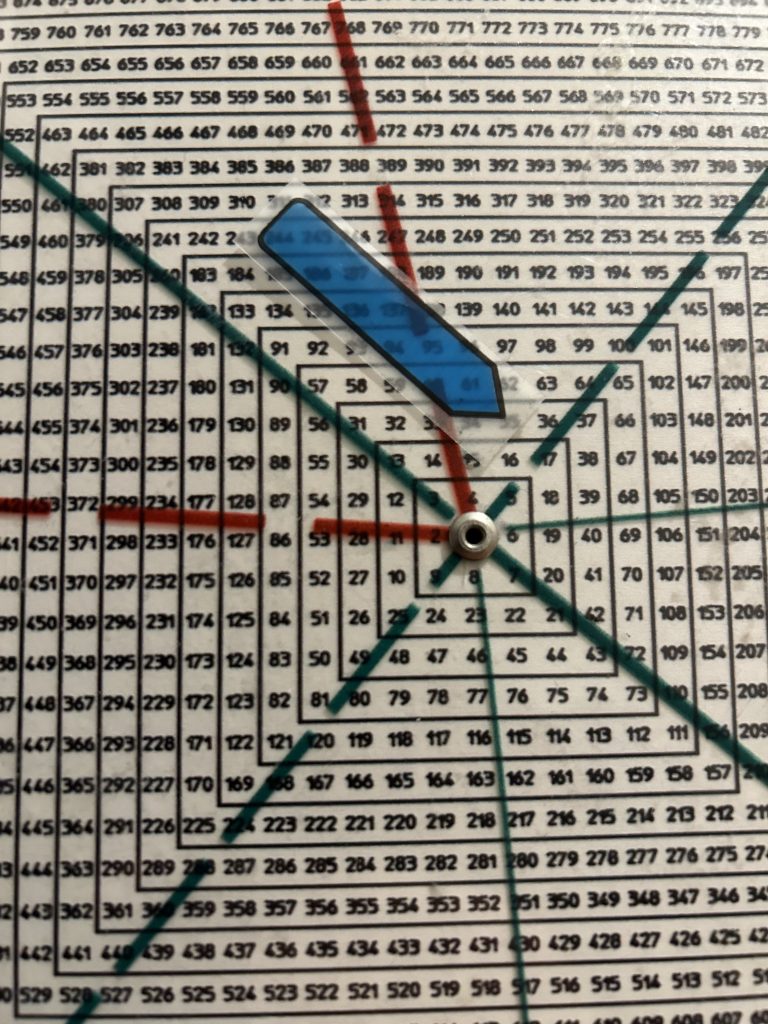
Square of 9 Wheel
Purchase your own Square of 9 Wheel. Shipping to US only. Contact Jeff for shipping outside the US.