“Mathematical science, which is the only real science that the entire civilized world has agreed upon, furnishes unmistakable proof of history repeating itself and shows that the cycle theory, or harmonic analysis, is the only thing that we can rely upon to ascertain the future.” W.D. Gann
This weekend I am working on an article on the confluence of pattern, anniversary dates and square-outs at important tops.
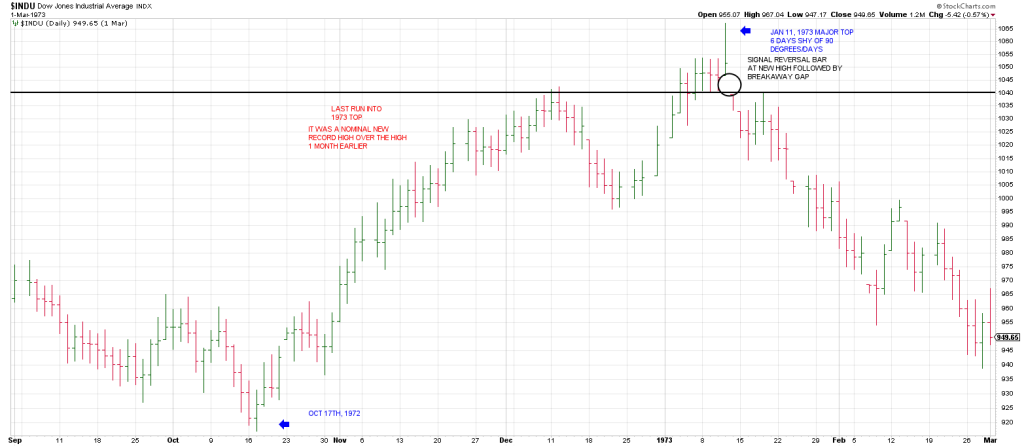
This morning let’s delve into one such major top, January 11, 1973 which was followed by a devastating bear market into a October-December 1974.
October 4th 1974 was the Primary Low at 573. A Secondary Low occurred on December 6th at 570.
Allow me to blow your mind.
The top that occurred on January 11, 1973 was at 1067 on the DJIA.
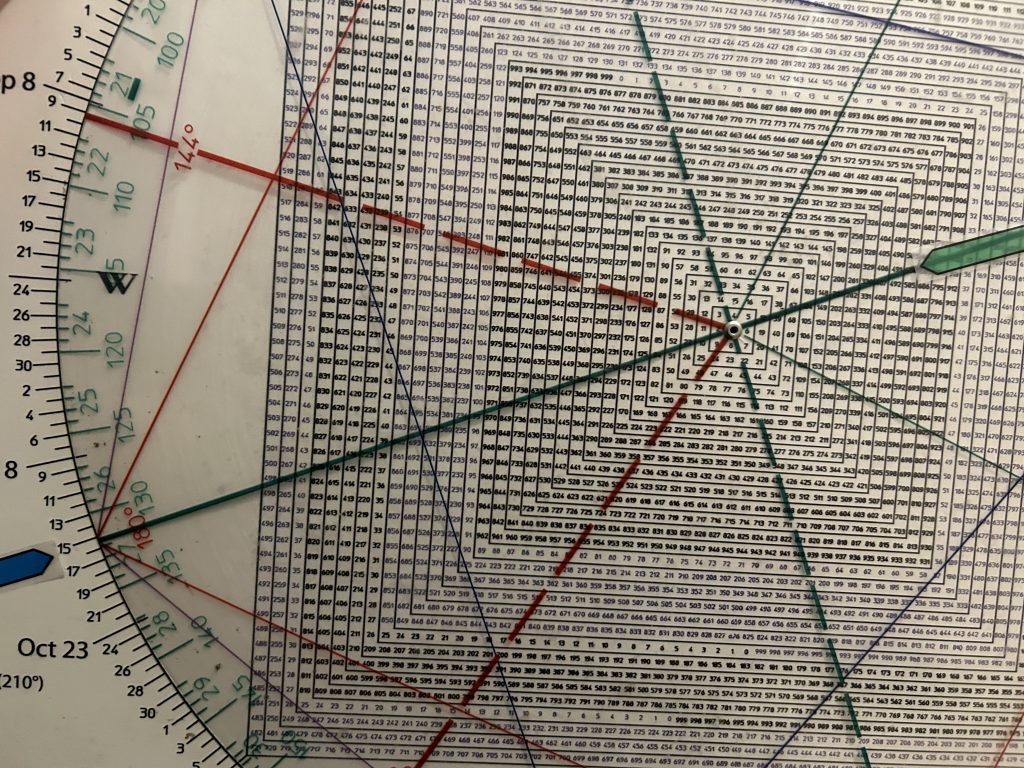
On the Square of 9 Wheel, 1067 “points to”/aligns with January 11th.
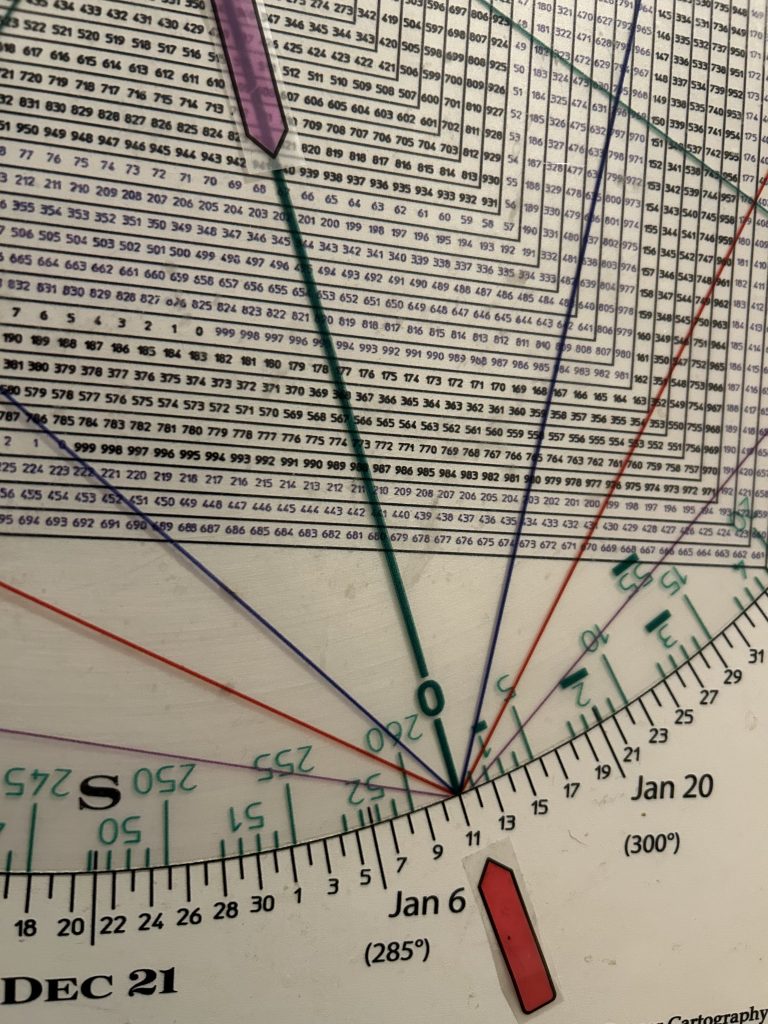
Succinctly, there was a Time/Price square-out at the major high.
Amazing.
Not really if you’ve been a reader of my stuff since 1996 and have seen the Wheel Of Time and Price nail turning points in real time.
Hit and Run has shown thousands of examples of Time/Price square-outs in the indices and stocks.
Some interim highs and lows.
Some major tops or bottoms.

Square of 9 Wheel
Purchase your own Square of 9 Wheel. Shipping to US only. Contact Jeff for shipping outside the US.
W.D. Gann’s theory states that every major high and low is related in time and price.
The theory is based on the idea that time and price are harmonics of each other and have a natural geometry that can be used to predict tops, bottoms and fluctuations.
The pattern at the January 11, 1973 peak underpinned the Time/Price square-out.
How?
Well often at major highs and lows there is a Bull Trap or a Bear Trap—a false breakout.
Such was the case in January 1973 when the DJIA broke above an early high from December.
Within a week after the breakout, the DJIA tailed off leaving a signal bar reversal.
The complexion of the top was underscored by a Breakaway Gap the next day.
Importantly the gap knifed through the prior December peak.
It was no ‘run of the mill’ gap.
Notice the 3 Day Chart turned down directly off the all time high.
It was followed by 2 consecutive higher daily highs putting the DJIA into my Minus One/Plus Two sell position. Why? The 3 Day Chart was pointing down for a Minus One. The 2 consecutive higher daily highs satisfied the Plus Two part of my Swing Method.
Notice that the – 1/+ 2 sell setup occurred on a backtest of the horizontal black line which defined the level of the prior peak in December.
False moves lead to fast moves and this was clearly the case in January 1973.
How about the dates where the last run started, October 17th, 1972 and January 11th, 1973.
Are these important anniversary dates?
October 19th was Black Monday in 1987. That year October 17 was a Saturday,
Mid to late October has been an important anniversary since the inception of the NYSE— including the acceleration into October 24, 1929 when the air came out of the bubble.
Mid-October was the big low in 2022.
Late October was the big low in 2023 which started a Runaway Advance.
January 11th, early January ties to the major top in 2022…another false breakout/Bull Trap.
It also ties to the Primary High in 2020 prior to the Covid Crash
THE DJIA TOPPED ON THE WEEK OF JANUARY 10th, 2000.
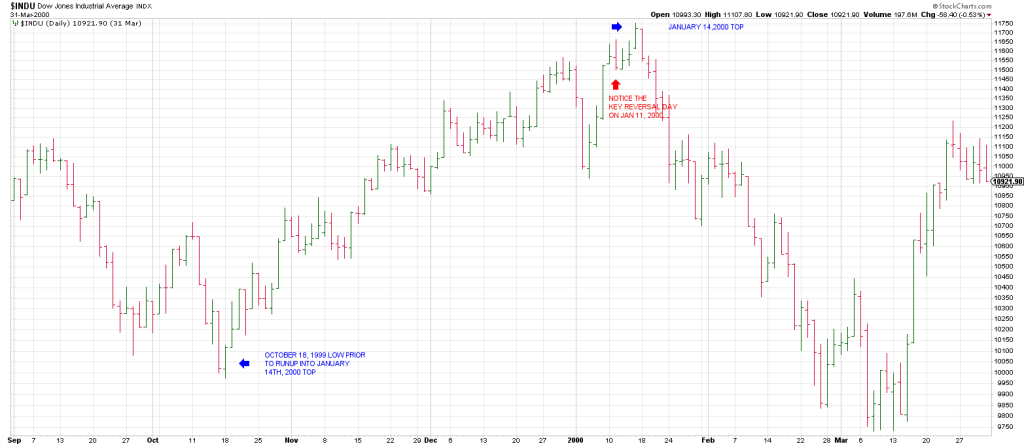
So the DJIA top in January 2000 was at the anniversary of the January 1973 top.
Notice the date of the low for the last run-up in 1999 to the DJIA January 2000 top: October 18th
Happenstance?
Today is October 18th.
We’ll delve more into time/price harmonics in Monday’s report.
In the above chart of the 1973 top, notice that the last runup from October 17th, 1972 was just shy of 90 days/degrees.
The DJIA topped on January 11th whereas a full 90 degrees would tie to January 17th.
The market isn’t Rolex…or is it. Notice the backtest before the downside acceleration was near January 17th.
This is called Lost Motion….the top coming in a little early than the idealized time.
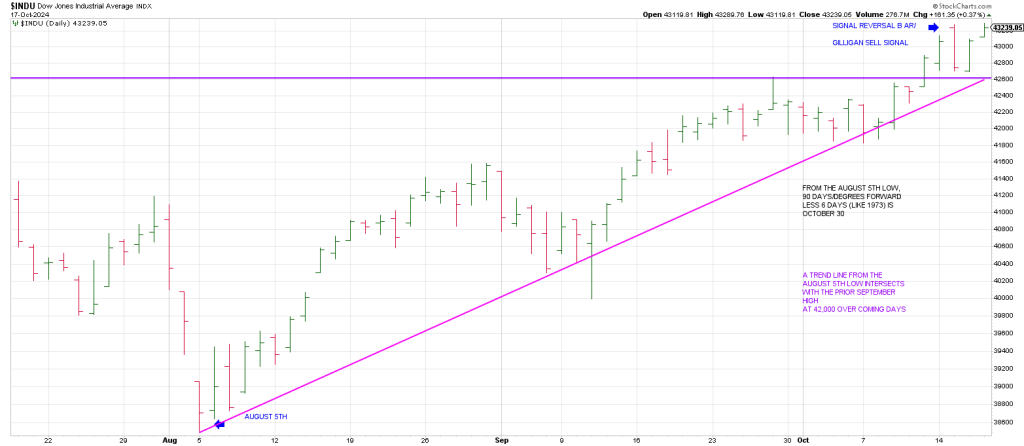
In our current market, we had a big low on August 5th.
A 90 day runup gives November 5th (election day).
6 days prior to November 5th—in keeping with the 6 day offset at the January 11th 1973 top, is the end of October.
This ties to the October 29, 1929 Crash Day.
Why this interests me is because since last spring, I have been thinking this year could be a mirror image foldback to 1929.
In other words, the potential for the market to crash UP into late October.
If we’re measuring a Super Cycle from the 1932 low, that is 92 years ago.
On the Square of 9 Wheel, the number 92 squares out with October 29th/31st.
You can’t make this stuff up.
In sum, notice on the above DJIA for the current time-frame that the index left a signal reversal bar on Tuesday of this week—a Gilligan Sell signal (a gap up to a new 60 day high with a close near session lows).
We did not get downside follow through the DJIA found support at the prior high in late September.
On Thursday, the DJIA tested Tuesday’s reversal high.
If a Test Failure plays out breakage below 42,000 opens the down door.
This confluence of a Bottoms Line from the August low and the horizontal line from the September peak intersects time-wise over coming days.
Why would I think the DJIA could falter?
The SPX sprung a Trap Door yesterday.
It gapped up to a record high and closed on it’s lows leaving a Gilligan Sell signal.
Moreover, a ‘pattern high’ may be on the table at what we’ve been suggesting may be an important Time/Price square-out.
Namely, 584 (5840) is 180 degrees straight across and opposite this week.
The SPX has been backing and filling at this 5840 level all week.