“There are no new eras—excesses are never permanent. History is littered with boom—and-busts periods—nothing lasts forever. The great Tulip Mania of the 17th century, the dot.com bust of 2000, and the 2008 housing debacle personify this rule.” Bob Farrell
“Once you know you can never go back
I gotta take it on the other side.” Otherside, Red Hot Chili Peppers
The period from around mid to late October is historic in financial markets.
In September we walked through the following array of significant market turning points centered near this mid-October period.
- The bear market low in 2022
- A Flash Crash low in 2014
- A major low in 2011 which perpetuated an uninterrupted advance for 3 years
- A crash low in 2008, a Primary low which ultimately was followed by the Secondary Undercut Low in March 2009
- The major bull market top in 2007
- The major bear market low in 2002
- A crash low in 1998
- A major low in 1992
- A major low in 1990
- the 1987 crash
- the 1929 crash
- after the initial up-thrust from the major August 1982 bear market low, the market saw a confirming surge higher in early October 1982
- an interim rally high in 1973 that marked the beginning of the second leg down in a the 1973-to 1974 bear market
- The Primary Low in 1974’a major crash low in 1966 marking the end of an 8 month slide
- A major secondary low in 1962
- A major low in 1957 that marked the low prior to the beginning of a runaway move into August 1959
- A crash low in 1946
- The pivot low in 1924 that marked the true start of the Roaring 1920’s bull run
Why is October so pivotal?
For one, it is7 months from the natural beginning of the year, the Spring Equinox.
7 is the number of time and panic.
This October, specifically October 16, today, is 90 days/degrees from the July 16th peak this year.
A peak that gave rise to a Flash Crash.
Mid-July also marked a peak in SMH, the semi-conductor index.
It is a peak that has not been surpassed despite the new highs in the SPX and DJIA.
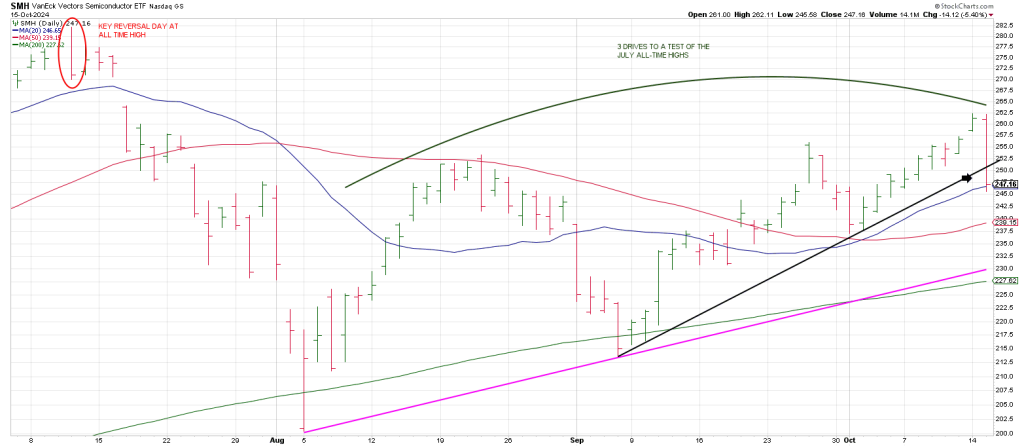
Significantly I think, SMH shows a pattern of 3 swings to a test of toward its July all-time high—what I call a “ 1 2 3 Swing To A Test” pattern.
It is a powerful pattern on all time frames.
A WEEKLY 1 2 3 Swing To A Test nailed the Secondary High at the end of August 2000.
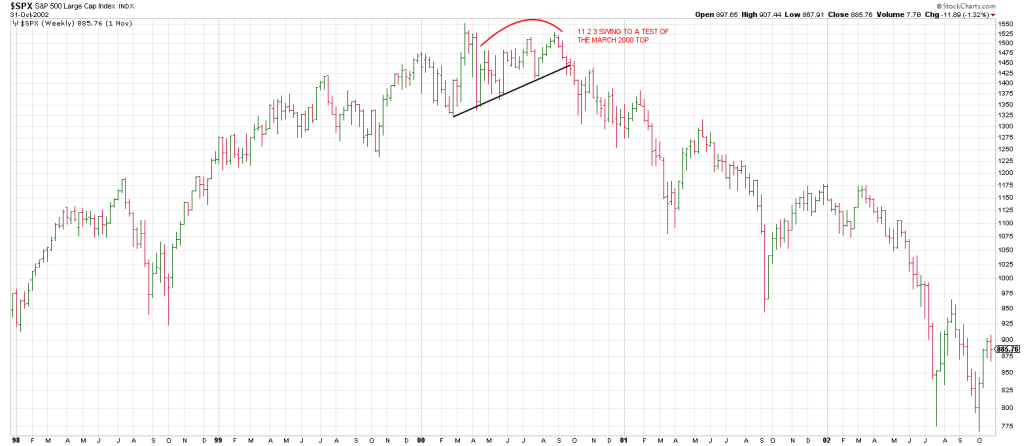
In my report that day, so convinced I was of the importance of the pattern that I wrote:
“The most speculative part of the market, the NAZ, is as dangerous here as was the DJIA at the end of August 1929.”
Over the next two years the NAZ went on to mirror the dramatic loss in the DJIA from 1929 to 1932.
Over a 35 year trading career I have learned, sometimes the hard way, that markets play out in threes.
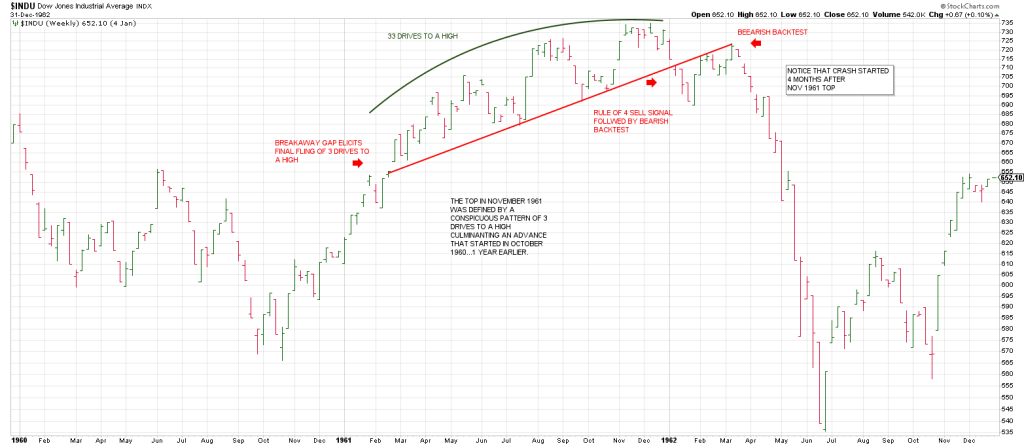
This same pattern of 3 Drives to a High …and a Backtest played out in 1961 prior to a crash.
Interestingly, that advanced started from a low 1 year earlier in October 1960 just as this advance
Started from a low 1 year earlier in October 2023.
October, the turn to the Otherside.
On Turnaround Tuesday, SMH reversed with authority from 1 2 3 Swings toward a test of its July all-time high.
In so doing it knifed below the two prior peaks in its rebound off the August 5th low.
While it held its 20 day moving average, downside follow thru opens the door to the 50 day line at 239 and a Bottoms Line connecting the August and September lows which comes in at the 230 region near the 200 day moving average.
A daily SPX shows what may be a Pivot for the Ages.
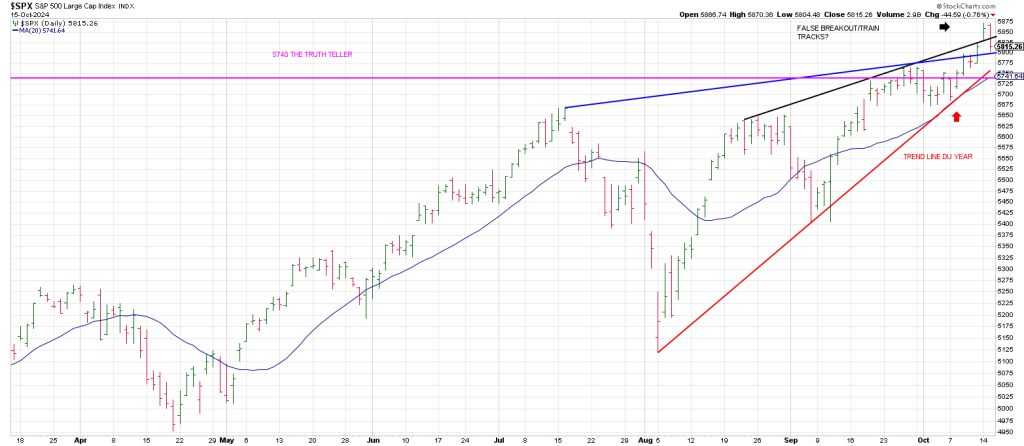
From the April 14th shake out below the 50 day moving average. The SPX exploded 550 points or 11% in 90 days/degrees into the July top.
The slide off the July high looked like a major top was in.
However, after 3 Drives to 5119 on August 5th (a square-out because Aug 5 is 180 degrees straight across and opposite 508 where the SPY traded pre-market that day), the SPX went on to carve out another 3 drives higher— August 26, September 26 and potentially Monday, October 14th.
On Monday the SPX “broke out” of a Raising Wedge, the black Tops Line.
However on Tuesday the SPX reversed back below The Line leaving Train Tracks.
While the index held the blue Tops line from the July peak, a gap down today will leave an Island Top.
The Pivot for the Ages is 5740 with follow thru below the summer peaks at 5650 region.
Why?
- A rising trend line from the August and September lows is 5740
- The 20 day moving average is 5740 region
- The October 9th breakout occurred at 5760, the same region.
In sum breakage below the blue Tops Line validates the idea of Monday’s ‘false’ breakout
Downside follow thru below 5740 and the red Bottoms Line warrants caution.
The first mouse gets the squeeze, the second mouse gets the cheese:
The August break may be the first sell signal that squeezed shorts.
A second break from a second 3 drives higher may get the bear cheese.
Downside follow thru from here underpins the idea of the Low to High to High Cycle we have been showcasing.
From the mid-April low the SPX ran up 90 days/degree to mid-July. Another 90 days is mid-October.
My expectation since the spring has been that a Super Cycle Top, one as large as 1929 is on the table this year.
In addition to a major Jubilee Cycle of 50 years which is due to exert its downside influence—
It was 50 years from the 1932 major low to the 1982 major low.
It is 50 years from the major 1974 low to 2025, there are some amazing harmonics with the 1929-1932 down wave.
The DJIA high in 1929 was 386.
On the Square of 9 Wheel 386 squares out with October 19th.
The 1932 low was 92 years ago.
On the Square of 9 Wheel 92 squares out with October 29th, the day of the Great Crash in 1929.
The greatest risk is the risk is the risk you don’t see.
Caution is warranted.

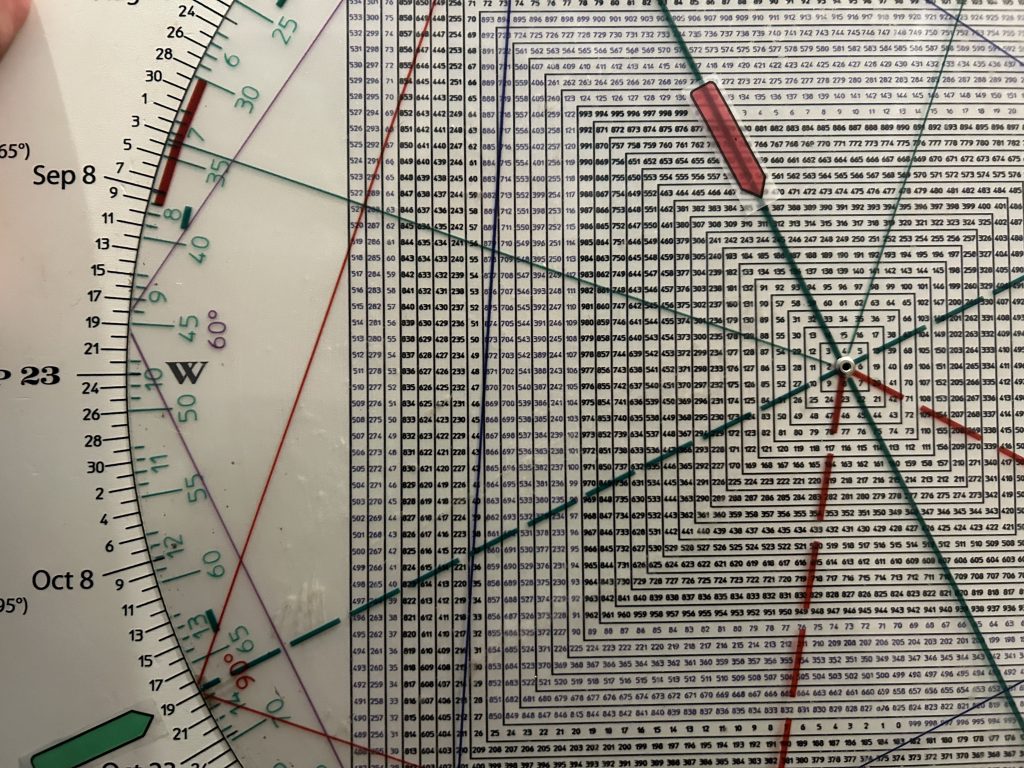
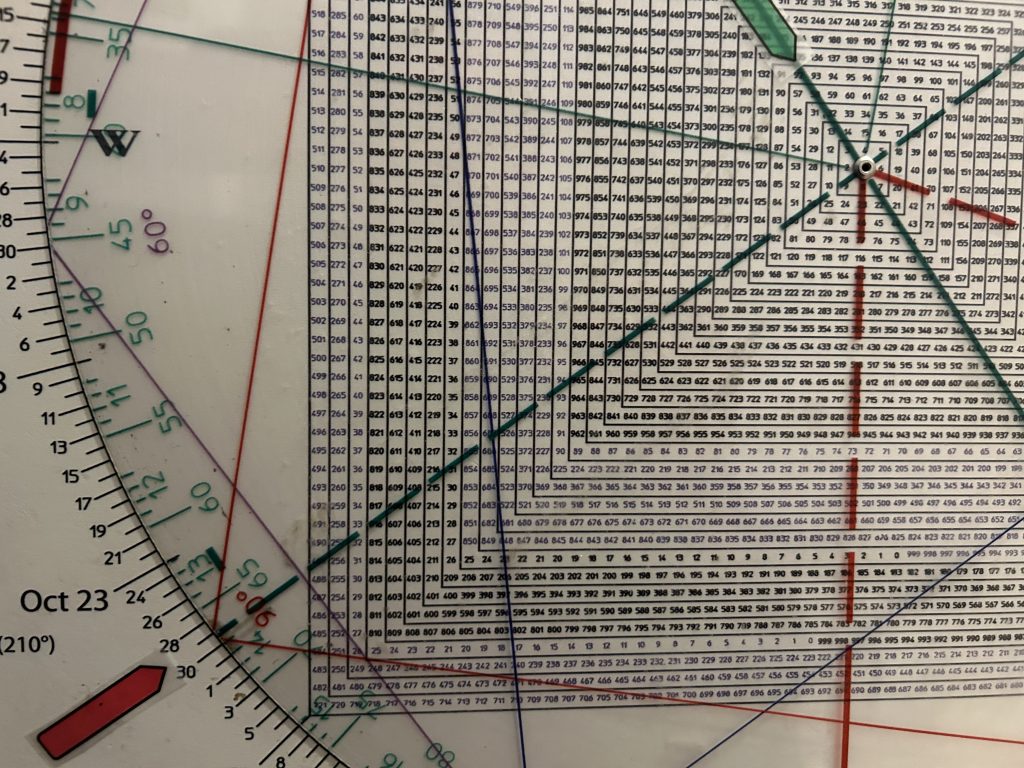
Square of 9 Wheel
Purchase your own Square of 9 Wheel. Shipping to US only. Contact Jeff for shipping outside the US.