On Wednesday the Fed is going to cut rates with stocks and home prices at the highest levels in history.
Are we missing something?
Yesterday’s report showed the analogue to 2007.
On September 18th, 2007 the Fed also cut interest rates.
It was the first cut since June 2003.
On Wednesday the Fed is poised to cut rates for the first time in 4 years as well.
Of course that was in March 2020 in response to Covid.
In September 2007 the Great Recession was rumbling under the surface.
The Big Short was on deck.
The presumption is that “big shorts”/smart money got squeezed with the Fed cut of 50 basis points in 2007.
As well the “big longs” likely thought the Fed’s cut would foam the runway leading to a soft landing.
In sum, the market exploded 3% on Sept 18, 2007.
Today that would be the equivalent of 170 SPX points.
September 2018th 2007 kick-started a rally that was 16 trading days to an all-time closing high on October 9th.
On October 11th, the SPX left a large range Key Reversal Day from a high of 1576.
Hit and Run had forecast the price and turn.
It was a Time/Price square-out as 1576 squares the first week of October.
Moreover it was a mirror image of the early October 2002 low flagged in this space when there was a Time/Price square-out at the 768 low.
Notice how 1576 is 6 revs or squares up from 768.
Amazing.
I don’t think the backdrop is the same today as 2007 with shorts loaded for bear reading the subprime mortgage writing on the wall.
So I’m not sure if there is a squeeze that it can extend as long or as high as in 2007.
Be that as it may, the 16 day final fling in 2007 mirrors the last ditch rally in 1929.
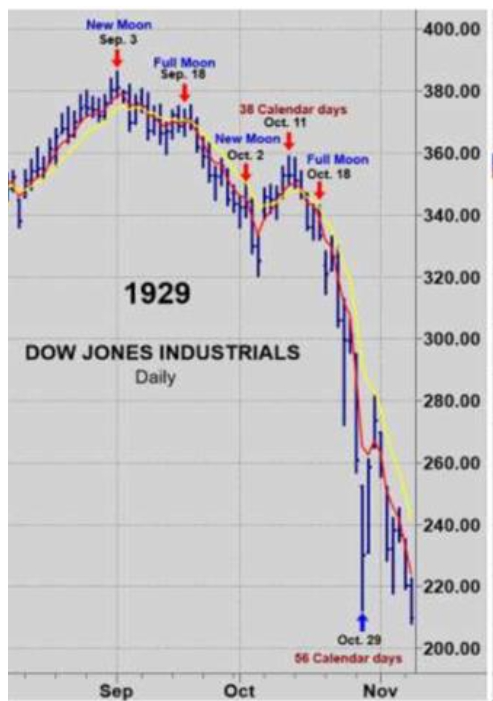
Last Wednesday markets had a shake-out. If we add an idealized 16 trading days to last Wednesday’s September 11th low we get the October 1st time frame.
This is a general guide and is not meant to be a precise road map.
As noted yesterday, any sell signal from this juncture that sees follow thru warrants caution—especially if validated by 5 impulsive waves down.
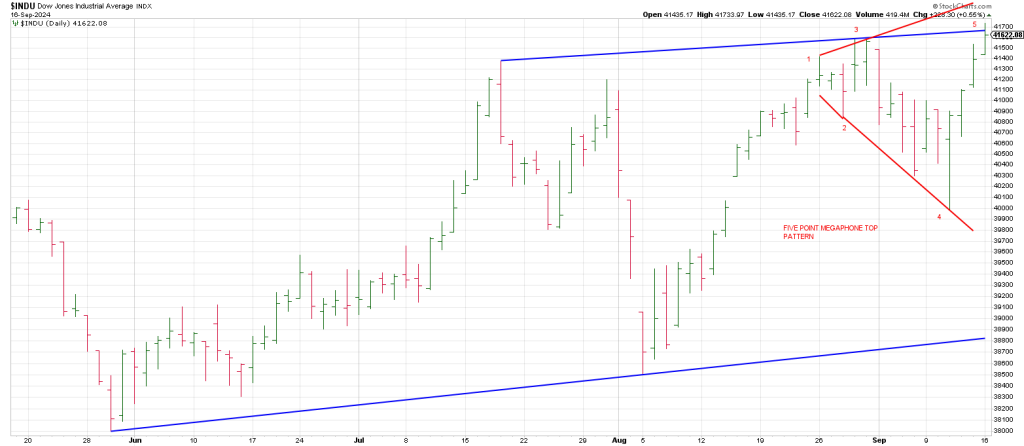
A daily DJIA shows a mini Megaphone Top has been satisfied at Monday’s all-time high
Checking an SPX from the Oct 2023 low shows the index is at The Pivot.
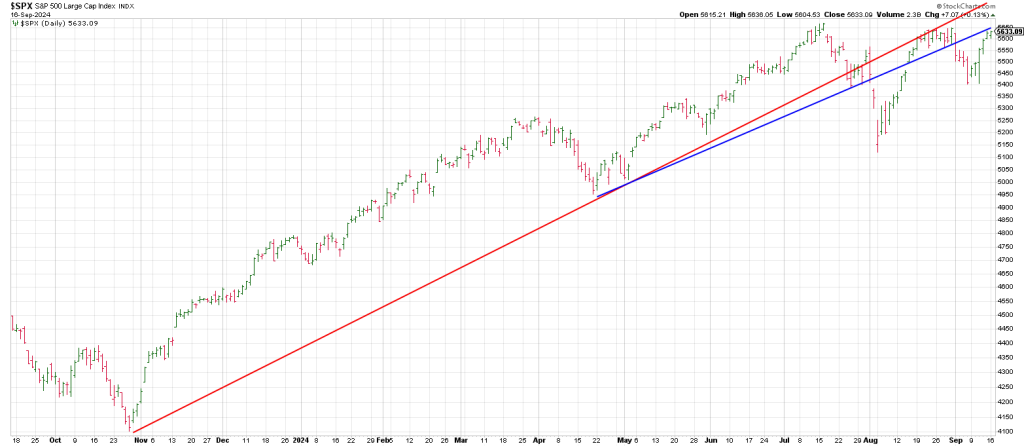
The Pivot is a backtest of a trend line connecting the April 2024 low and the July 25th 2024 low (blue).
That trend line was snapped in the early August Flash Crash.
The current rally is backtesting the broken trend line.
However a larger Pivot may be on the table on a backtest of a trend line connecting the Oct 2023 low with the April 2024 low.
That implies a push to the 5730/40 region. A nominal new high.
I connected the March 2024 high and the July 2024 high and paralleled a line off the October 2023 low.
The August 2024 plunge kisses the bottom of this trend channel.

Clear cut support is at the bottom of this trend channel currently residing at the 5300 region.
Breakage below 5300 indicates a major top is on the table.
One reason I believe a major top is destined for 2024 is the Time Factor.
From 1929 to 1987 is 58 years.
While the market recovered quickly in 1987, in truth an A B C corrective phase into October 1990 played out.
From the secular bull market peak in 1966 + 58 years is 2024.
While 1987 proved to be a market event versus an economic event like 1929 with the market marching back from the 1987 low in short order, the Principle of Alternation suggests this 58 year period from the last secular bull top in 1966 will not be limited to a market event—
Just as the financial landscape today is a mirror image of 1929.
Then the U.S. was the largest creditor nation on the planet. Now we are the largest debtor nation on earth.
Then the U.S. dollar was good as gold. Not so much today.
In sum, following two NR 7 Days (the narrowest range in 7 days) the SPX is coiled at resistance or poised to pop to a new all time high.
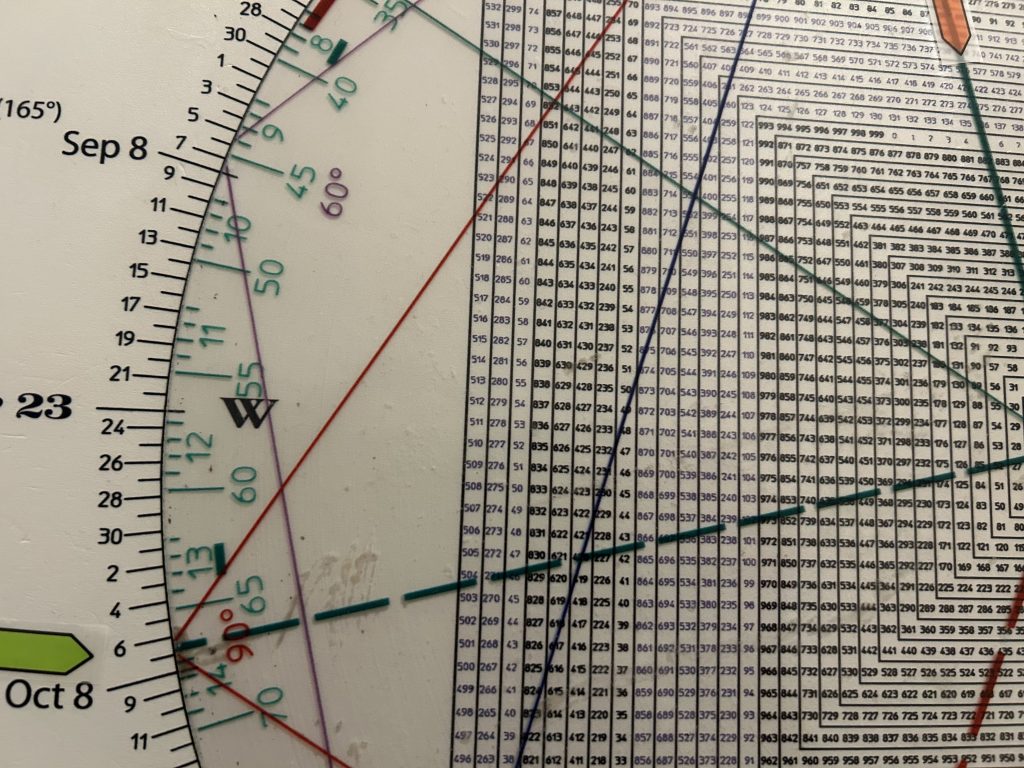
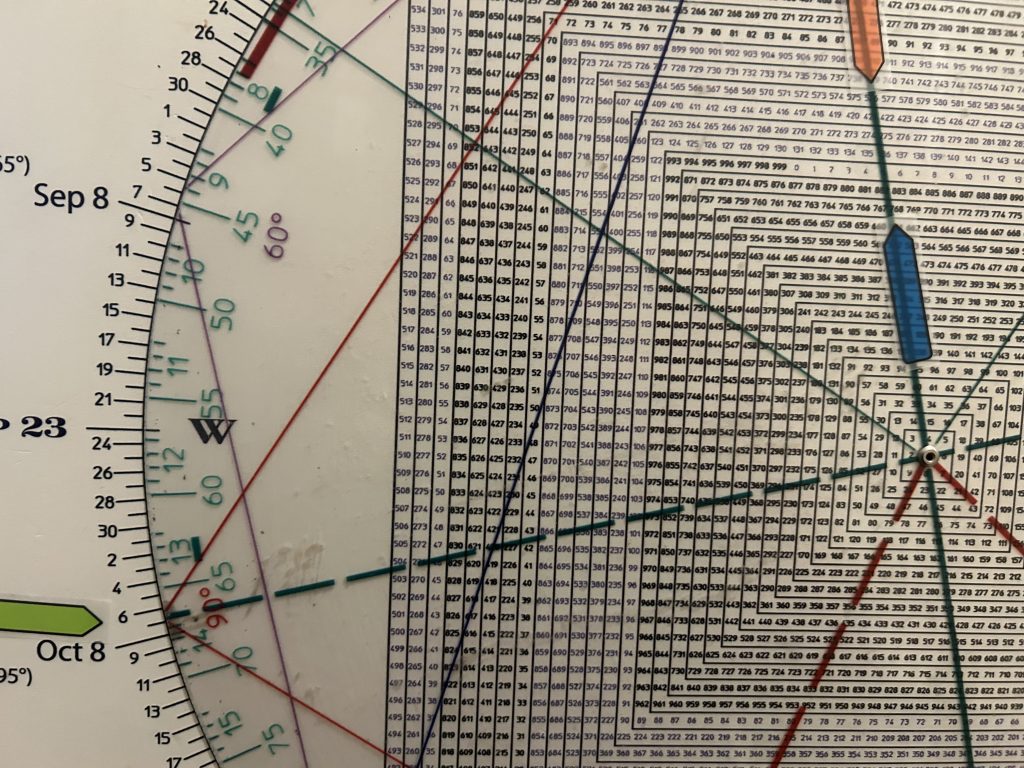
The Square of 9 Wheel indicates a square-out at 5730 walked through in yesterday’s report.

Square of 9 Wheel
Purchase your own Square of 9 Wheel. Shipping to US only. Contact Jeff for shipping outside the US.