“A fire broke out backstage in a theatre. The clown came out to warn the public; they thought it was a joke and applauded. He repeated it; the acclaim was even greater. I think that’s just how the world will come to an end: to general applause from wits who believe it’s a joke.” Soren Kierkegaard
“People are crazy and times are strange
I’m locked in tight, I’m out of range.” Things Have Changed, Bob Dylan
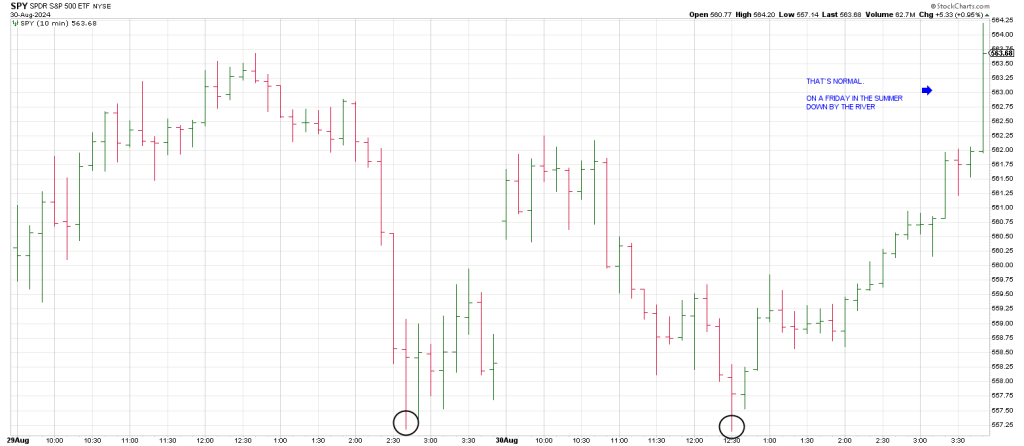
Friday’s in the summer “they” can do anything they want with the market in the last hour—even more so into a holiday weekend when the tape is thinner than most summer Friday’s.
And so they did.
The last trading day of August was a fractal for the entire month: a trap door and a surge.
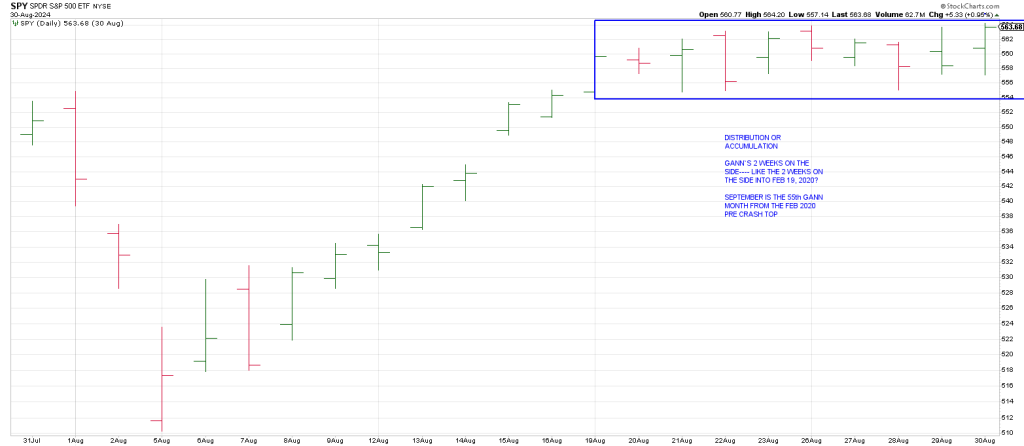
The SPY has gone sideways for 2 weeks.
Is it Gann’s “2 weeks on the side” of distribution or accumulation?
A similar pattern was traced out into the Feb 19, 2020 pre-crash top that followed a Primary High a month earlier. Sound familiar? This week should tell the tale of the tape.
As offered above, Friday was a fractal for the entire month: August started with a shake-out that pulled the rubber band back for a launch back to all-time highs.
Friday saw an early shake-out that undercut Thursday’s lows and a reversal higher.
On Friday, the SPY triggered a down ORB, an Opening Range Break thru the 1st half hour low, followed by a Jump The Creek sell—an offset of Friday’s up-gap.
Like the early August shake-out, Friday morning’s selling put the put the hook in and pulled the rubber band back for a surge.
Once the open gap was reclaimed the fuse was lit for a surge into the bell.
As we wrote in Friday morning’s Hit and Run Report, “The ‘Roadmap’ calls for a trend day to the topside.”
However all trading is contextual and Friday’s late spike has the whiff of polishing the tape for month-end. As pinged on the Hit and Run Private Twitter Feed, “is there any ‘natural’ buying and selling anymore or is it just wash and rinse—squeezing the longs and squeezing the shorts..
That’s the story of the month, the last 8 trading days and Friday.
While the DJIA closed at a record high on Friday it was the third kiss of the top of a trend channel since March.
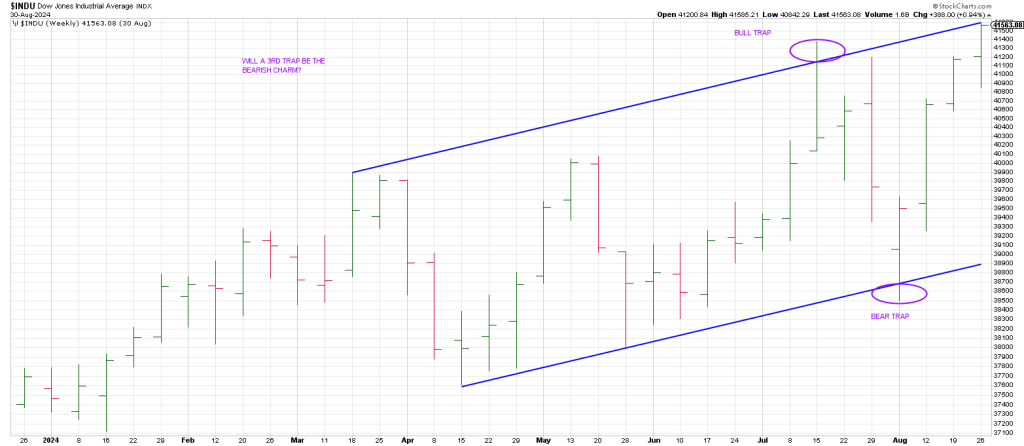
Notice the 3 kisses at the bottom rail of the trend channel.
But risk off prevails through the lens of the QQQ.
The Q’s remain waterlogged at the 50 day line following a Lightning Rod (LROD) or Large Range Outside Down Day on August 22nd which may have put the finishing touches on a Droop Right Shoulder of a Head and Shoulders Top.
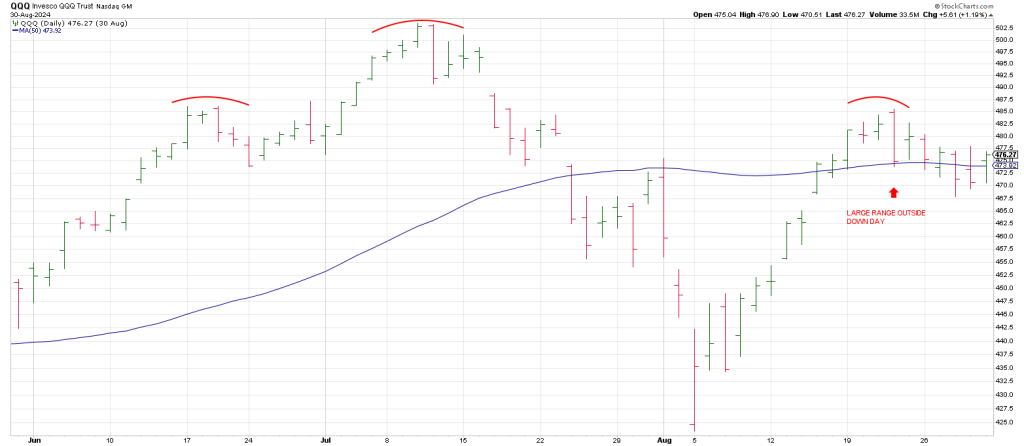
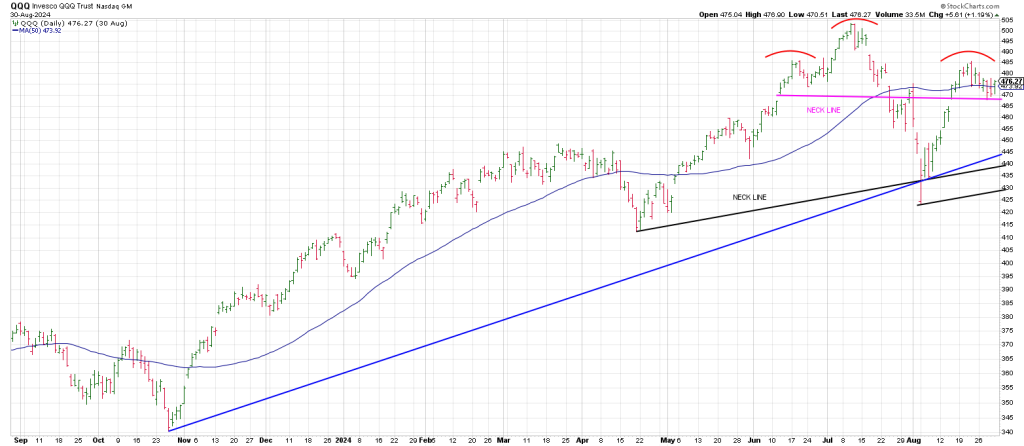
Notice the shorter term Neck Line (magenta) in the 470 region.
Breakage is likely to open the door to the larger Neck Line in the 440/445 region.
The Q’s 3 Day Chart turned down last Wednesday and remains pointing down despite Friday’s late rally.
Ditto the Q’s 3 Week Chart.
The QQQ 3 Week Chart is in the -1/+2 sell position.
This is because it turned its 3 Week Chart down on the week of July 29th (Minus 1) and subsequently carved out 2 consecutive weekly higher highs (Plus 2)
The 3 Week Chart turned down at 455.62. This is likely to be an important inflection point when the Q’s pullback. If this 455 region succumbs it opens the door lower.
Notably, this 455 region ties closely to the high of the low bar week—the up-thrust the week of August 5th.
Zooming out on the weekly Q’s using a Bottoms Line connecting the October 2023 low and the April 2024 low shows that the stab down in early August was quickly regained.
However a second drop below this same trend line (455 ish) warrants caution.
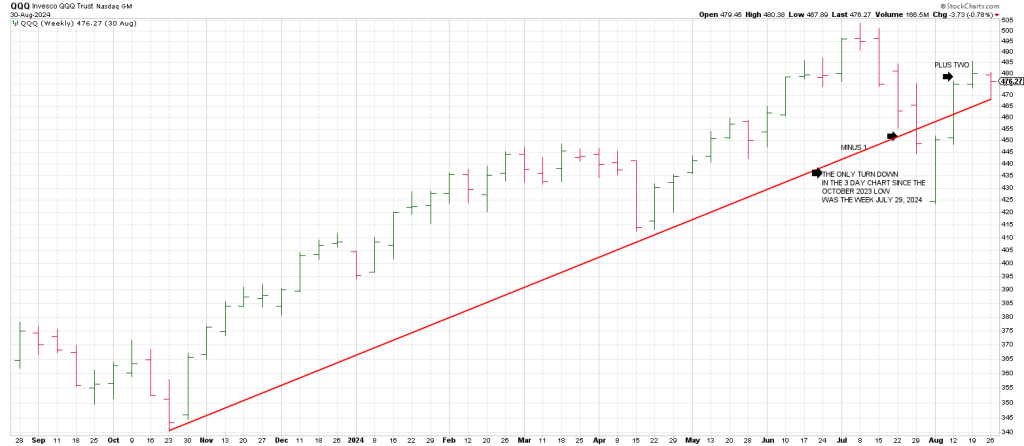
This “Ghost Line” currently resides at 463 and ties to the 20 week moving average.
A second break suggests the second mouse will get the cheese for the bears.
The Katy Bar (Katy Bar the Door) blaring sell siren on QQQ is the Neck Line at the 430 region this week.
This ties to the 50 week moving average.
Downside follow thru after breakage below the aforesaid 463- 455 region opens the door to 430.
Today is the anniversary of the 1929 high.
W.D. Gann put a lot of emphasis on anniversary days/weeks.
This is especially important when The Cycle squares out with price.
“It is very important to watch the date when an individual commodity makes extreme high or low.”
The meaning behind this statement is the solar return. The sun is unique amongst the planets in that it completes one revolution of the zodiac every year. On any given day of the year the sun is in exactly the same position (in the zodiac) as it was on that day one year earlier, ten years earlier or a century earlier.” W.D Gann
Consequently the sun will aspect a particular point on the zodiac on the same day every year.
The trick is to look for geometric divisions of the anniversary either 3 months or 6 months from the anniversary going forwards and backwards.
This year the SPX struck a high on the same time frame as it did at the last bear market Primary High in 2007. The market hit an air-pocket into August and rallied to make a nominal new high on October 11th, 2007.
It proved to be a picture perfect Time/Price square-out.
The 1576 Oct 11, 2007 high squared out with October 11 and pointed to mid-July the date of the Primary High that year.
How does the geometry look currently? This week squares out with 568/569. The all-time SPX high is 5669 (567).
One more good rally day puts us in the Wheelhouse.
Gann stated, “We use the square of odd and even numbers to get not only the proof of market movements, but the cause.”
Gann went on to say (to paraphrase), every important high and low are harmonics of a prior high or low.
Sometimes Time and Price do not interlock at highs but rather point to lows.
Sometimes you get both.
Allow me to explain
While there was not a Time/Price square-out at the 1929 high, the high day, September 3 is 90 degrees from the start of the start of the blow-off, May 31st, 1929.
The DJIA 386 high in 1929 squares out with October 19th when the market started to sag in earnest.
The crash saw the DJIA drop to 195 on November 13.
November 13 is opposite 195.
The 1929 crash was 1080 degrees or 3 squares of 360 degrees or 2 cubes of 540 degrees.
An equivalent drop in the SPX today equates to a Bottoms Line connecting the 2009 low and the March 2020 Covid low.
Got Geometry?
In 1987 Mr. Market accommodated with a Time/Price square-out at the top on August 25th.
August 25 is 180 degrees straight across and opposite 338, the high.
The SPX dropped to 216 on Tuesday, October 20.
This year September 3rd squares-out with another crash, the Rich Man’s Panic from May to November 1907
(mirroring the 2008 May to November crash)
The top prior to the Rich Man’s Panic occurred in January 1906 which is 118 years ago.
118 squares out with September 3.
The 1907 low of 53 (pink) in November (green) square-out.
Amazing.
In sum the market may have struck a secondary closing high on Friday….a Secondary High to the July 16th high.
July 16th vibrates/points to 560 (5600)
The SPX has been trading essentially sideways at this 5600 region for two weeks.
Whether this is what Gann called “two weeks on the side” of distribution or a high level consolidation before higher we should know this week.
The market set a Bear Trap in early August and my expectation is it sets a Bull Trap this week.
We are so close to a new high in the SPX that it would be surprising not to see one; but stranger things have happened.
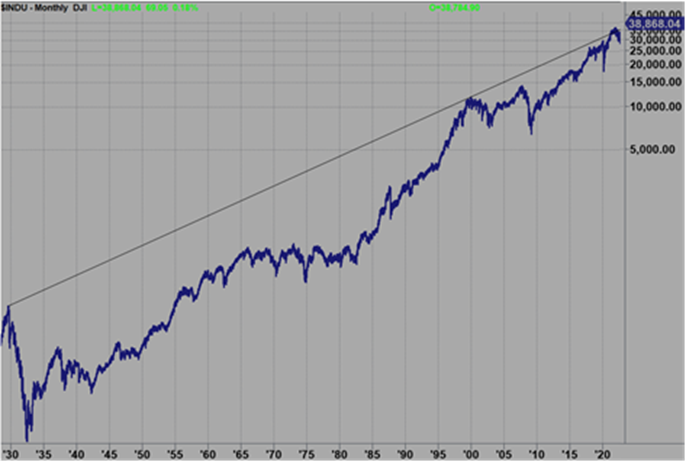
A long term chart of the DJIA from 1929 shows the DJIA has already ‘Pinocchio’d’ a 95 year trend line. Notice the lost decade the last time the trend line was tagged.
If we rally to 5680/5690 region the ensuing behavior will be critical to observe.
Not only does that level square-out with this week but it aligns with the March 2009 low of 667.
As well, early March is opposite early September.
Hence, a major Time/Price square-out with the bear market low in 2009 may be on the table.
I have been saying for months that 2024 is a key turning point as it is 15 years from the 2009 low.
15 years is 90 degrees or 1/4 of W.D. Gann’s Master 60 Year Cycle.
September 2024 is 186 months from the March ’09 low.
On my Square of 9 Wheel, 186 “points” to mid-July (which may be the Primary High).
Since today is the 95th anniversary of the Top of Tops, it is interesting that this was 1140 months ago
As 1140 is on the Cardinal Cross on the Wheel squares out with the Autumnal Equinox.
It looks like a September to remember is on deck.
Tomorrow’s Hit and Run Report will outline the path, the price and time period for a last hurrah…if this week is not a turning point.

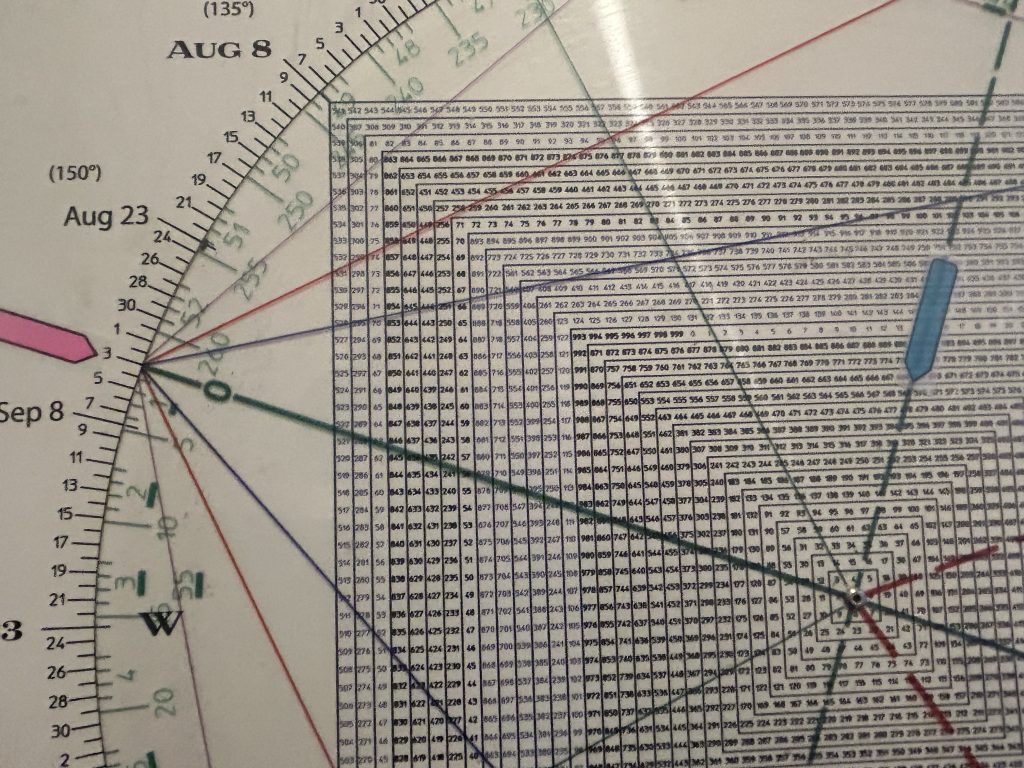
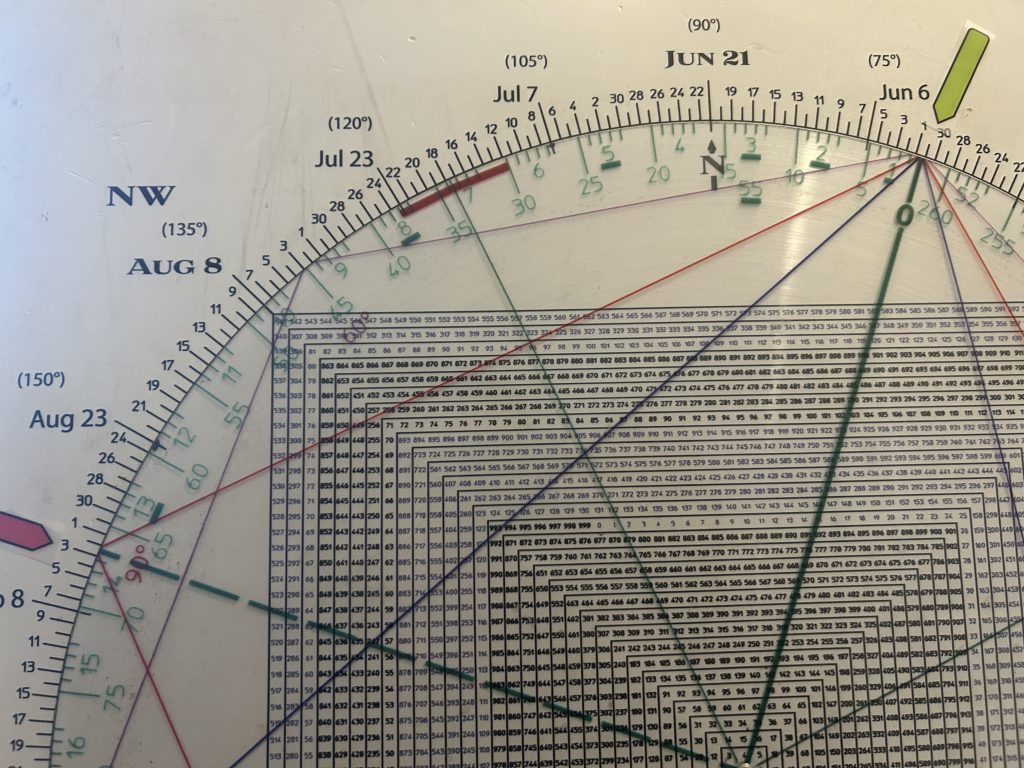
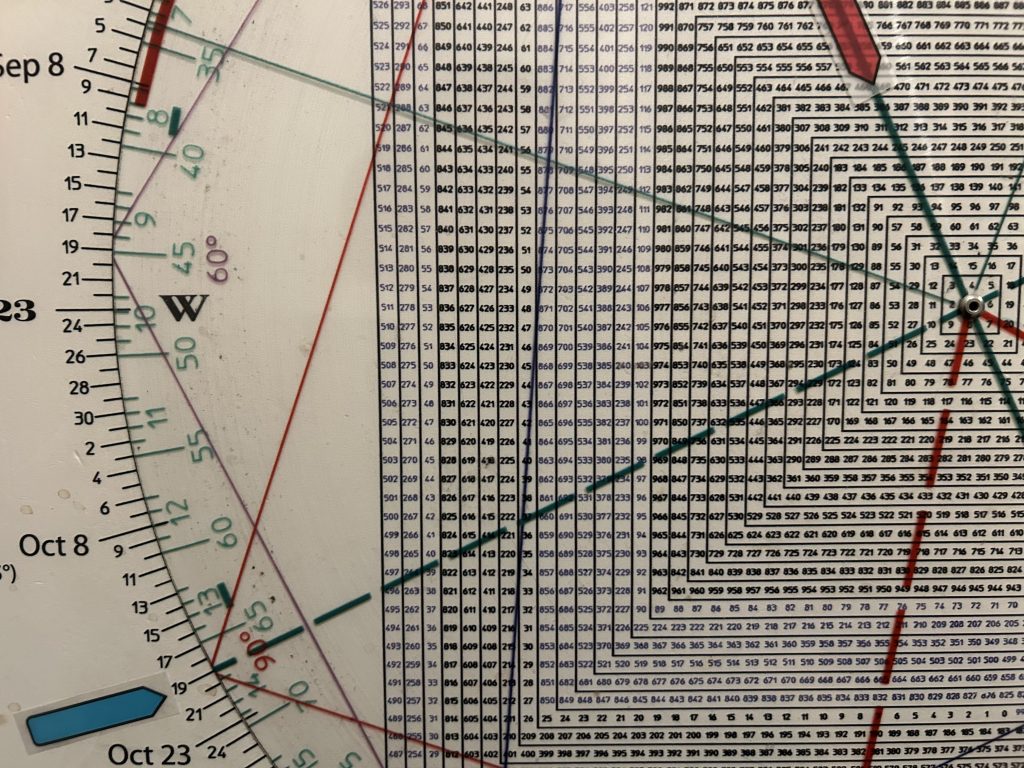
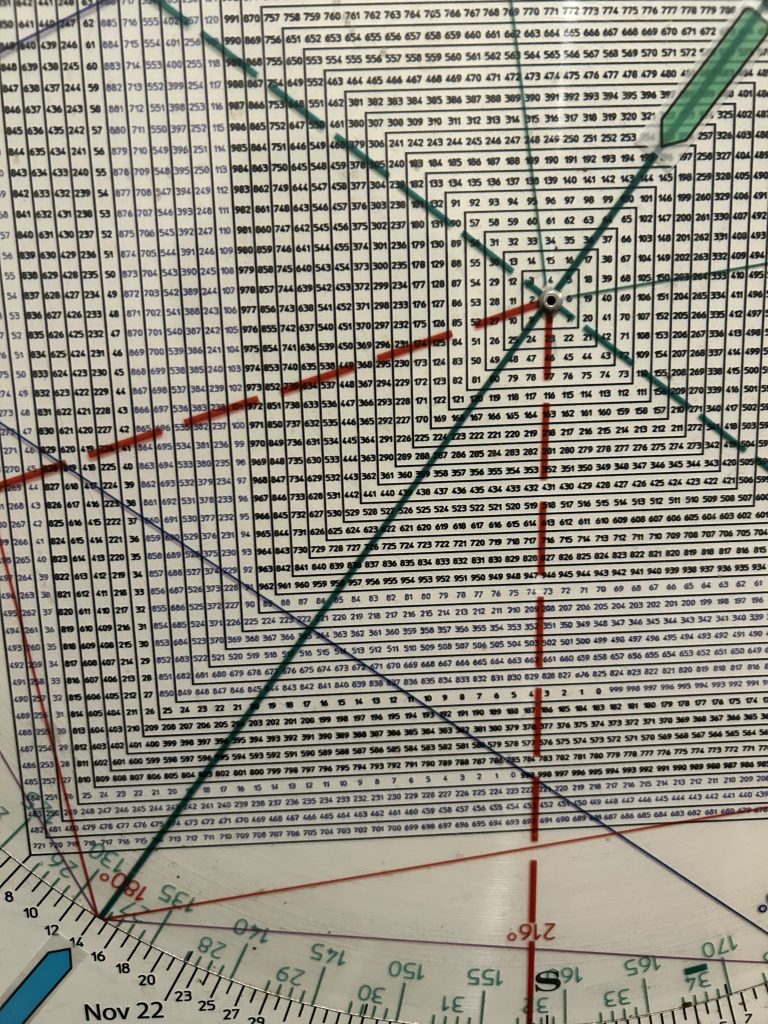
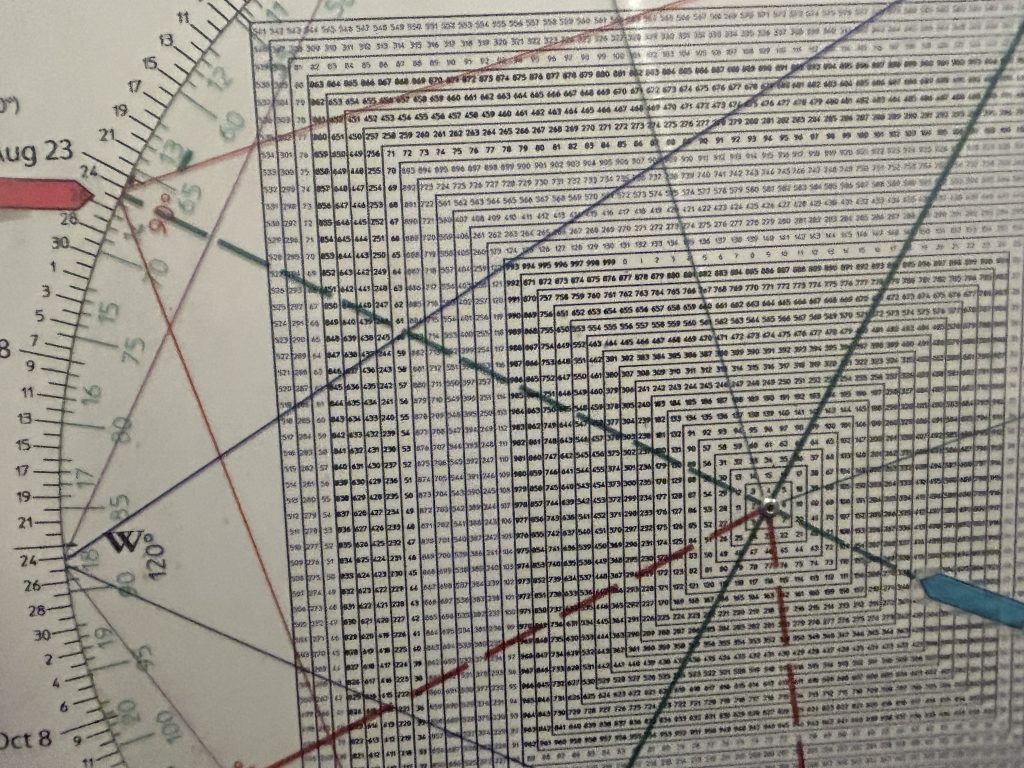
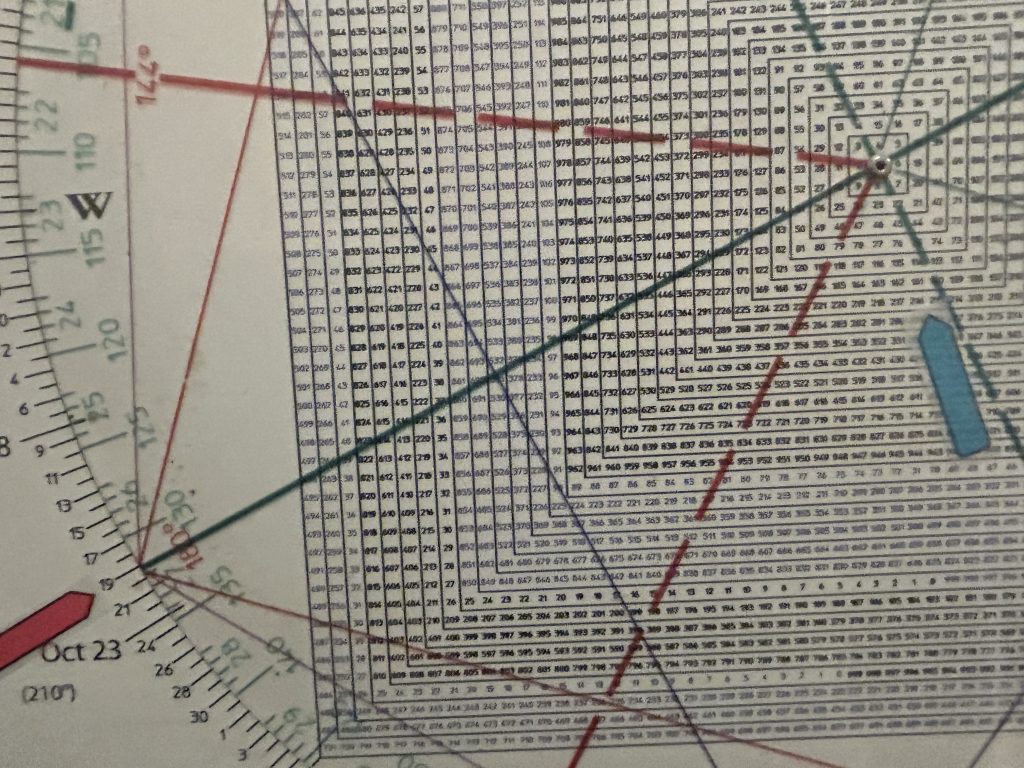
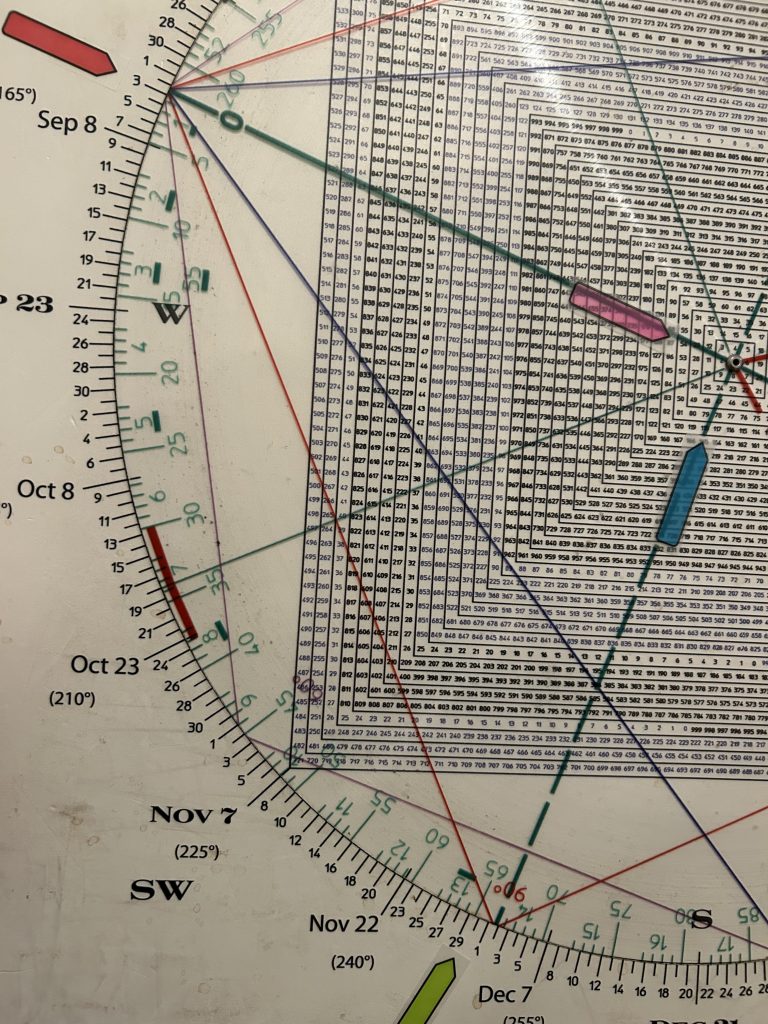
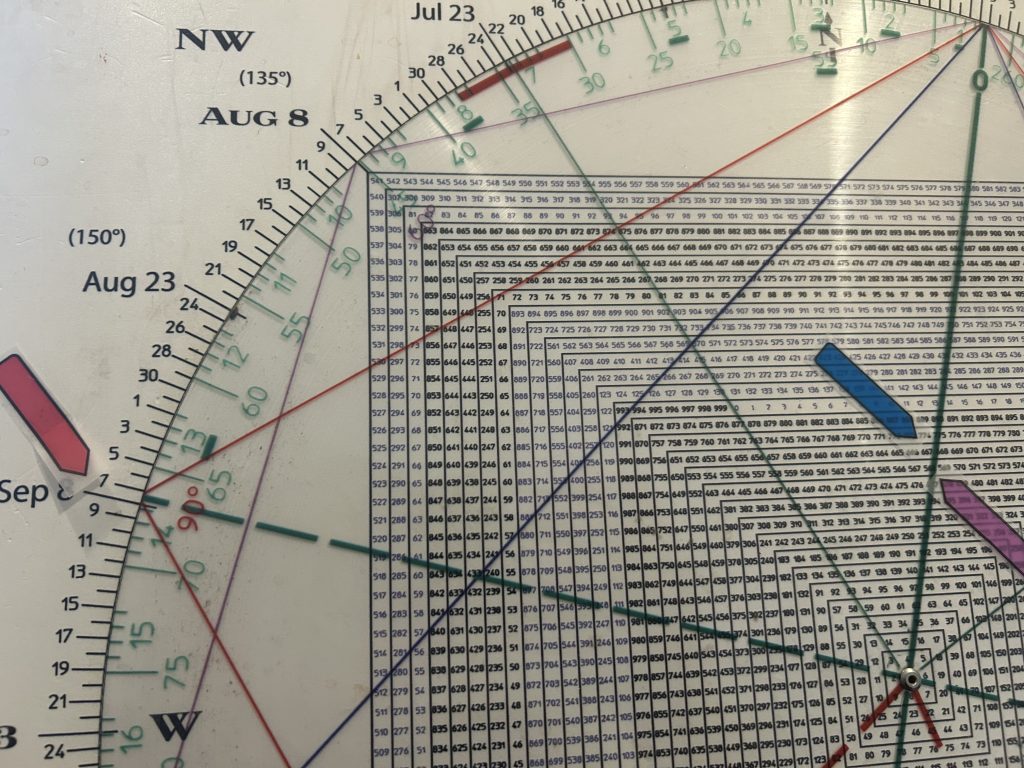
Square of 9 Wheel
Purchase your own Square of 9 Wheel. Shipping to US only. Contact Jeff for shipping outside the US.