“I never buy at the bottom and I always sell too soon.” Baron Rothschild
“Dumb money is only dumb when it listens to the smart money.” Peter Lynch
“My brain is flaming
I don’t which way to go.” Burning Love, Elvis Presley
Someone smart once told me smart money does not buy bottoms, for they are too smart.
The smart players wait in the wings of the theater for the scene to end (exhaustion of the sellers) and then they take the stage.
Two days after the August 2/ 5th Flash Crash, the SPX nose-dived again leaving a large range outside down day (Lightning Rod/LROD).
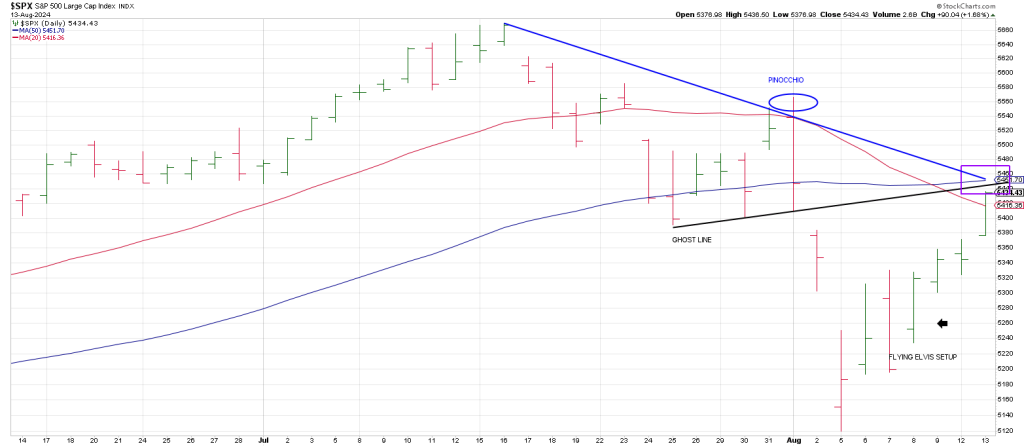
If the market was going to play out like the Covid Crash we would have followed thru to the downside. Instead the SPX gaped up and closed near session highs the next day, August 8th.
I thought there was an outside chance of what I call a Flying Elvis buy setup on the table.
This is a strategy I developed that looks like the market is rolling over and failing after an initial bounce off a flush-out.
But instead of following thru to the downside the market gaps up, closing strongly and follows thru.
I call it a Flying Elvis after the scene from Honeymoon in Vegas where Nick Cage finds himself unknowingly jumping with a skydiving group called the Flying Elvis’s.

The market goes into free fall (August 7th) and looks like it will crash but then the ripcord is pulled and the chute opens lurching the market higher (August 8th).
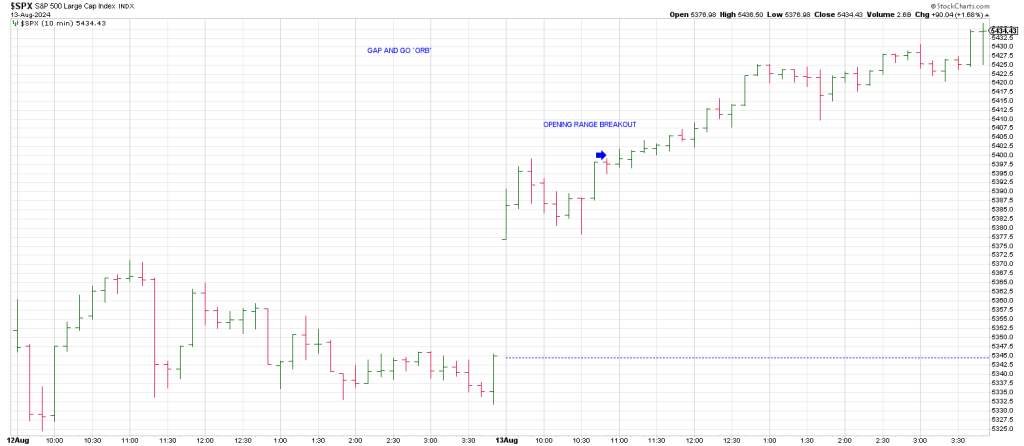
The SPX caught it’s breath with a ‘throwaway’ day on Friday, August 9th, but Monday the index extended and yesterday was a Gap & Go explosion above the 20 day moving average with the SPX scoring a 90 point gainer.
Is the rally foolproof? Was August 5th a flush-out low with the leveraged longs getting blown-out?
If so, did Tuesday blow-out the leveraged shorts?
What is the position of the market.
The above daily shows the SPX is backtesting pivotal resistance:
- We are testing the Ghost Line (an extended trend line once it seems irrelevant) taken from the triple bottom break on August 2nd.
- The SPX is also testing a Tops Line from the all-time high which ties to the 50 day moving average.
- The SPX 3 Day Chart turned up on Tuesday. If the trend is down this turn up will define a high soon in terms of both time and price.
Clearly the SPX is stretched and entitled to a pullback no matter how bullish you want to be.
50% of the range from the all-time high to the August 5th low is 5394.
360 degrees up from the 5119 low is 5409.
Consequently, we have a tight band that ‘should’ act as support…at least the first time down.
The behavior of the market on a presumed pullback to this region will tell us a lot about the complexion of the market.
Breakage below this 5394-5409 band opens the door lower.
An hourly SPX also shows the market is testing hourly resistance
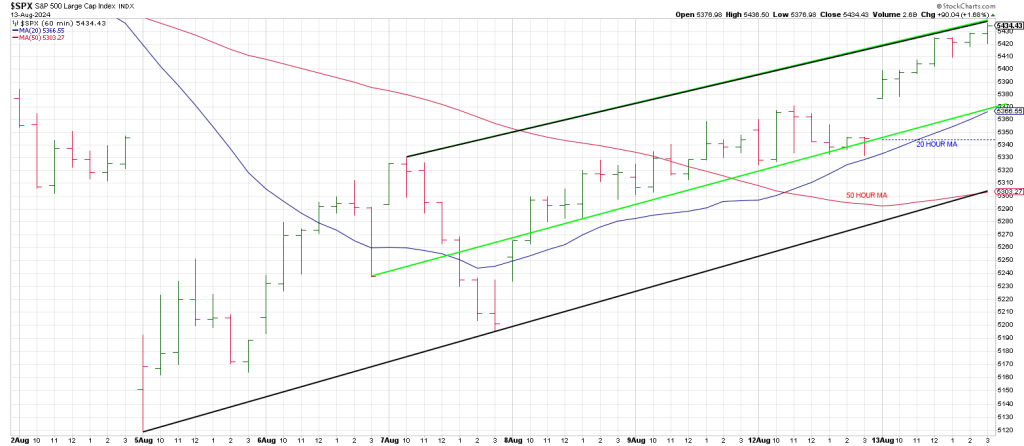
Notice how a mid-channel line ties to the 20 hour ma currently at 5377 while the bottom of the channel ties to the 50 hour ma currently at 5303.
NVDA led the way up on Tuesday with its breakout over a Tops Line from the all-time high.
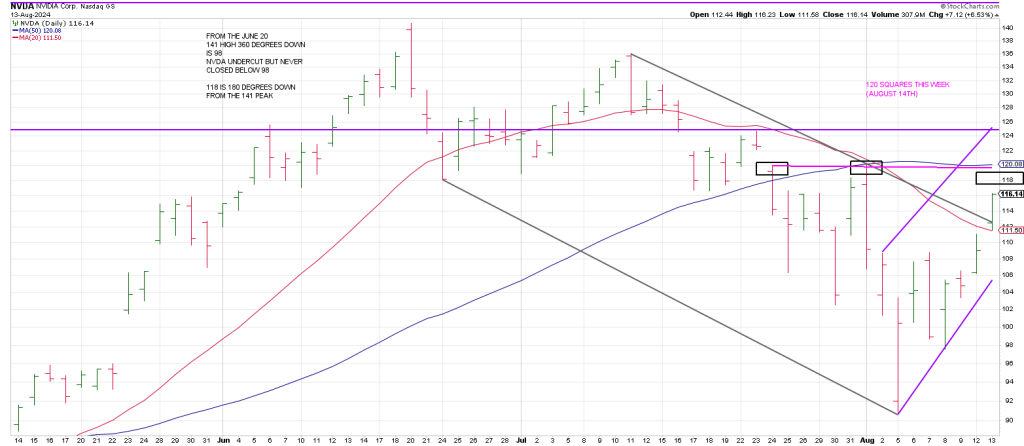
Notice how Tuesday’s interim breakout is also the top of a trend channel (black).
360 degrees down from the June 20th high of 141 is 98.
On the low day, August 5th, NVDA undercut but never closed below 98.
180 degrees down from 141 is 118.
This ties to the 50 day moving average.
NVDA is on track to tag 118. It could easily Pinocchio 118 and tag the 120 strike.
Why?
Because 120 squares out with August 14th (this week).
This ties to the 50 day MA.
Notice how the prior pivot highs tie to this 118 -120 square-out.
June 20th was the record high. June 20th squares out with 127 and the horizontal resistance band.
We do this for a living.

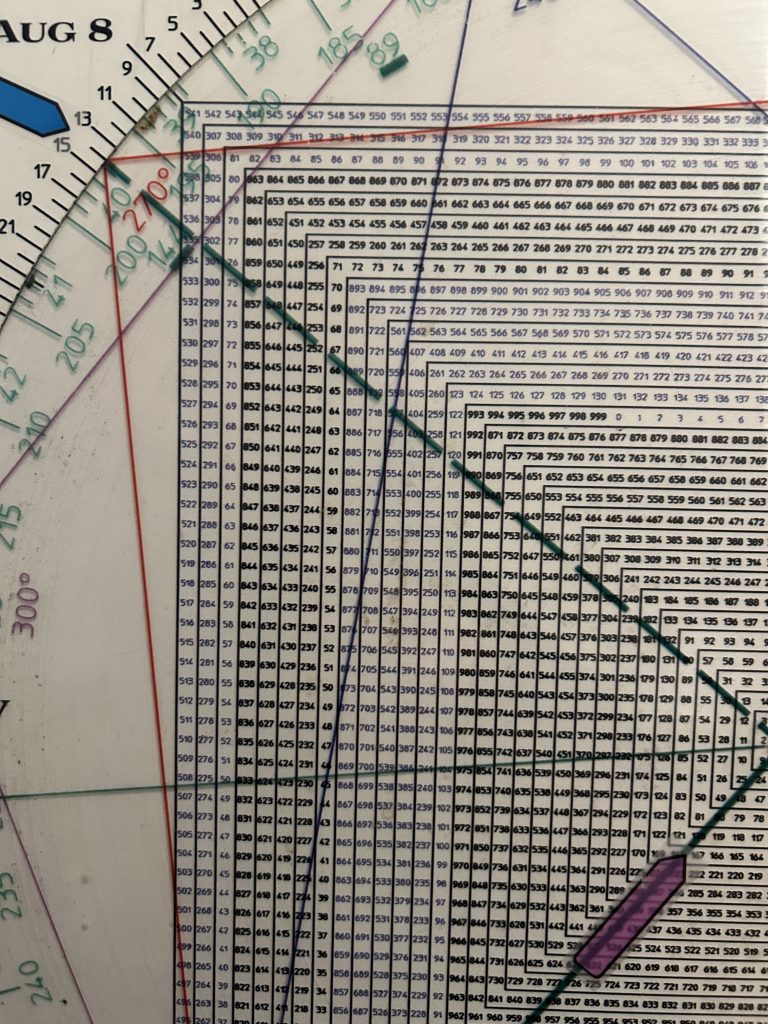
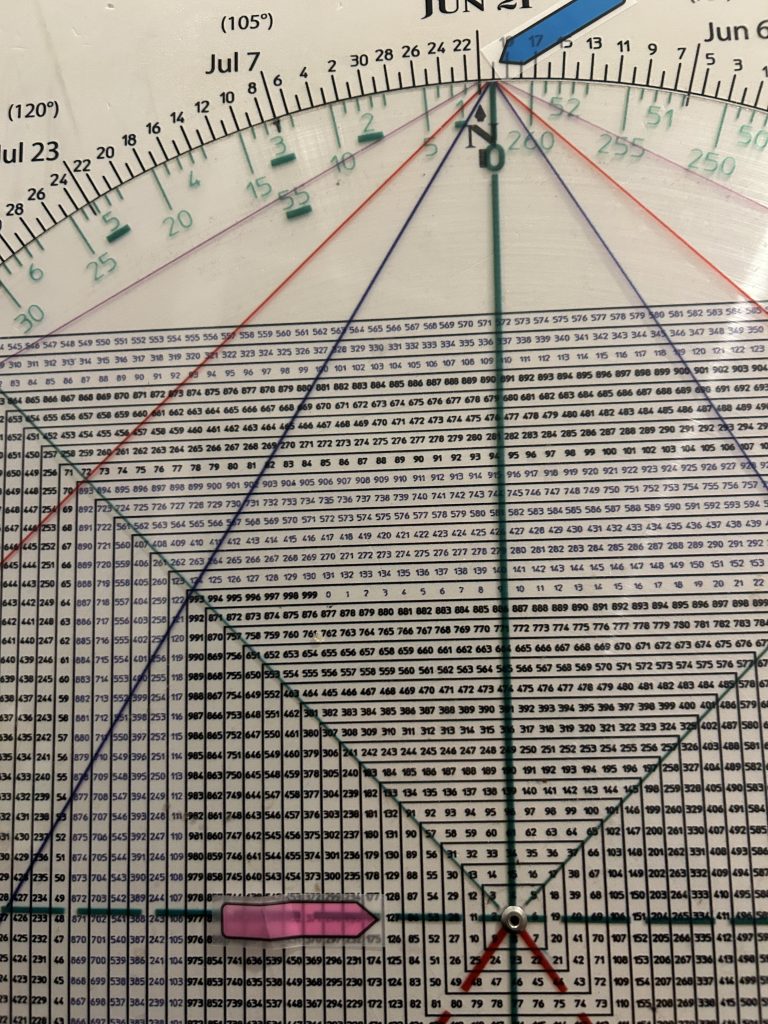
Square of 9 Wheel
Purchase your own Square of 9 Wheel. Shipping to US only. Contact Jeff for shipping outside the US.