“And though I hoped for, something to find
I could see no maze to unwind.” Conquistador, Procol Harum
“Madame Sosostris, famous clairvoyante,
Had a bad cold, nevertheless
Is known to be the wisest woman in Europe,
With a wicked pack of cards. Here, said she,
Is your card, the drowned Phoenician Sailor,
(Those are pearls that were his eyes, Look!)
The lady of situations,
Here is the man with three staves, and here the Wheel…” The Waste Land, T.S. Eliot
To mangle what T.S. Eliot said, in markets, August, not April is the cruelest month…be it the wrecking ball or the prelude to it.
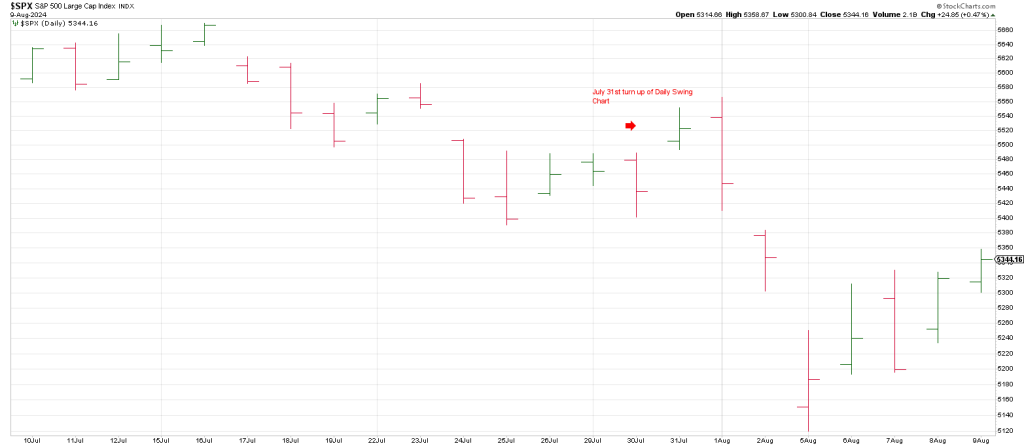
“When the SPY Daily Swing Chart does turn it is likely to be a defining moment. The presumption is it will tie soon in terms of time and price to the top of this Wave 2 consolidation before a dramatic Wave 3 decline plays out. The potential for a Flash Crash exists based on the accelerated momentum directly off the top.”
We wrote the above in the July 30th Hit and Run morning report.
The Daily Swing Chart turned up the next session, July 31st.
On Thursday, August 1st the plunge started with a Flash Crash the following Monday.
Hit and Run members were prepared.
We sold the SPY puts bought a few days earlier at 0.42 cents on Monday’s open at 14.08.
This is in addition to the August 23rd 525 Puts bought at 2.85 and banked on Monday’s open at 18.49.
Why did we lock in gains on the open when it could have been a Black Monday?
It could have been snowball from hell like 1987 and kept going:
1987 was 37 years ago and 75 squares-out with August 5th.
One of the reasons we were looking for an air pocket.
But we locked in gains on the open because 408 (SPY) is 180 degrees straight across and opposition August 5th—last Monday.
Before the open the SPY was printing 508 for a potential Time/Price square-out.
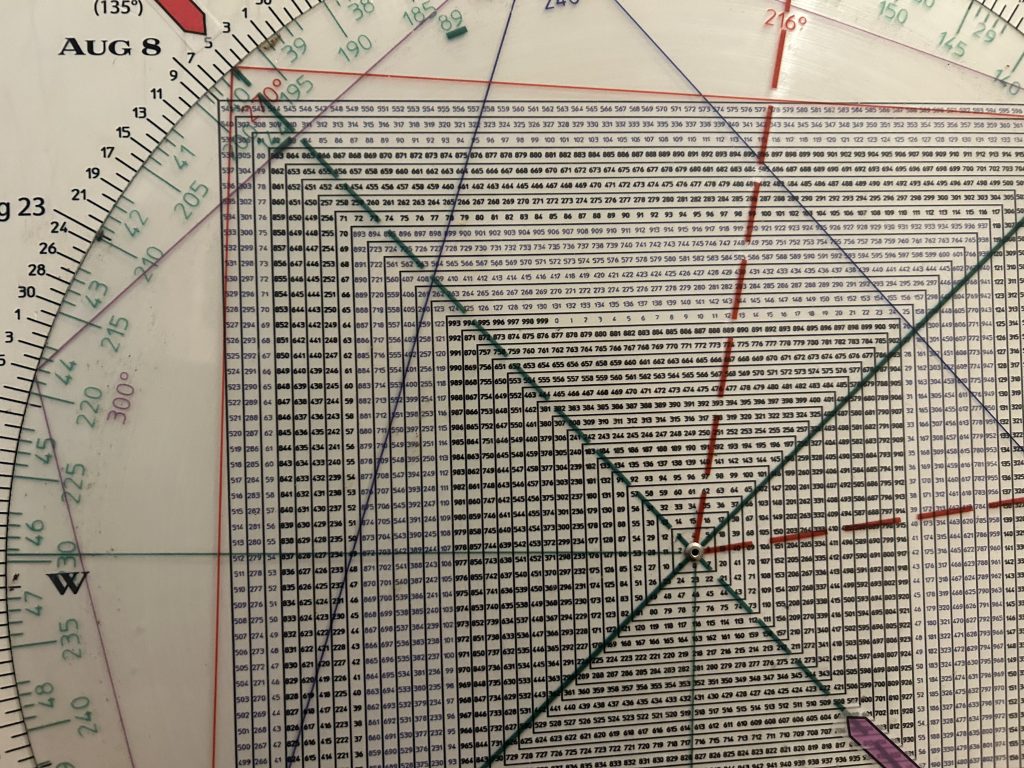

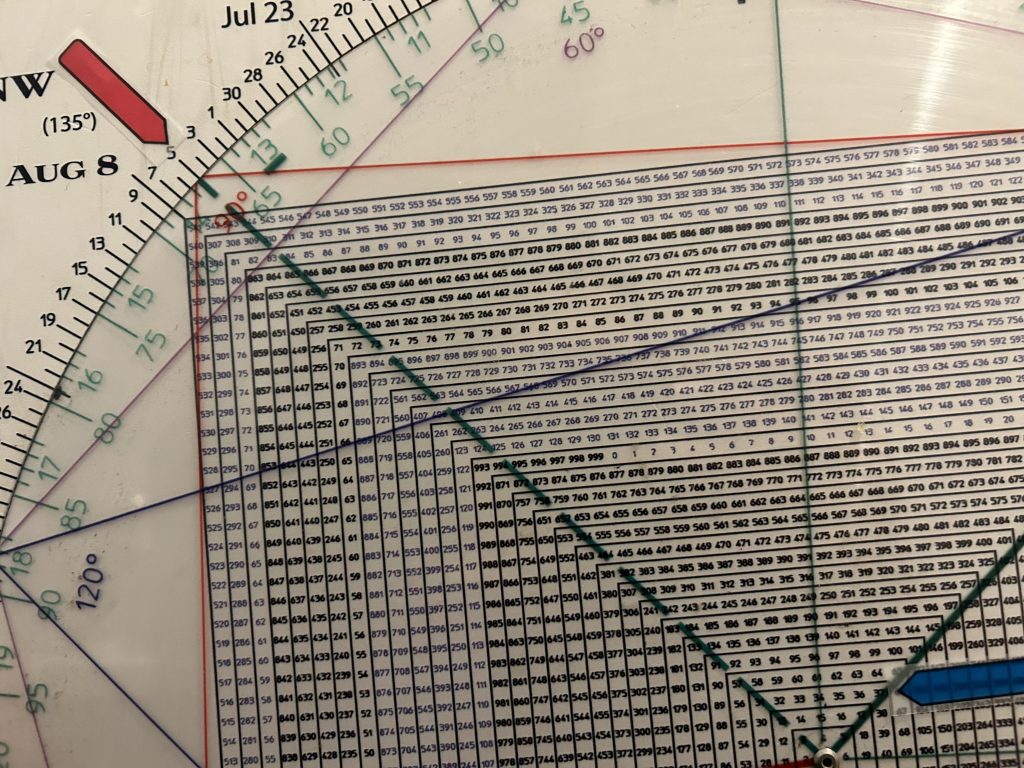
Square of 9 Wheel
Purchase your own Square of 9 Wheel. Shipping to US only. Contact Jeff for shipping outside the US.
408 SPY hit Pay Dirt. By the end of the week the SPY had rallied to 534.50.
Now the weeklies are in a similar position as to where the dailies were on July 30th when we stated that the next turn up on the dailies will be a defining moment.
The next turn up on the weeklies will be a defining moment.
For all the turbulence last week with markets nose diving on Monday, the SPX closed the week down just 0.04%.
As legendary market guru Richard Russell used to say, it’s a bearish sign when a stock index declines sharply and then claws its way back from the selloff but is unable to close in positive territory. It indicates that the index uses up a lot of buying power with no gain to show for it.
Now the index is in a position to easily turn its Weekly Swing Chart up (since it closed near the high of the week).
It will be a defining moment, soon in terms of both time and price if it does so.
In fact a failure to turn the weeklies up when it is so close has to be viewed as a bearish development.
Of course the SPX could pullback early in the week and then attempt to push above last weeks high.
Either way, the first turn up in the Weekly Swing Chart after the downside momentum off a record high will give us a lot of information about the market.
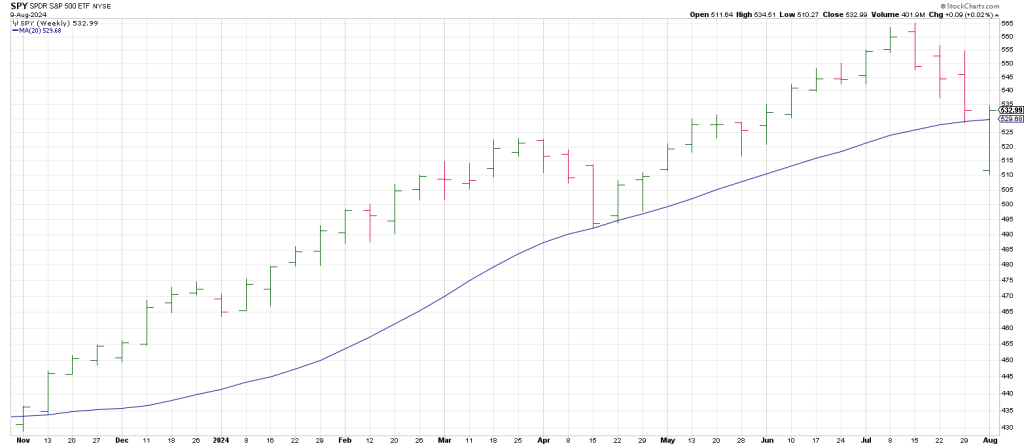
In April the SPY 20 week moving average acted as support.
After breaking the 20 week MA last week, the SPY rebounded to its 20 week MA on the close of the week and a turn up in the Weekly Swing Chart will occur on trade above last week’s 534.51 high.
Notice that the 3 Week Chart turned down in April.
While the SPY skidded lower to its 20 week ma. in April the turn down in the 3 Week Chart was the week of the low.
In contrast, the SPY 3 Week Chart turned down the week before last, the week of 7/29, and the SPY collapsed last week gaping with authority below its 20 week ma.
In sum we have 3 factors reflecting the Sign of the Bear:
- The behavior following the turn down of the 3 Week Chart…a strong extension lower.
- Breakage below the 20 week moving average.
- The Breakaway Gap following the failure of the 20 week ma to act as support and the turn down of the 3 Week Chart.
The strong likelihood is these factors are pointing the way lower.
Checking a weekly SPX indicates a new downleg opens the door to the 4800 region—the January 2022 top prior to a protracted decline.
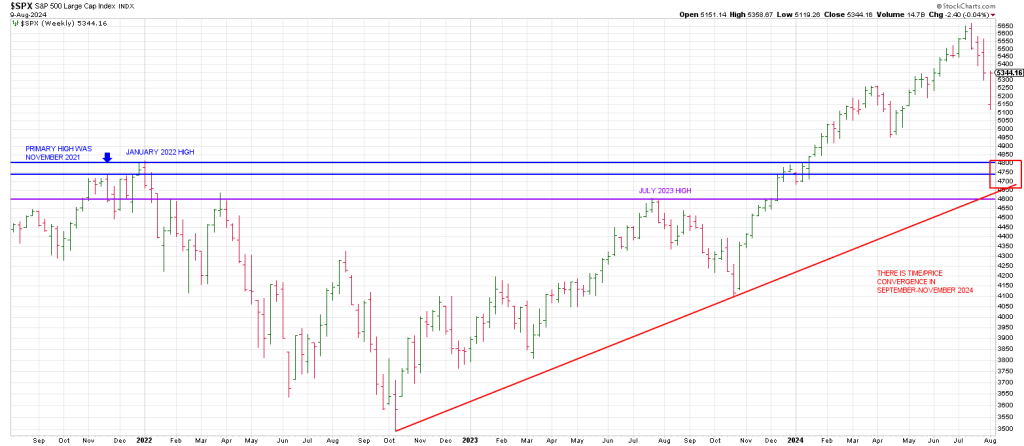
Prior resistance acts as new support.
Mr. Market has a good memory. Notice how the July 2023 high of 4607 ties to the first retrace rally in March 2022.
The 4600 region was actually backtested twice in early 2022 before the index succumbed—once at the end of January and then at the end of March.
This price band between 4800 and 4600 is likely to act as a magnet for the SPX.
As well notice that a Bottoms Line (red) connecting the October 2022 low and the October 2023 low intersects 4600 to 4800 between now and September.
Often price intersections act as timing points.
Let’s look at the Principle of Squares to see what levels are projected.
Starting from the 5670 all-time SPX high:
360 degrees down is 5373
540 degrees down (cube) is 5227.
720 degrees down is 5084.
With the SPY striking a low of 508 pre-market last Monday you can see that SPX satisfied two 360 degree price cycles down on Monday’s crash open.
1080 degrees down (2 cubes) is 4802…the January 2022 major high.
There is a window of a few days where the Square of 9 Time/Price Calculator points to the potential for a Time/Price square-out in the 4800 region which we have reserved for members.
1440 degrees down (360 X 4) is 4529.
1620 degrees (540 X 3) is 4395.
A monthly SPX shows 4395 is an interesting level.
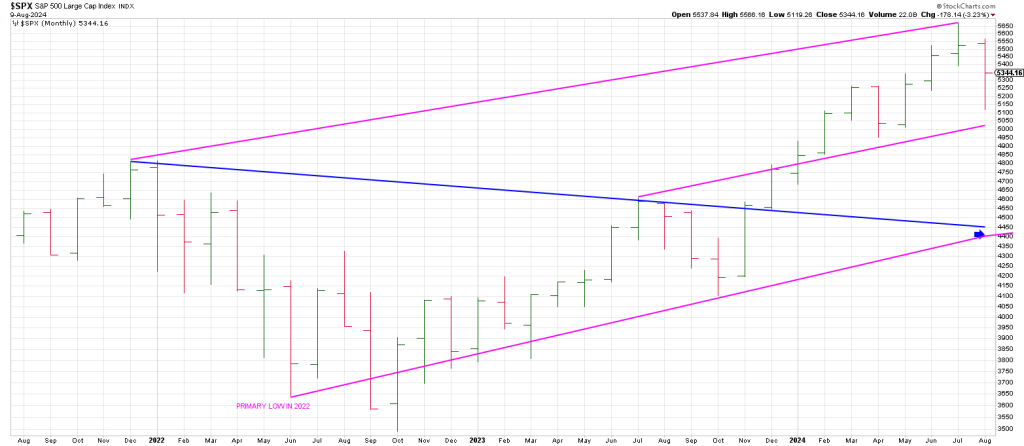
I connected the January 2022 top with the July 2024 top and paralleled a trend line off Primary low in June 2022.
Notice there is only one monthly close below the bottom rail of the channel…in September 2022.
The bottom of this channel intersects with a Ghost Line connecting the January 2022 top with the
Important July 2023 high this August/September in the 4395 region.
4395 isn’t even a complete retrace of the advance from the October 2023 low.
I say “isn’t even’ because parabolic busts typically return to the scene of the crime where the bodies are buried.
IWM is The Truth Teller and also indicates this is a big week.
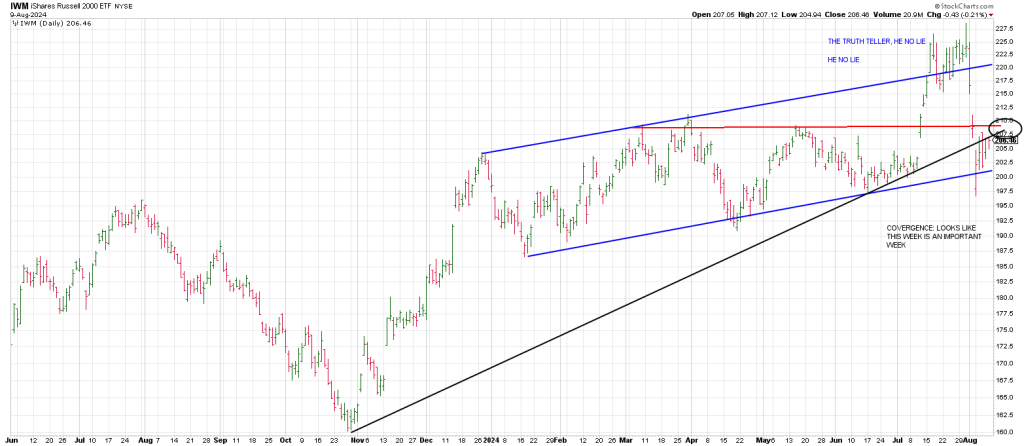
IWM broke out in July but knifed back below the breakout point last Monday dropping to the bottom of a trend channel encompassing all of 2024’s price action except for the July ‘breakout’.
The recent plunge undercut the bottom of a Bottoms Line from last November with IWM backtesting the Bottoms line the balance of last week.
Pulling back the lens to the beginning of this century shows the advance into November 2021 is consistent with a major 5th Wave top.
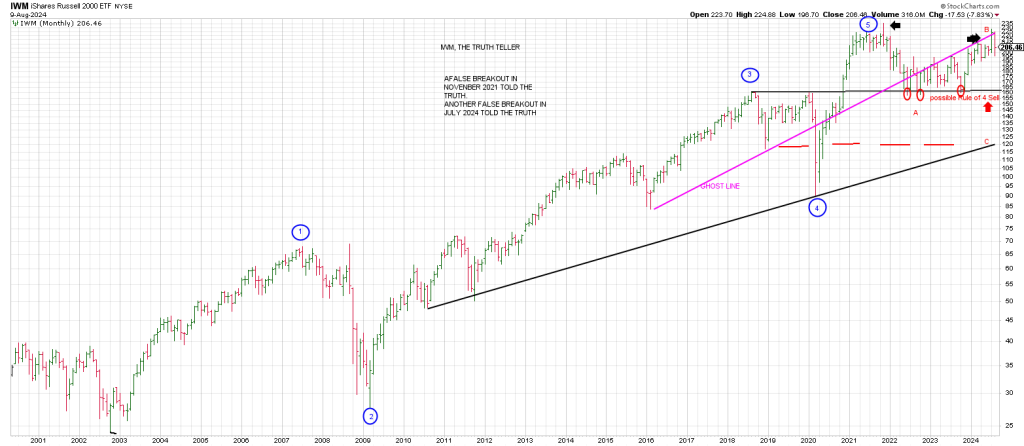
Notice the false breakout (black arrow) that signaled the 2022 bear market and what I’m counting as an A Wave decline.
A B wave rally culminated with another false breakout (black arrow) in July 2024.
If I am correct a vicious C Wave is on deck that will accelerate on breakage below the triple bottoms in the 160 region.
Below 160 opens the door to the 120 region.
Fast moves come from false moves. IWM’s false breakout in November 2021 perpetuated a 20% decline over 7 months.
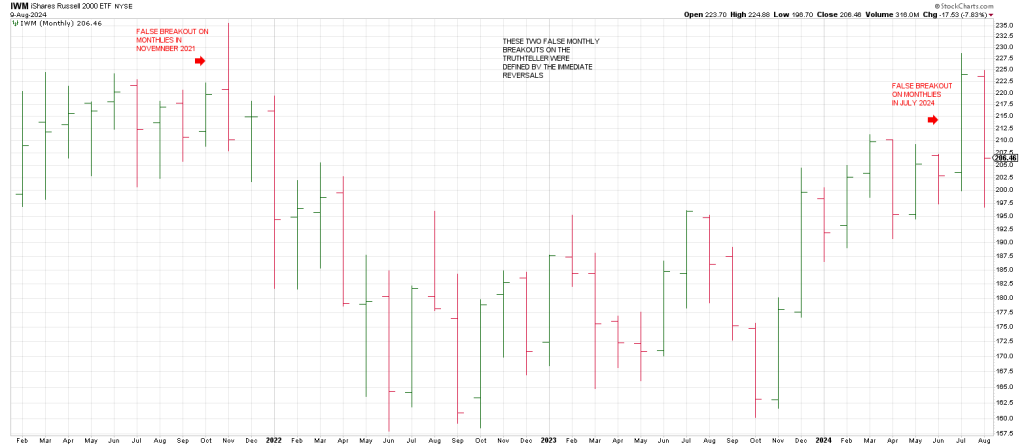
Given the prospect for a C Wave decline, the current false breakout may be ready to turn stocks into a wasteland.