
The 3 Day Chart tells the tale of the near term trend.
When it turns down directly after a major rally or an all-time new high,
It often defines a major turning point.
This occurred on July 18th.
Notice that the drop to turn the SPX 3 Day Chart down started from a Breakaway Gap right off the 5569 all-time high.
When the 3 Day Chart is pointing down, anytime you get two consecutive higher highs (not necessarily higher CLOSES), the SPX is in my Minus One/Plus Two sell position.
This defines my Swing Method to determine the near term trend.
The 3 Day Chart remained pointing down and yesterday, July 31, month-end, the SPX produced another Minus One/Plus Two sell setup.
This time it did so on a Pinocchio of the 20 day moving average producing a Holy Grail sell signal (a backtest of a declining 20 dma in the bearish case…opposite for bullish setups).
As well on Wednesday, the SPX pushed into the open gap from the Momentum Gap left on July 24th. A Momentum Gap is a gap that produces follow thru.
Following the July 16th all-time high, the SPX produced a Momentum Gap as well.
All of the above occurred within the context of a retrace to 5520.
This is an important level as it is 180 degrees down from the all-time high.
The SPX pushed above 5520 but essentially closed right on it (5522).
Moreover, the SPX struck a high of 5551 (555) on Wednesday.
On my Square of 9 Time/Price Calculator 555 squares-out with July 31/August 1st.

On the above daily SPX I drew a declining Tops Line from the ATH to the July 23rd pivot high.
Notice that Wednesday produced a Gap & Go above this trend line.
A failure back thru this trend line and Wednesday gap is the Matador putting the sword in the bull.
The significance/geometry of this trend line is validated by it being the top rail to a trend channel
Created from the low of the “initial” high on the July 11 Key Reversal Day and the low for the move on July 25th.
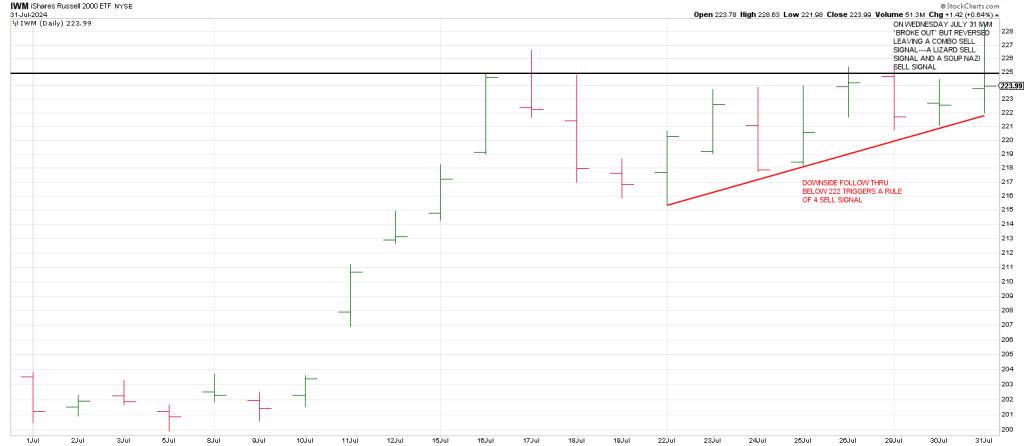
On Wednesday, IWM produced a Combo Sell signal.
It left a Lizard sell signal from a 52 week high.
A Lizard is a new 10 day high Topping Tail, a move to a 10 day high where the item reverses to close near the open after a runup.
As well IWM left a Soup Nazi sell signal on Wednesday.
This is a strategy I created to identify false breakouts.
It is triggered when an item makes a new 20 day high but reverses below a high within that 20 day lookback. There must be at least a 4 trading day interval between the two highs in question to guard against a continuation move.
On Wednesday IWM struck a new 20 day high but reversed back below the prior 20 day high from July 17th. Notice that July 17th was as well a Lizard signal bar reversal day. It led to a turn down of the 3 Day Chart.
In other words theoretically, IWM produced a sell signal on what looks like a Test Failure of a prior signal reversal day, July 17th.
A potential Sign of the Bear. Follow thru is key.
As well Hit and Run flagged on our private twitter feed on Tuesday that 227 squares out with July 31st.

The DJIA produced a large range Key Reversal Day on July18th, It rallied back to test the KRD yesterday following a test of the 20 day moving average on July 2th.
Yesterday looks like it produced a Test Failure Day with the DJIA reversing following a test of the all-time high DJIA close.

In sum, the SPX, IWM, and DJIA are painting the Sign of the Bear.
Hit and Run flagged mid-July as a potential major turning point based on 34 year major ‘natural cycle’ and market cycle.
34 years ago the market struck a high in mid-July.
It was discounting a Mid-East war that broke out on August 2nd when Saddam Hussein invaded Kuwait.
The war produced the birth of modern terrorism.
If cycles follow suit, the expectation is that a new war will breakout in the Mid-East in coming days.
Tape Reading
Presumably AMD earnings were the spark that ignited the spike in chips yesterday.
Ironically AMD shows the one-day 90 degree reversal from the Opening Spike High.

Yesterday Hit and Run members bought QCOM going into earnings and sold after hours around 92.50.

Hit and Run also bought CVNA ahead of earnings selling it after hours up 10 points plus.
CVNA was another earnings play telegraphed by a Blade Runner long setup.
This is when a presumed Head & Shoulders Top isn’t.

After Wednesday’s close META exploded 30 points on earnings…dragging up most tech in its wake.
However trading pre-market today at 509 shows that META may be installing a Right Shoulder of an H&S Top.

From the July 25th 443 low 270 degrees up (90 degrees X 3) is 509.
A pullback below its 20/50 Moving Average Bowtie is the Sign of the Bear

Square of 9 Wheel
Purchase your own Square of 9 Wheel. Shipping to US only. Contact Jeff for shipping outside the US.