Let’s take a look at initial downward momentum that triggered significant market slides or crashes between 1990 and 2022.
We will look at 4 examples: July 1990, July 2007, February 2020 and January 2022.
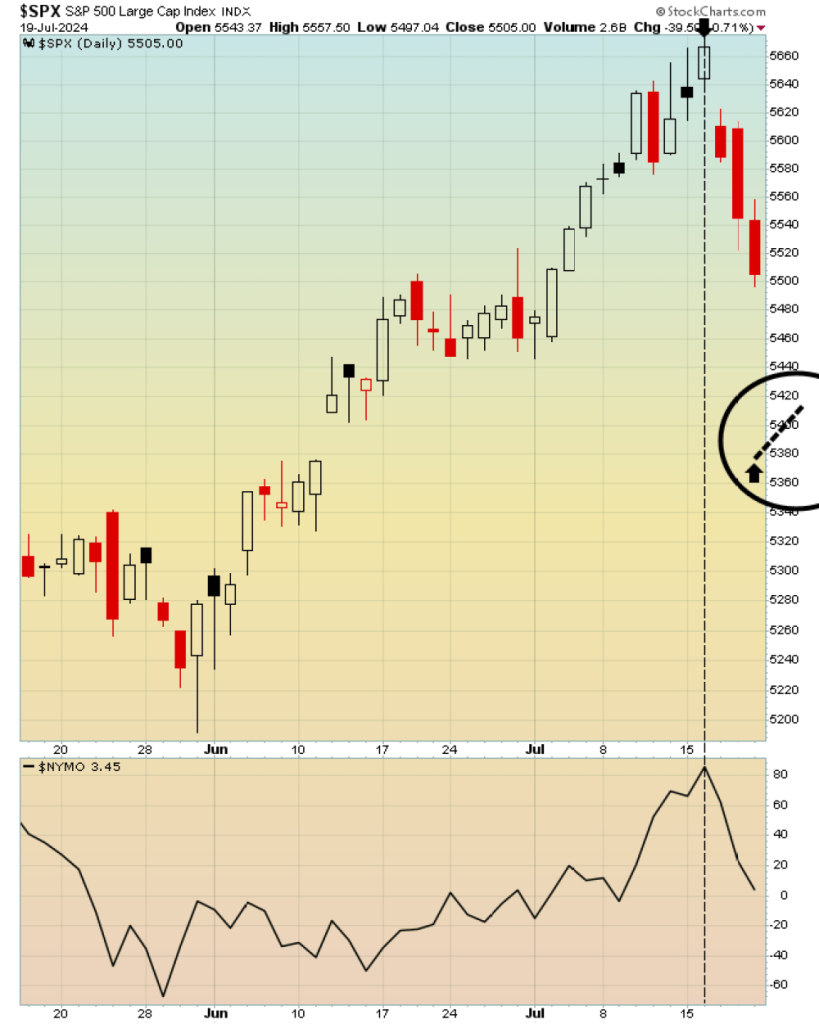
We will use the McClellan Oscillator as a proxy for market momentum.
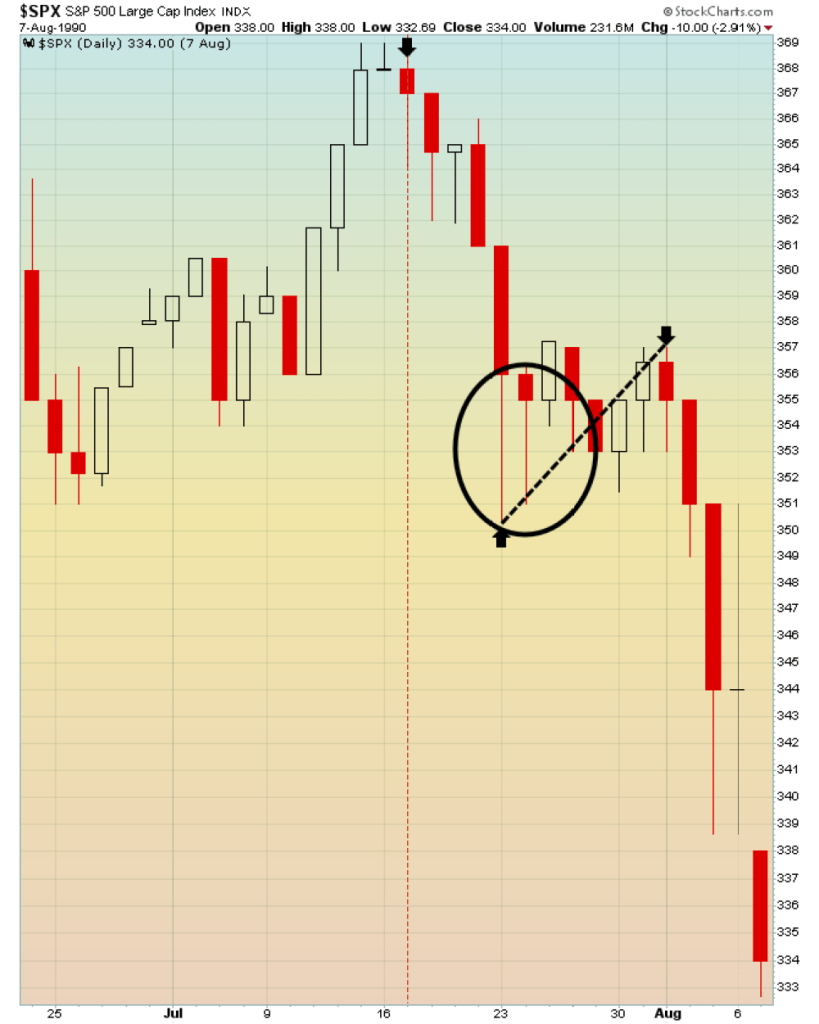
July 1990
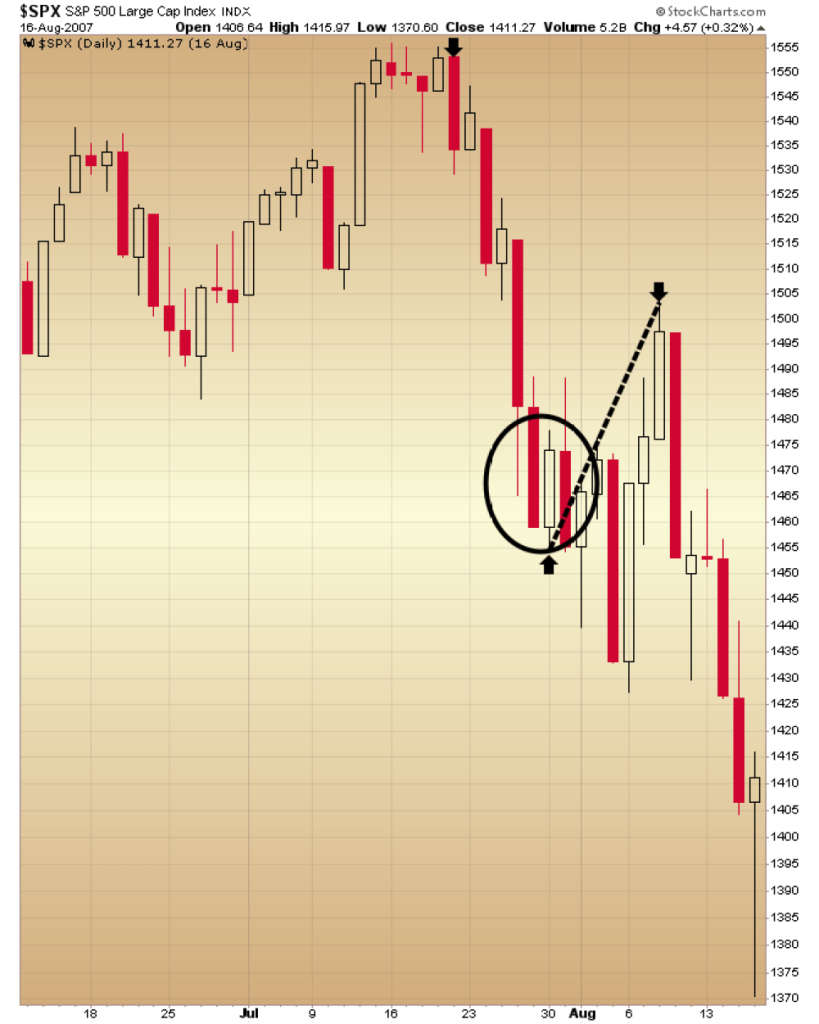
July 2007
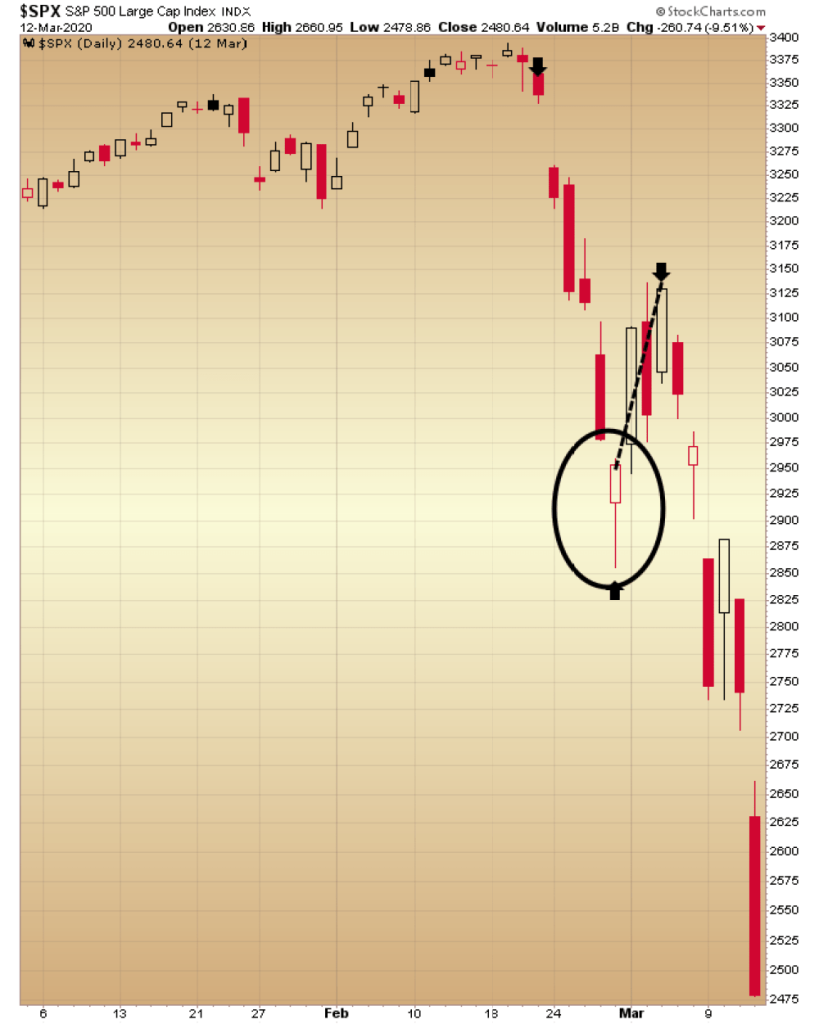
February 2020
January 2022
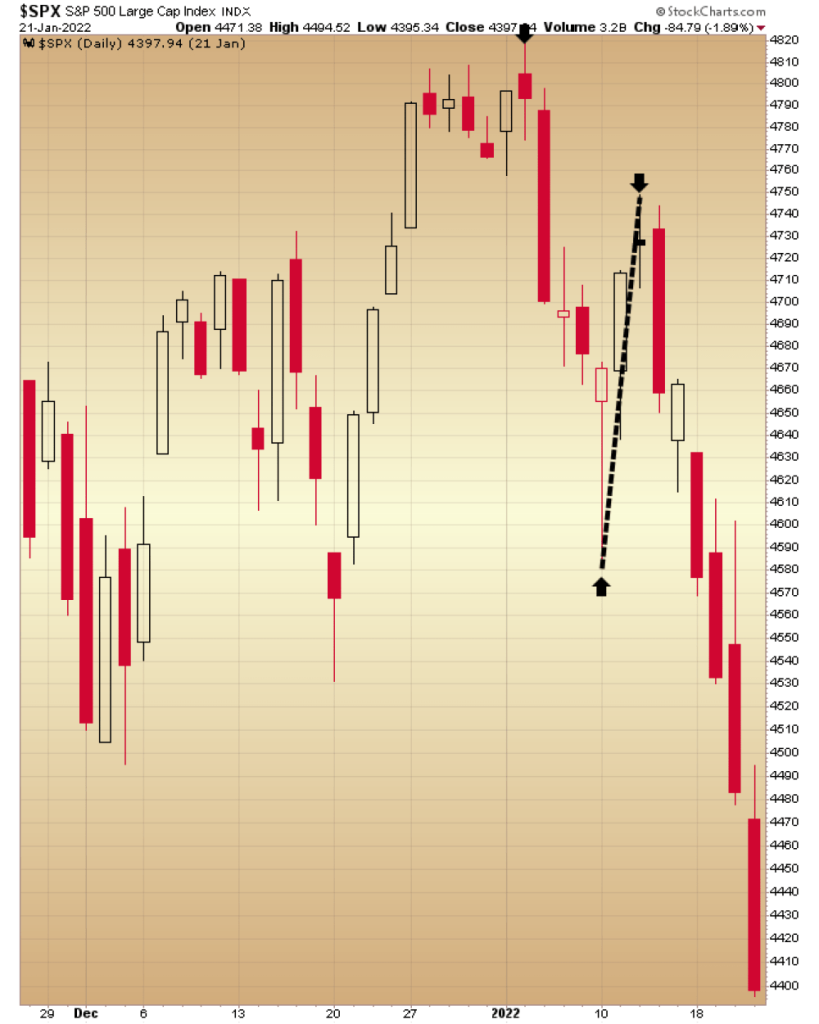
Using the McClellan Oscillator readings to measure market momentum, we will gauge the initial downside momentum in each case by taking the decline in the oscillator reading over the first several days before a rebound as our proxy.
This is the “initial thrust” or downside momentum as measured from the above SPX charts versus the magnitude of McClellan Oscillator decline in points:
To July 23, 1990, July crash -83.37
To July 26, 2007, July crash-89.90
To February 28, 2020, Covid Crash -139.20
To January 10, 2022, First Top -47.77
Examining now the downward trend this last week, our measurement for the last 3 days reveals:
To July 19, 2024, thus far, ….-81.81.
What can be derived from the above?
Two critical observations about the current trend from July 16, 2024.
These insights are crucial and provide a significant advantage to those traders who grasp the concept of market momentum.
First, the initial thrust of this decline has yhet to be fully measured. However, from the first three days since the July 16 , 2024 peai, we can observe that this thrust is at least as intense as those that perpetuated the July 1990 and July 2007 crashes.
As the week progresses, we’ll see how it compares to the Covid Crash of 2020.
Here’s the picture in July 2024
Second, if we study the charts from 1990, 2007, 2020 and 2022, we observe that after the initial thrust, the SPX consistently produced a counter trend move last 2 to 6 days (this was also true in the crash of 1929).
A second downward thrust in SPX invariably followed this rebound, which was even more significant than the initial thrust.
In sum, the SPX broke the key 5220 level on the Friday closing basis last week but gaped up on Monday reclaiming its 20 day moving average.
The sharp turndown in the 3 Day Chart on Friday produced a strong rebound.
Notably Friday’s decline also produced a break of a trend channel from April.

I connected the all time high with the mid-June high and the May 23rd Key Reversal Day and paralleled a line off the May 31st low to get a trend channel (blue).
I then connected the all time high with the late March high and paralleled a line off the important April low to get the red trend channel. Notice that the bottom of the red trend channel ties to the May 23rd Key Reversal Day in the low 5300 region.
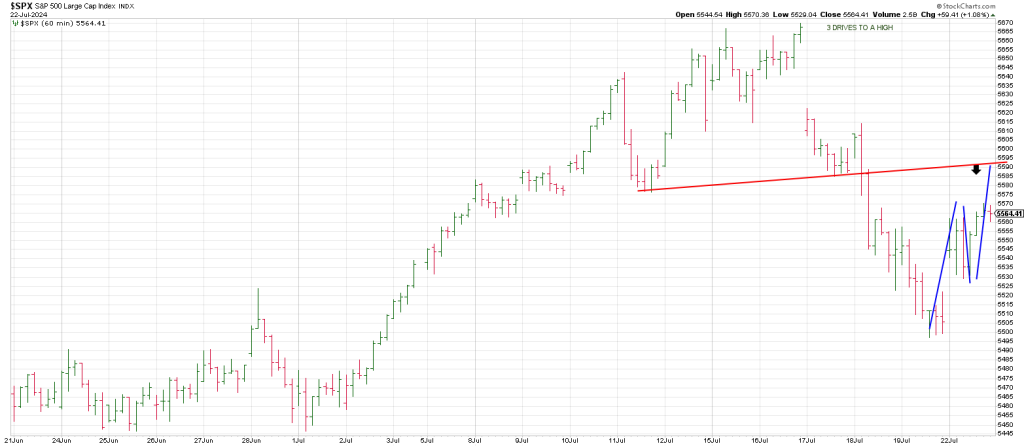
The likelihood is a Minus One/Plus Two sell setup is on deck.
The idealized level for this setup to occur is the 5580 region which is 90 degrees down from the SPX all-time high.
Consequently, ideally, a pullback Tuesday will see the SPX trade above Monday’s high.
In other words a A Wave rally on Monday, a B Wave correction and then a C Wave rally to complete a corrective wave 2 of some degree.
If this scenario is correct a powerful Wave 3 decline will unfold before the end of July.
This is consistent with the message of last weeks Key Reversal Week.
An hourly SPX shows 5580 ties to the break down pivot on Thursday and the 50 hour MA.
The SPX carved out 2 hourly higher highs before the last hour on Monday leaving an hourly Minus One/Plus Two sell setup.
Consequently, it would not be surprising to see a pullback prior to a potential push to the 5580 region.
We have seen a surge in volatility following last week’s negative thrust.
The sharpest shortest rallies often occur in the midst of bear phases.