“I’ll be flying low below the sun” No Freedom, Dido
The 17 year Cycle is an uncanny timer of emotional and sociological shifts in the markets and the world.
It was one factor in our analysis projecting a multi-year peak for the 1st quarter in 2000.
Long time readers will recall that the day of the SPX top on March 24, 2000 our morning report , “Pop” nailed the Bubble’s last gasp.
On that day the SPX culminated a SEVEN day Jail Break Rally of 11.5 %.
The SPX exploded from 1392 to 1553 in 7 days.
On March 24th, the top day, the index left a Lizard sell signal, a 10 day Topping Tail (a new 10 day high with an open and close near session lows…reversing to close near the opening lows after running up.
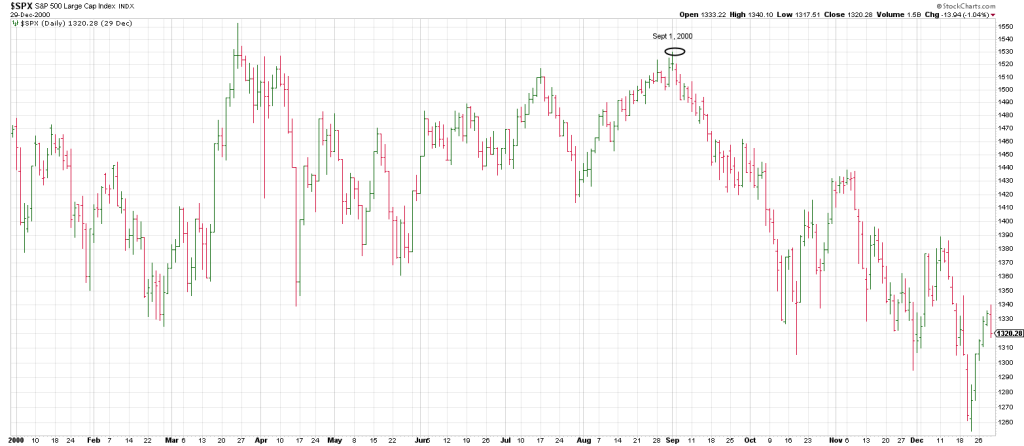
However it wasn’t until September 1st, 2000, virtually on the anniversary of the September 3rd, 1929 peak, that the bear kicked off in earnest for the SPX.
The NDX also struck a Primary Top on March 24, 2000 at 4816 as well with a Secondary Top playing out on September 1, 2000. The Secondary High was substantially lower at 4147.
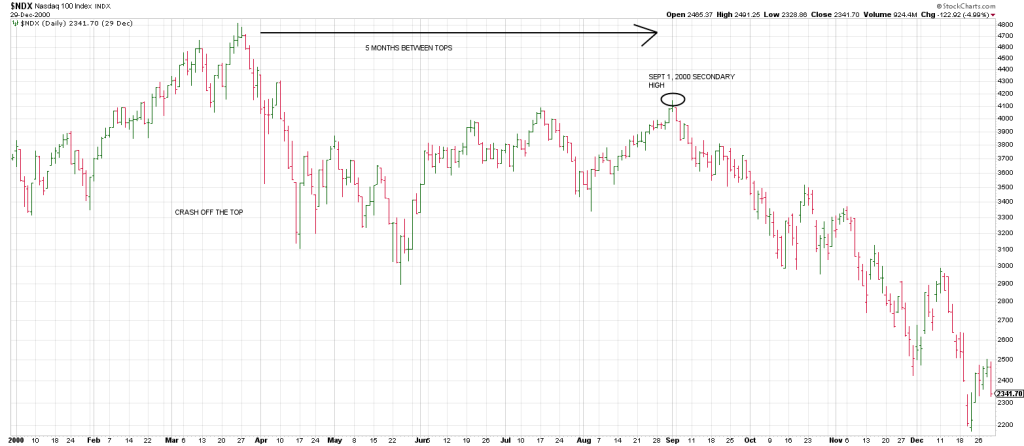
However, while the SPX’s initial drop was apx 14 %, the NDX collapsed 35.5% off the March 24th high in 15 trading days.
After a bounce the NDX struck an initial low on May 24th.
The plunge in the NDX was vicious because the bigger the top, the bigger the drop: the NDX was the heart and soul of speculative excess like the DJIA was in 1929.
There are two things two discern about the nature of the 2000 top.:
1) Not only did the Secondary Highs in the SPX and NDX in 2000 come about on September 1st, near the anniversary of the Primary High in 1929(Sept. 3rd), but the two tops were roughly 70 years apart. Remember cycles can left right translate.
Legendary market analyst W D Gann wrote that 7 is the number of panic. Roughly 70 years after 1929 the NDX mirrored the 1929 crash.
The DJIA lost 89% from September 3rd 1929 to July 8th, 1932.
The NDX lost 78% from March 2000 to October 2002.
2) The Secondary Tops on both indices in 2000 were 5 months from the March crest.
This is not the pattern we are seeing currently with a sharp break and a test of highs.
We currently in the midst of a Climax Run and have not seen the first break yet.
That said, it could be argued that the Primary High was in Nov 2021/Jan 2022 with a sharp break and that this is a B Wave B peak echoing the B Wave new high in July/October 2007.
That argues for a much larger top on the table.
While the market crashed off the March 2020 peak, it was from the Secondary High in September where the relentless persistent devastation occurred.
The lesson to be learned is that the old Wall Street saw is that markets don’t crash off their highs. They can.
They did in 2000. The initial smack down.
They did in 2020. The Covid Crash.
Sometimes the postman does ring twice. Often there is a warning and there is time as was the case off the 1929 top, the 1987 top and the 2007 top.
But not always.
What does that have to do with the market currently?
We started by talking about the 17 year cycle.
Twice this 17 year cycle is 34 years.
The lunar/solar cycle is 33 to 34 years. This refers to the time it takes for the moon and the sun to reach the same alignment they were when the cycle began. It is based on the Earth’s orbit (cycle) around the Sun and the Moon’s orbit around the Earth.
Many times I’ve talked about the mid-July 1990 top. It coincided with a war cycle as Saddam invaded Kuwait on August 2nd, 1990.
From my perspective this was the start of the modern day era of terrorism with Isis.
34 years from July 1990 is July 2024 and things are on fire in the Middle East.
Two of these 34 year cycles tie to the period from 1929 to 2000 when the NDX mirrored the DJIA crash over the next w2 to 3 years.
The thing about cycles is that there are Wheels Within Wheels.
They don’t exist in a vacuum.
They are cycles within cycles that run concurrently, like the strands of a double helix.
For example if we take the July 8th 1932 bear market low and add 34 years we get the 1966 Secular Bull Market Top in February 1966.
34 years later was the Q 1 top in 2000.
Half this 34 year cycle or 17 years from mid- July 1990 is July 2007. That was the Primary High in 2007.
The market declined sharply into mid-August then ran up to a nominal new high on October 11th.
17 years later is mid-July 2024.
The indices are blowing off. The Mag 7 are in vertical runs which I believe are Buying Climaxes. There are cracks under the surface. Divergences as to breadth and intra market divergences between indices.
What I find most interesting is the potential Time/Price synchronicity with this July.
Tomorrow we celebrate freedom and Independence Day.
It doesn’t feel like freedom somehow.
1929 is 95 years ago.
95 aligns with/ vibrates off July 4th.
Notice that both are 180 degrees opposite 76.
The State of Israel was reconstituted 76 years ago in 1948.
1776.
76.
July 4th 1776 is 248 years ago.
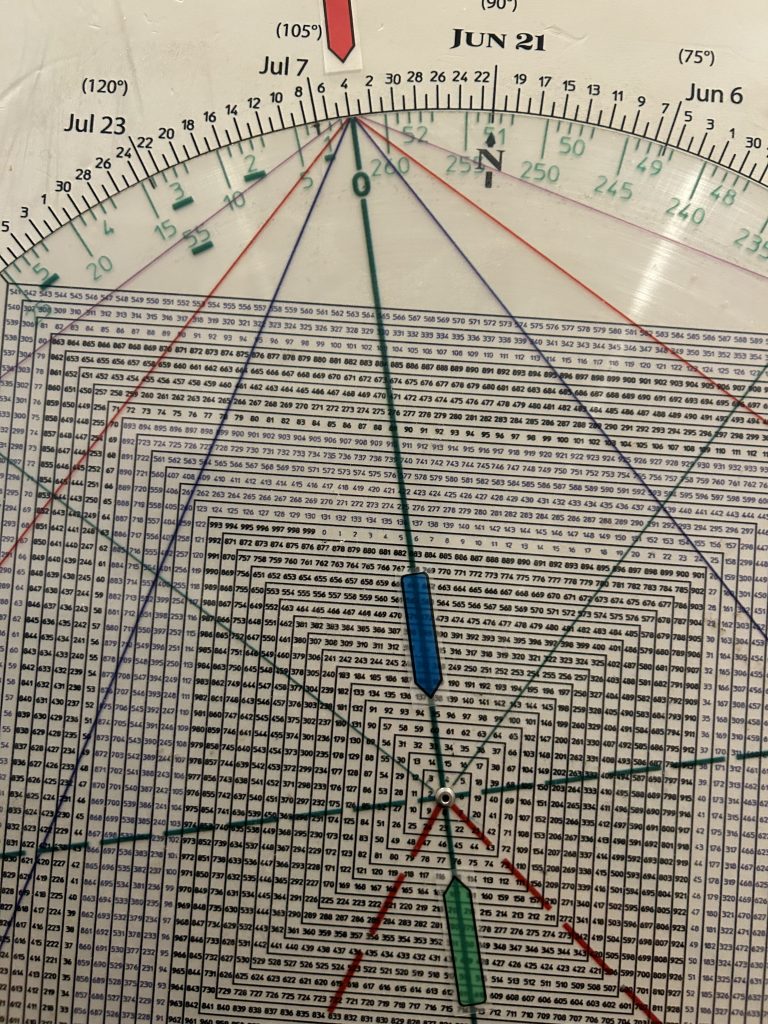
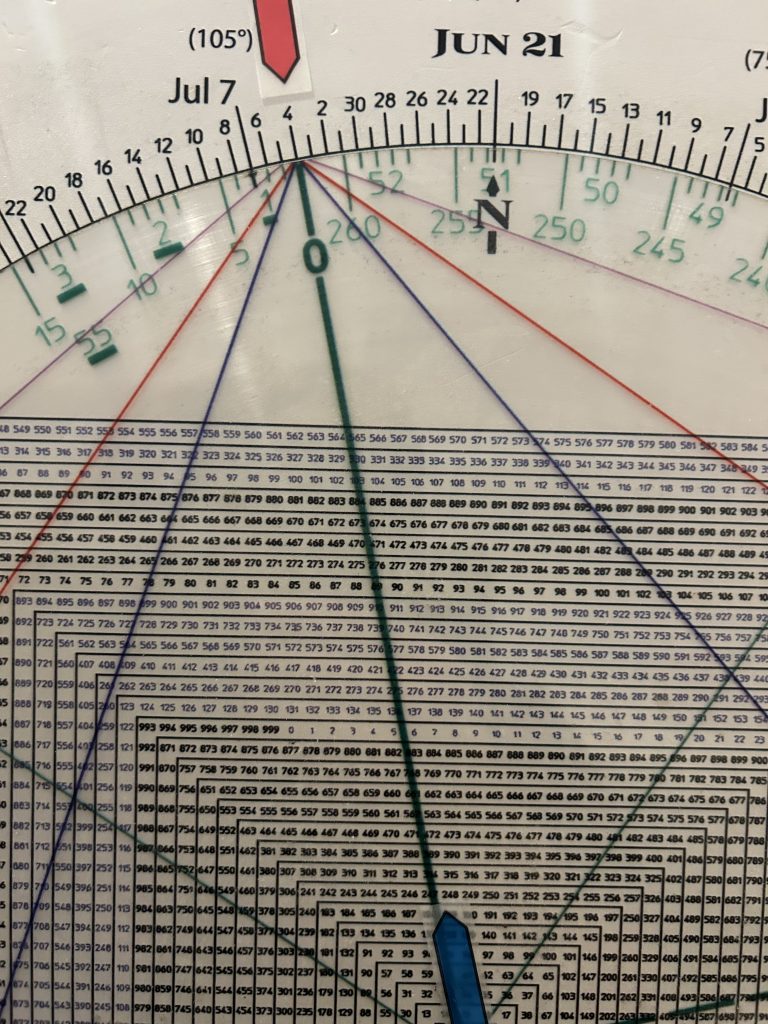
This June/July points to 247/248 on the Square of 9 Wheel
In November 2007, a few weeks after the stock market set a multi-year peak that triggered a 50 + % plunge, Stuxnet was unleased on its target. Stuxnet was the world’s first cyber weapon. It was believed to have produced crippling effects on the Iranian nuclear program.
The initial attack was not “recognized” for another three years.
Succinctly, a new phase of Middle East conflict was initiated in late 2007.
To recap we are 17 years from 2007 and two cycles of 17 years from the Gulf War in 1990.
This reinforces the outlook that this July and 90 degrees later on the anniversary of Stuxnet in October/November should be historic.
As flagged over the past week early July 2024 also times a cluster when gold and the precious metals should see cycles exert their influence: 9 months (270 days/degrees) ago is the early October low in GLD.
90 days/degrees ago in April saw a spike high
The stage is set for a new surge in the metals.
The question is whether a 3rd spike to a new weekly high will mark 3 drives to an interim top or will
Clearing the April and May reversal weeks trigger the mother of Keyser Soze buy signals —a double Reversal of a Reversal pattern.
The expectation for a surge in the metals here is corroborated by the chart below which shows a 28 month cycle and a 14 month cycle.
The blue lines mark 28 month increments back from July 2024.
The green lines are 14 months from the October 2008 low.
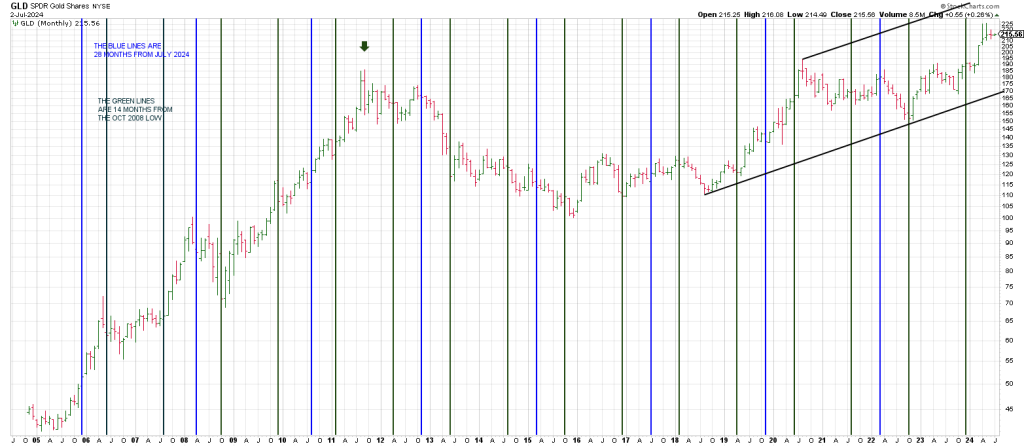
Notice that the upper rail of a trend channel (black) opens the door for a surge beyond our to our projection of 232 made over a year ago.
232 GLD is cubes-out with the 150 low from October 2022.
150 squares early July.
The door is open for a drive to 232 GLD and if it is going to play out, it could do so quickly
Interestingly, this ties to the explosive setup in USO showed yesterday.
Do both of these and the stock market hinge on war cycles set to exert their influence this summer?