“When you’re on a golden sea
You don’t need no memory
Just a place to call your own
As we drift into the zone.” Island In the Sun, Weezer
Throughout my career I thought that more effort equals more reward.
A surgeon will fight with everything he’s got to save a patient.
In trading that can be the kiss of death.
It sounds trite, but you’ve got to know when to hold ‘em and know when to fold ‘em.
Trying to will a bad trade back to life is lethal.
Never confuse your position with your best interest.
So while more effort equals more reward is true for the most part, in the physical domain, it doesn’t necessarily hold true in the mental domain.
The more you lift, the stronger you become.
The more you practice a skill, the better you become.
This is where the Backwards Law kicks in. The mental side.
When I played tennis the harder I tried to serve, the more I would fault.
I found that during my best matches, I was trying less and performing better.
The Backwards Law.
It means the best performers don’t care as much when they compete.
It really means they’re less worried about failure or the outcome.
They try less by caring less.
And by caring less, they’re able to take risks, play freely and to their potential.
This ties in with the Failure Paradox:
the more you’re afraid of failing, the more likely you are to fail.
In trading, the more you focus on the process and not the outcome, the more likely you are to take the setup and get out of the way when the trade turns south.
I know, you’ve probably heard this before.
In trading, you can’t trade not to lose.
In life it’s like whatever you’re a little bit worried will happen or care to much about….
Do it.
Do the embarrassing thing, on purpose.
It shows you that it isn’t that bad.
Most people won’t even notice.
And if they did…they forget about it in 5 minutes.
In trading you can take advantage of the Backwards Law by caring less about the outcome.
Expose yourself to the thing you’re worried about.
Take the Pain Trade.
The Pain Trade is the obvious trade. It’s the stock that’s too high and you don’t want to be the one that top ticks it and vice versa.
Mr. Market doesn’t know this.
IT’S IN YOUR HEAD.
That’s it.
Believe what you see, until proven otherwise.
Speculation is observation pure and experiential. Thinking isn’t necessary and often just gets us into trouble.
In trading. I like to say INVERT.
Invert the chart for a different perspective.
When a stock is going vertical, and you turn the chart upside down, it’s easier to visualize a waterfall than it is gravity.
Let’s take a look at how INVERT, turning the chart upside down, helps perspective.
Below is a daily SPX for 2022.
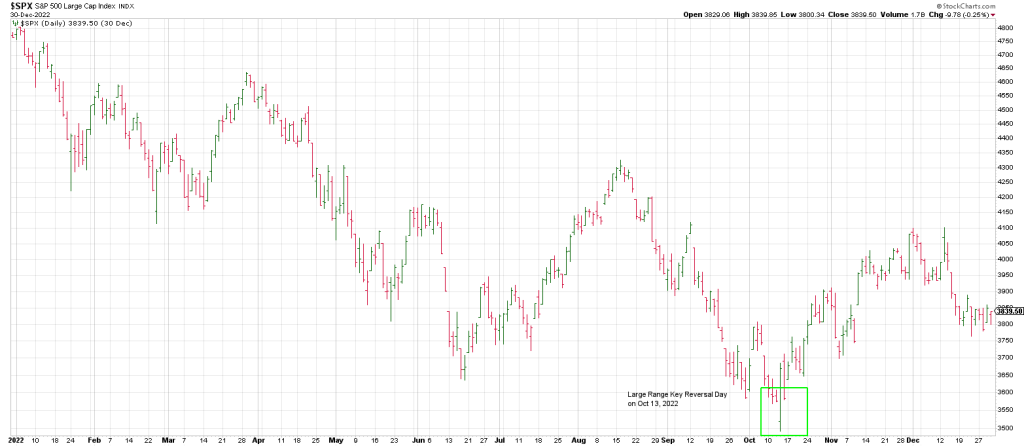
On October 13, 2022, the SPX carved out a massive Key Reversal Day.
From a low of 3491 the SPX closed at 3670 that day.
If you invert the chart, it clearly suggests a major turning point or at least a sharp decline.
That perspective seems more indelible if you turn the chart upside down.
We know now that the market has been making higher lows ever since
Two things:
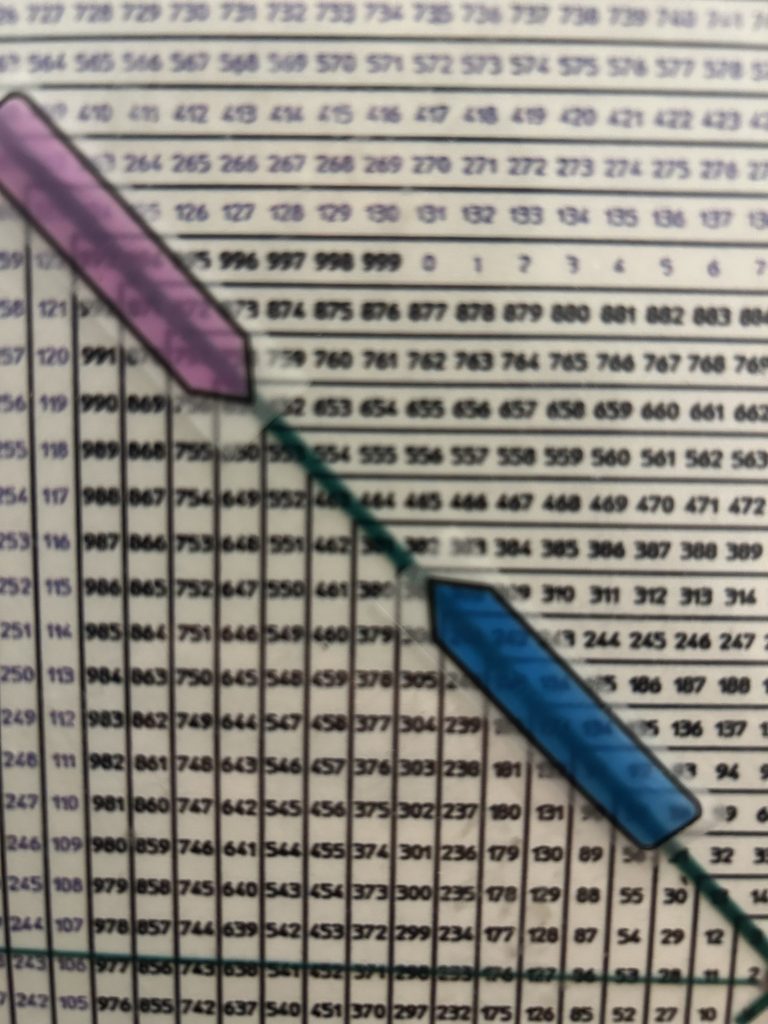
- The October 13th, 2022 low at 3491 was also a Time/Price square-out.
On my Square of 9 Wheel, 349 (3491) squares-out with Oct 13.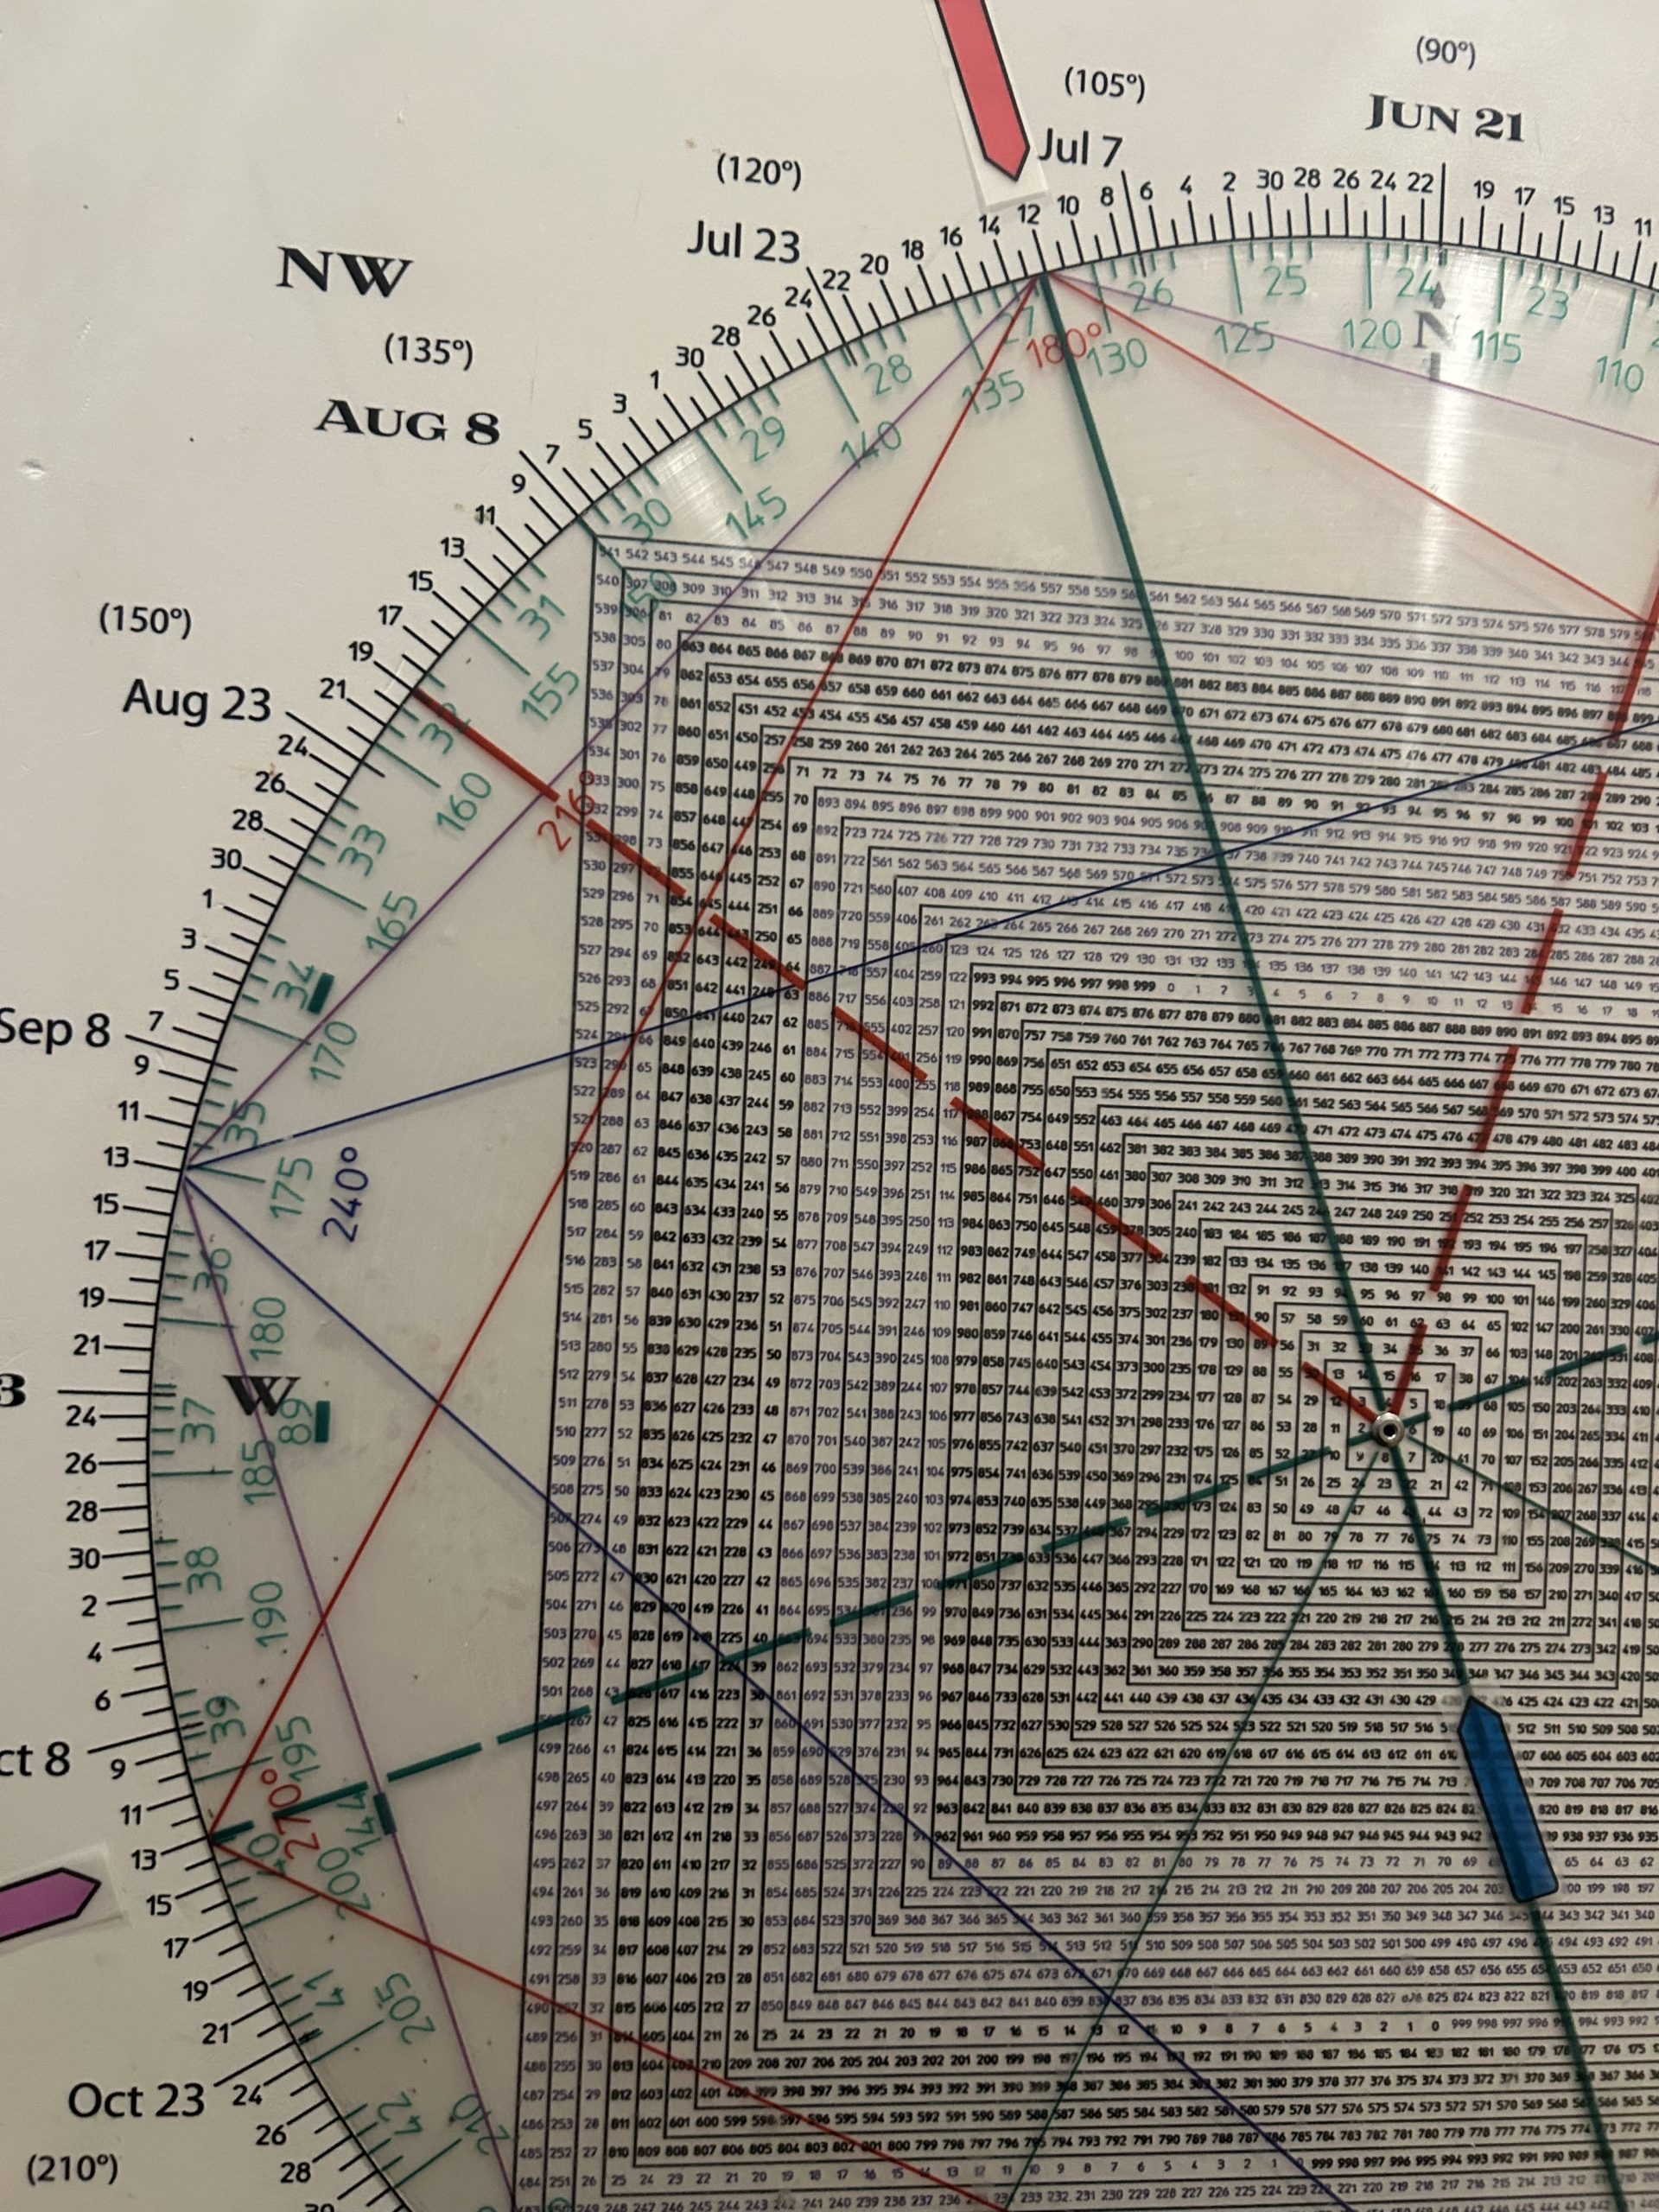
So we had Time, Price and Pattern pointing to a turn.
20 months later the SPX is still making new highs. - The Oct 13, 2022 reversal was a Secondary Low, an Undercut Low of the Primary Low in June 17th, 2022. It was a Trap Door bottom, a Bear Trap (bullish)
Indeed the October 13 low was also an undercut low of a low two weeks earlier.
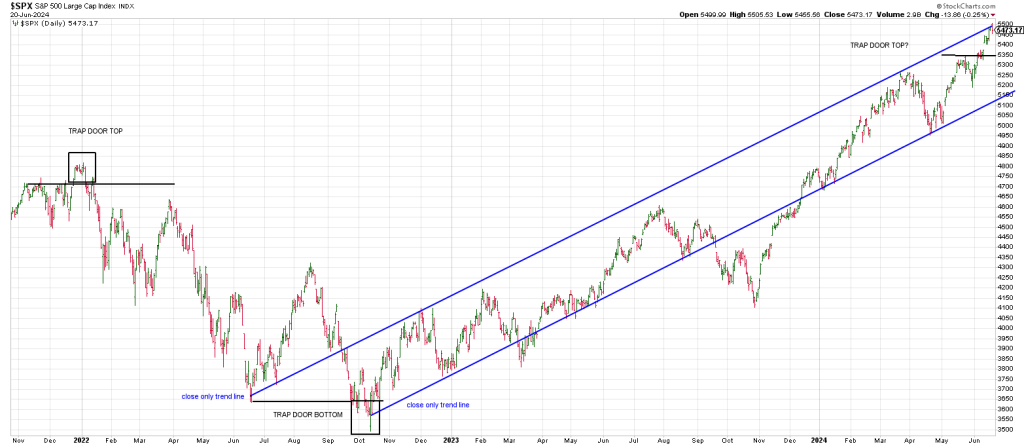
Notice that the late December 2021/early January 2022 top was a Trap Door top.
It was a Throw-Over of the prior highs tracing out a textbook Gann M A Top.
The important thing to observe is that the January 2022 high showed 3 Drives To A High.
Ditto the June 2022 low.
Ditto the October low.
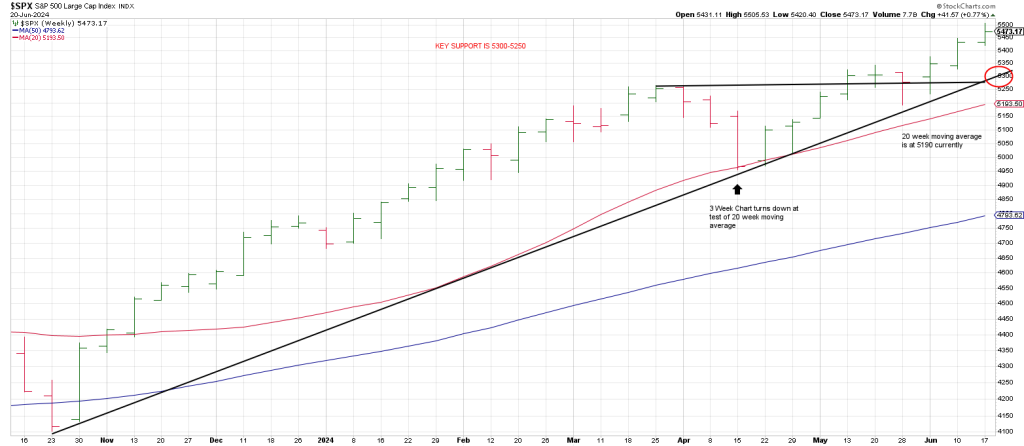
Turning to 2024 it looks like we have a possible 3 Drives To A High…March, May and June.
Is the gap from June 12th a Trap Door?
Clearly breakage back below the open gap at 5376 that holds is a warning.
In addition, I drew a close only trend line from the June 2022 close connecting the important March 2024 highs.
That line was struck on Thursday.
I paralleled a trend line off the June 2022 close only trend line from the October 2022 closing low.
It proves the geometry of the 20 month advance.
A failure back below the open gap at 5376 theoretically opens the door to 5150 and the bottom of the close-only trend channel
So the SPX can drop 300 points until it tests key support.
But before the SPX can test key support it has to violate short and intermediate term support.
Let’s drill down.
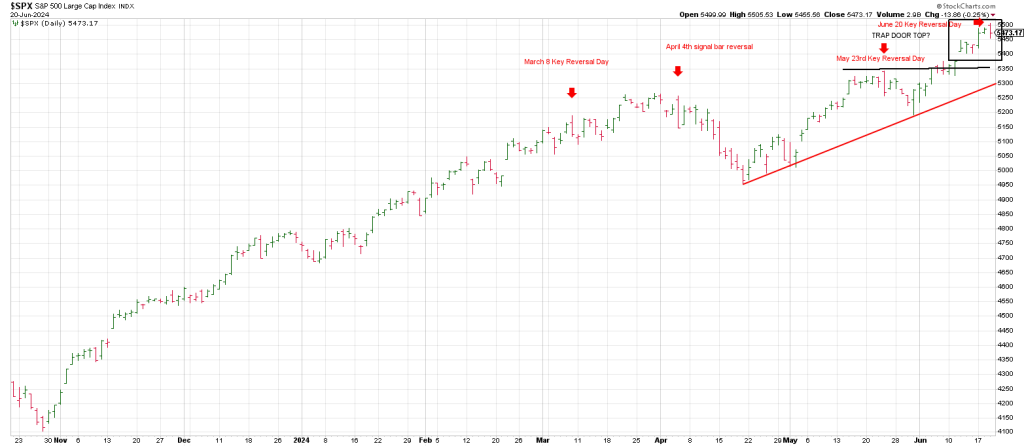
Does the above chart resemble the Trap Door at the January 2022 top?
Yes.
Moreover, we have 3 Key Reversal Days on the clock as well as a signal bar reversal on April 4th that is in the spirit of a Key Reversal Day.
We see the open gap from June 12th is just above the horizontal support.
Breakage below Phil D Gap at 5376 with downside follow thru below 5350 opens the door to 5300.
That’s where things get interesting because trade below 5300 triggers a Rule of 4 Sell signal…a break of a 3 point trend line.
You can see how the dominos line up paving the way for a drop to the 5150 region.
That does NOT mean that the SPX cannot go somewhat higher first.
However, my expectation was for a turning point on June 20/21.
We may see a decline from here that holds the 5350-5375 region with the potential for a final top in mid-July.
Tomorrow’s report will go into the significance of mid-July.
Suffice to say that counting from the May 23rd reversal high, mid-July ties to W D Gann’s Panic Zone.
What is unknown currently is whether that mid-July time frame sees panic selling or panic buying.
I’m considering that the pattern playing out is mirroring the January 2020 peak which was followed by a drop and a false new high in February 3 weeks later.
Notice on the Square of 9 image above the T-Square with the October 13th 2022 low squaring out at 349 and MID-JULY.
Interestingly a drop 5150 ties to the 20 week moving average.
The decline into April 19th was a text book buy setup.
I did not fully recognize it as such at the time.
It was a Combo buy setup:
- The 3 Week Chart turned down for the first time since the rally off the October 2023 low.
- The 20 week moving average was tested for the first time since the rally off the October 2023 low
- The 4950 low was 360 degrees up from the 4104 October 2023 low (495 is 360 degrees up from 410)
In sum momentum got taken to the woodshed on Thursday.
It was “Fargo” for the semis as they got taken to the wood-chipper.
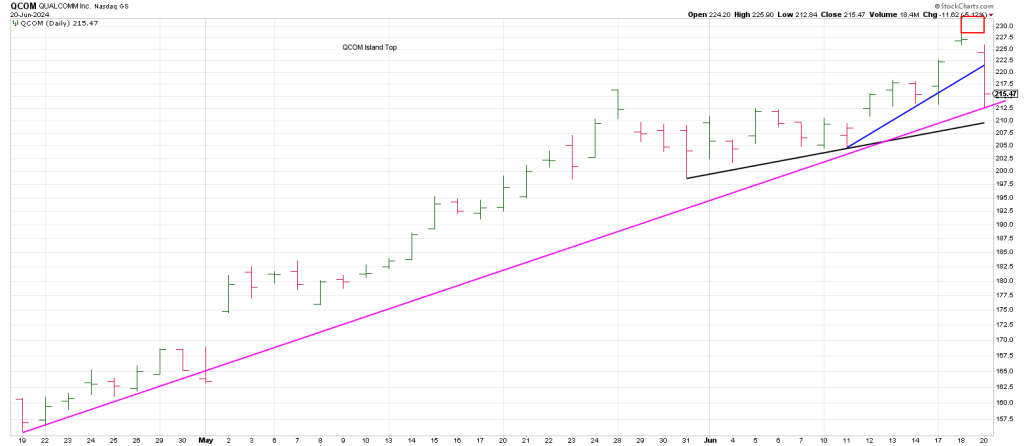
The 230 square-out in QCOM flagged on Tuesday exerted its influence.
QCOM triggered a Jump The Creek sell when it caved in thru Tuesday’s Exhaustion Gap leaving an Island.
The 139 square-out on NVDA flagged on Tuesday elicited a large range Key Reversal Day.
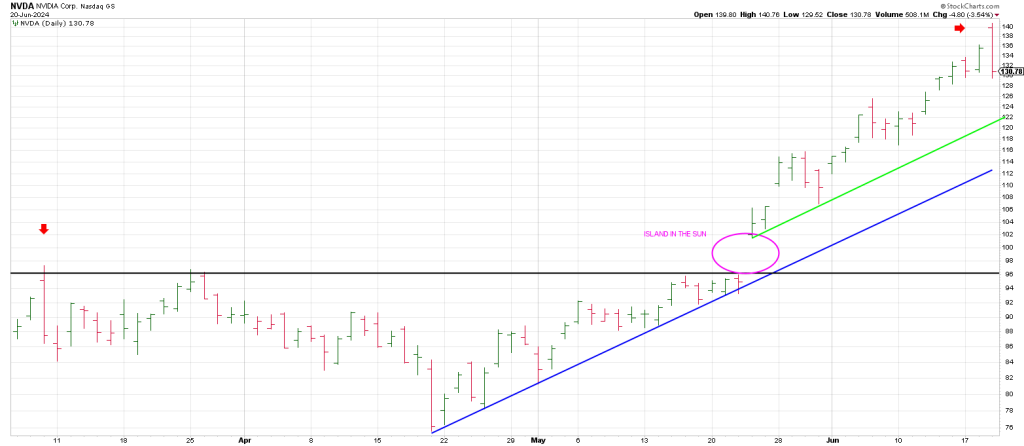
The Time/Price square-out with June 28th pointing to 139 alerted us to a reversal and Hit and Run hit pay dirt shorting NVDX at 118.
NVDA also left a large range Key Reversal Day on March 8th.
That reversal produced a 5 week pullback/consolidation.
NVDA didn’t drop immediately. It tested the high from March 8th first and rolled over losing 20 points. That’s 200 points on the pre-split stock.
It will be interesting to see if a similar pattern plays out or the Principle Of Alternation plays out and the second mouse gets the cheese.
In other words, will this second Key Reversal in the king see immediate downside follow thru?
NVDA dropped 90 degrees directly off Thursday’s high to 129.
180 degrees down from high is 117.
270 degrees down is 107.
A full 360 degree correction is 97.
In sum, the SPX/QQQ has been in a runaway move since the April 19ith low.
720 degrees or two cycles of 360 degrees in price from that 4953 low is 5530 (553).
Maybe something, maybe nothing but 553 aligns with the 381 DJIA closing high in 1929.
if the SPX pulls back and gaps below the June 12th gap we’ve got an Island following 3 drives.
An Island in the sun…like 1929 and 1987?

Square of 9 Wheel
Purchase your own Square of 9 Wheel. Shipping to US only. Contact Jeff for shipping outside the US.