W.D. Gann stated “if you can find the zero point, you can measure anything.”
Not all zero points are created equal.
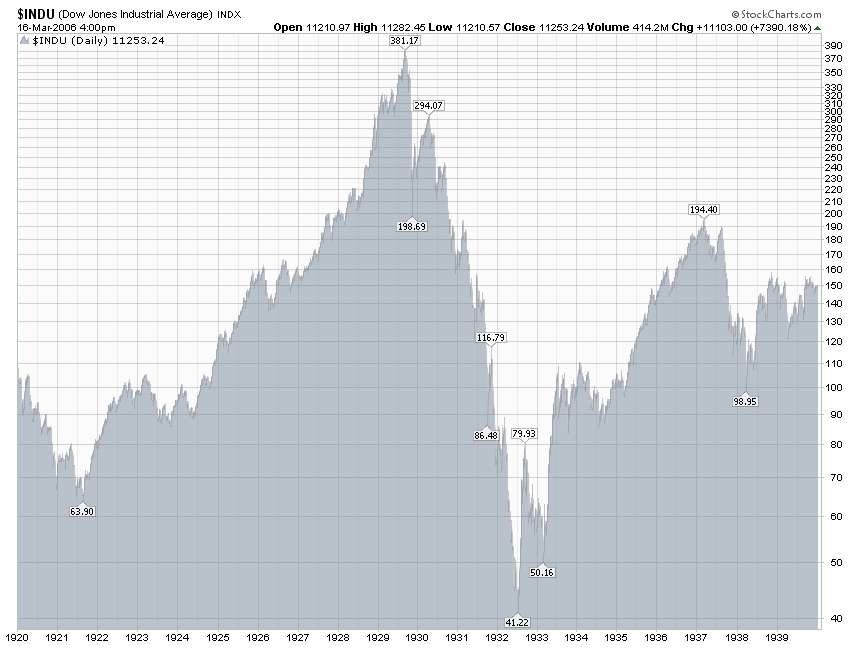
For example checking a DJIA from 1920 shows the low prior to the start of the Roaring Twenties was in August 2021.
However, the start of the impulse for the ‘roar’ of the 1920’s was May 20th, 1924.
In other words, a zero point can be a trough and it can be the point of acceleration.
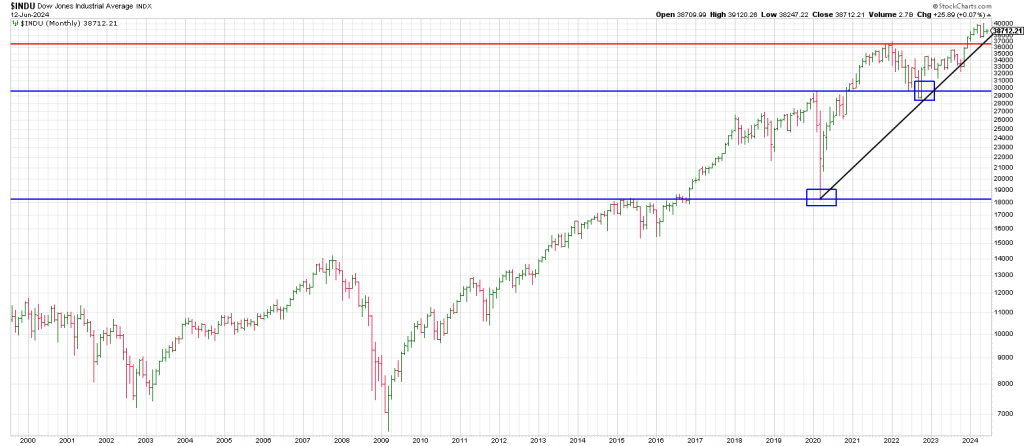
Notice that it was in May of 2024 that the DJIA broke out of a 4 year Cup and Handle.
(49 months).
Why is this important to us here in 2024?
There is a Biblical Cycle called the Jubilee Cycle of 50 years.
It follows the 7 squared or 49 year Sabbatical Period.
It is a time of “redistribution” as opposed to debt forgiveness.
50 years from 1924 is 1974.
October and December 1974 mark the double bottom of a major bear market that started in January 1966. That bear market is most infamous for its near 50% drop from a false new high in January 1973. That wasn’t just an ordinary false breakout, it was an all time record high.
The DJIA lost nearly 50% in 24 months.
Fast moves often times come from false moves.
January 1973 was the Mother of Bull Traps.
Of course 50 years from 1974 gives 2024. And it ain’t a low.
So we have a Low To Low To High Cycle on the table.
The job is to identify the week and the month and ideally the day of the high.
More on that later in tomorrow’s and Monday’s reports.
But keep in mind that November and December 1972 were “breakout months” and that January 1973 went higher but reversed leaving a large range outside down month from a high of 1067.
It wasn’t until November 1982 that the DJIA would see 1067 again.
A period of 10 years. The Decennial Cycle did a good job of timing a new secular bull market.
Following the 1929 crash, the DJIA bottomed in July 1932. (July 8th, which will be an interesting anniversary square-out week this year with 1929 being 95 years ago and 95 “pointing” to July 4th).
50 years later is 1982 when a secular bull market was born.
Happenstance?
Another Low To Low To High Cycle targets 2032.
1932 + 50 = 1982 + 50 = 2032.
I do not believe for a minute that we are running up from here to 2032.
My expectation is that we get a dramatic waterfall potentially mirroring 1929 to 1932 prior to a possible advance into 2032.
This may echo the 5 year rally from 1932 to 1937.
5 years prior to 2032 is 2027.
The presumption is we toboggan into the 2027 region.
Years ending in “7” often see panics.
We have 1907, 1937, 1977, 1987, 2007 (start of a panic), 2017 (Buying Panic).
It will be interesting to see what 2027 brings.
Above we mentioned the high in 1966 and the start of the secular bear market.
50 years from that January/February 1966 top is January/February 2016.
In February 2016, the market began a vertical run that continues here in 2024.
It was interrupted by intervening cyclical downdrafts for 2 months in 2020 and 9 months in 2022.
One of the factors leading me to write in October 2021 that “the market will get hit in January 2022 followed by a nasty bear market” is that January 2022 is 7 squared or 49 years from the Bull Trap in January 1973.
The 49 to 50 year Jubilee Cycle.
It is the 49th year that “sets up” the key 50th year peak or trough as it may be.
It may be a stretch to think of the 2020 and 2022 declines as intervening sell-offs within the context of an ongoing bull but in reality, the 2020 crash tested the high following the breakout from the aforesaid 2016 double bottom.
As well the October 2022 low tested the top of the 2020 pre-crash high.
In sum, if 2024 marks a Low To Low To High cycle top as offered above, then a drop below the prior high from January 2022 will be critical to observe.
Breakage below that high (4818 on the SPX and 36,952 on the DJIA) opens the door to a test of the October 2022 low (3590 SPX and 28,715 on the DJIA).
Interestingly the DJIA has a monthly rising trend line from the March 2020 low connecting the October 2022 low and the October 2023 low that comes in this year at the 36,950 level—the key 2022 peak.
Breakage below that 2022 high will trigger a monthly Angular Rule of 4 sell signal (a break of a 3 point trend line).
That is a Get Out Of Dodge Point Of Recognition.
Yesterday, the market erupted off a funnymental government contrived CPI that was 0.1% less than expected. Trillions of dollars swinging from that little limb
Then the market cheered as the “dot plot” took the potential for rate cuts down to ONE for the balance of the year. The expectation on the Street was for 7 cuts going into 2024.
Don’t Fight The Fed is AWOL.
This goes to show that you cannot speculate based on funnymentals.
Cycles trump the tape.
Time Turns Trend.
And Time is ordered as is the story in the Bible.
Tomorrow’s report will drill down into the short term to see if yesterday put a cherry on top of this cake.
Suffice to say that 543 (5430) squares out with June 12th/13th.