The SPX is flat year to date.
However, 185 stocks have scored greater than 15% moves in both directions.
This is double the 81 names this time last year.
This level of dispersion has only been seen twice in the last 30 years—during the Dot-Com bust and the Great Financial Crisis.
AI names ramp while software names collapse.
This dispersion is what produces Hindenburg Omens indicating a high number of new 52 week highs and new 52 week lows simultaneously and a widening divergence in market breadth.
Multiple Hindenburg Omen signals have been registered in early February 2026 reflecting underlying weakness in the market.
There was also a cluster of HO’s in early November 2025 which coincided with the sharpest downdraft since the April 2025 low.
Not all HO signals lead to a crash, but few crashes have occurred without Hindenburg’s on the table.
In sum, the “Omen” has preceded some major stock market selloffs in the past.
While most all of Wall Street keys of price, time is more important than price as W.D. stated.
What about cycles?
Last week we noted the rare Saturn/Neptune conjunction in Aries, the first sign of the zodiac.
The last time this occurred was 6000 years ago at the dawn of civilization.
At the same time we are getting a very rage alignment of 6 planets this week.
Are these signs in the sky?
At the 1987 pre-crash high in late August there was a rare planetary alignment as well called the Harmonic Convergence.
Just after this week’s planetary alignment, we get a total blood moon lunar eclipse on March 3—near the 17th anniversary of the start of this bull market.
Is it just a coincidence that all these signs are appearing at the exact time we are on the brink of war with Iran?
Last weeks tariff volatility added confusion not clarity. On Thursday tariff rates ranged from roughly 10% to 50%, depending on the country. By Friday morning, certain measures were reset to zero. By Friday afternoon, a 10% global baseline reappeared. By Friday night, that baseline was revised again to 15% on a temporary 150 day basis.
Markets struggle to price a moving target.
But, policy turbulence did not create the weakness, it exposed it.
News is not the catalyst. The news breaks with the cycles.
When a market is structurally sound, it absorbs uncertainty.
When it is structurally vulnerable, volatility accelerates in keeping with the aforesaid dispersion.
The weight of evidence remains clear:
Leadership (Mag 7) has broken
Breadth continues to lag
Momentum has shifted
Rebounds are failing.
These are not characteristics of a healthy bull market consolidating for another advance.
They are the early hallmarks of a primary downtrend…one that I think is destined to take us to the 5760 region.
Why 5760?
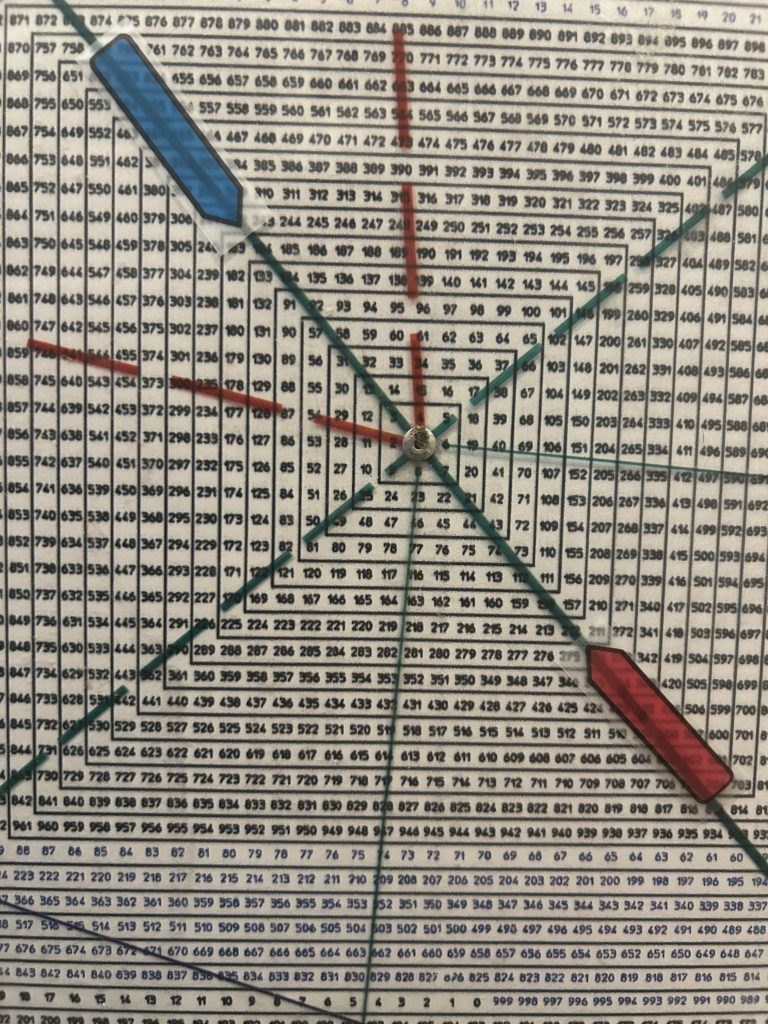
Anchoring the Square of 9 Wheel to 483 for the April 2025 low of 3935 shows that 360 degrees up is 575 or 5760.
Another 360 degrees up is 675 or 6750, a region that the SPX has found support this year three times.
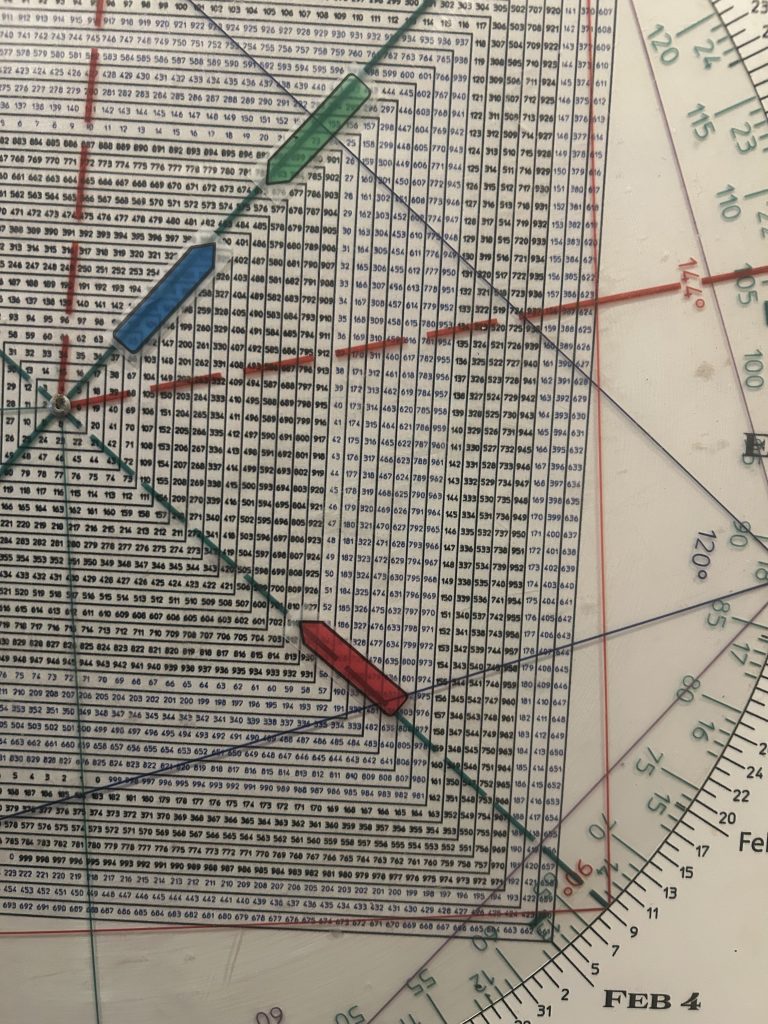
Another 90 degrees up from 675 is 701 or 7010—basically the all time ih at the end of January.
Was that a 90 degree Throw-Over on the Square of 9?
Breakage below 6750 will not just trigger a Rule of 4 Sell signal, it will break a key level on the Square of 9 Wheel.
Conclusion.
The Russell 3000 index comprises 2942 stocks with a total market cap of $76.4trillion, representing 98% of the U.S. equity market.
This week is the final big week of earnings with 681 companies in the index reporting.
The companies reporting have a combined market cap of $9.9 trillion.
NVDA reports Wednesday. It has a market cap of $4.61 trillion, while the other 680 companies have a total market cap of $5.3 trillion.
What does NVDA’s chart look like?
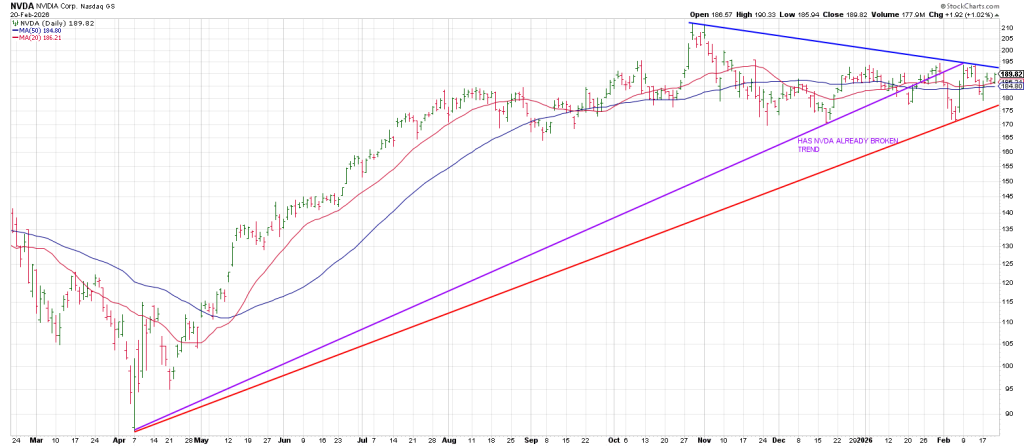
You can see NVDA has been range bound winding its way into the apex of a large triangle.
Resolution looks to coincide with the foresaid cycles due to exert their influence.
The broader question is whether NVDA has already broken trend…the purple Bottoms Line.
From the 212 high on October 29th, 360 degrees down is 156.
Given that NVDA has a triple bottom at 170, the question is whether a triple bottom break to 156 is on the table.
And if so, is that a flush out that perpetuates a rally phase if a Trap Door plays out. In other words a break of the triple bottom that sees NVDA Slingshot to the topside back up through the triple bottoms at 170.
180 degrees opposite 212 is 194 which defines the triple tops in NVDA’s wide and loose Slim Jim.
The other side of the sword is whether NVDA sees a knee jerk spike above 194 that reverses leading to a drop to the 156 region.
This week looks like resolution on many fronts is on the table.