“The nature of the game as it is played is such that the public should realize that the truth cannot be told by the few who know.” Jesse Livermore
“I will tell you my secret if you wish. It is this: I never buy at the bottom and I always sell too soon.” Baron Rothschild
“Da doo ron ron ron, da doo ron ron.” Da Doo Ron Ron, The Crystals
Nearly a century ago—well before he earned more than $100 million during the 1929 crash—Jesse Livermore returned repeatedly to one central truth of markets: leadership determines trend.
“As the leaders go, so goes the entire market.”
The strongest stocks are not merely participants in a bull advance—they define it.
The attract capital.
They sustain confidence.
They carry the averages higher.
But, when those leaders stop advancing—when they begin declining in persistent trends—the market itself has changed. Investors who refuse to recognize that shift inevitably find themselves fighting forces far larger than any single opinion or narrative.
Livermore was unequivocal. When leadership fails to confirm new highs, it is not a minor technical blemish. It is a decisive warning that the market’s internal engine is breaking down.
Market behavior follows the same law as physical motion” objects in motion tend to remain in motion. Trends persist.
That leadership has reversed from up to down since October 29, 2025 is not ambiguous. It is measurable, visible and increasingly decisive.:
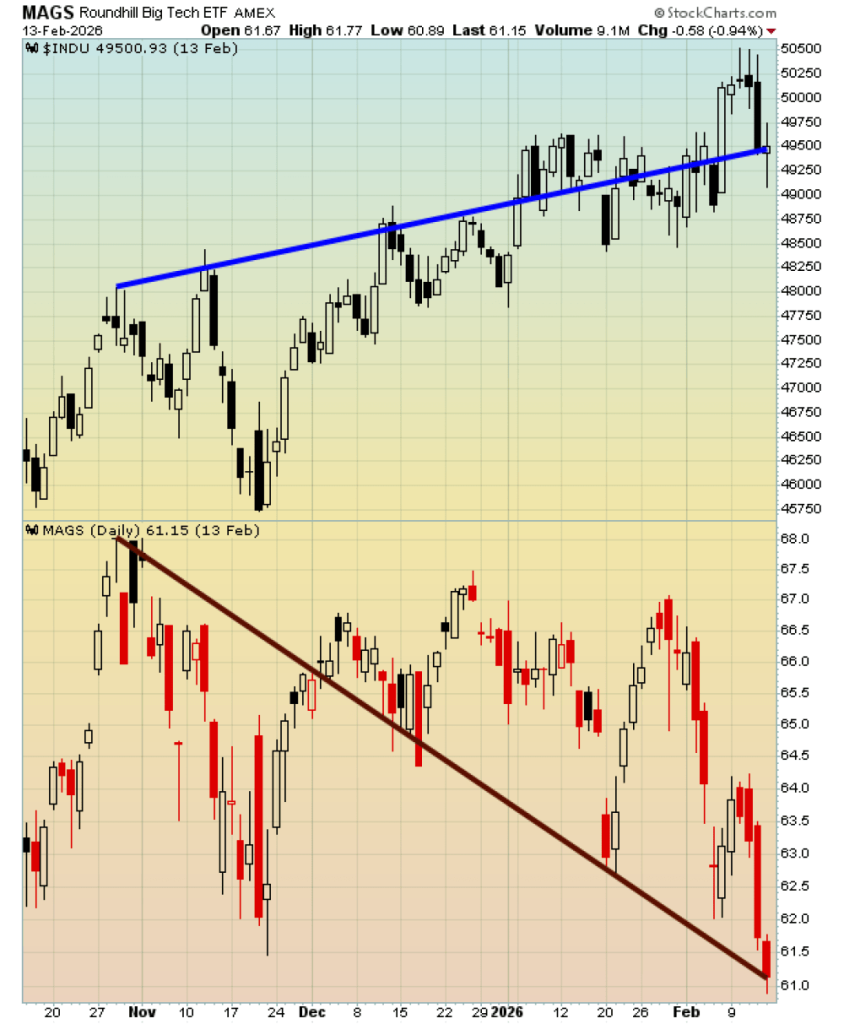
The Magnificent Seven and the NDX100 peaked on October 29, 2025 and are trending down.
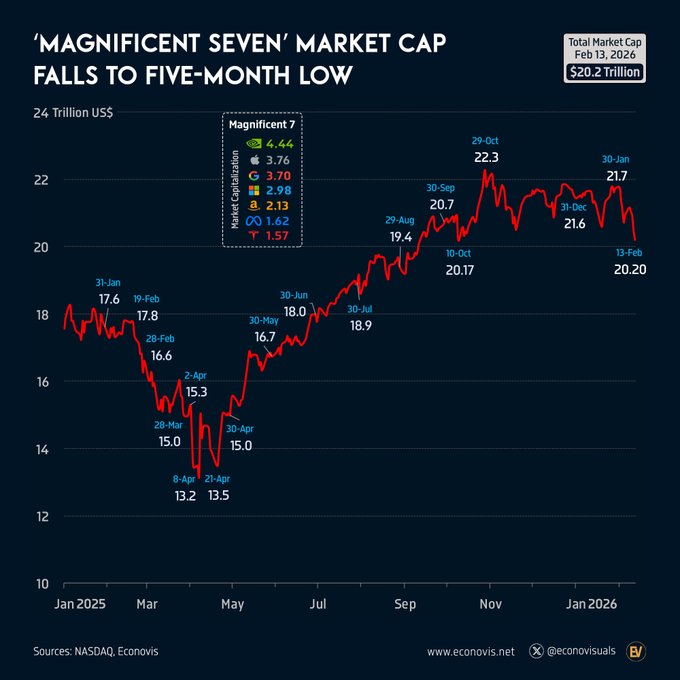
The former Magnificent Seven leaders, once the locomotive of the entire advance—are now the primary source of downside pressure.
While the averages attempted to hold up through rotation and selective strength, the internal deterioration has been unfolding for months. The divergence between headline index resilience and leadership collapse has resolved in favor of the latter.
Yet the refrain grows louder:
“This is just leadership rotation.”
“We’re seeing healthy sector redistribution.”
“The market is broadening out—this is healthy.”
Livermore depended on such reasoning. He understood that narratives provide liquidity. They create the very bid necessary for disciplined operators to establish positions in the opposite direction. At the opening stages of the deepest Bear Market in Wall Street history, the public’s conviction that declines were temporary provided him with opportunity.
Nearly a century later, the pattern is repeating. The cycle is repeating.
In Feb, 2026, as leadership trends have turned downward, public appetite for equities remains strong.
Demand feels limitless. Optimism remains reflexive.
But historically, that combination—technical deterioration beneath confident participation—has marked transition…not renewal.
Few recognize today that this seemingly insatiable demand offers something else entirely: opportunity on the short side at levels that, in retrospect, will prove advantageous.
Is it possible it’s different this time?
What is different is that the Algomatics know how to dial in specific levels to keep The Game going.
It’s no accident that the SPX has found support at the 6780 region three times now since January 20th.
The indices been a Stick Save Machine.
A few individual stocks have been virtual Whack-A-Moles on every dip.
Names include:
LITE. yesterday.
CIEN, Friday
COHR, February 5
WDC, January 30th
There are others, but you get the point.
But this is like 10 pounds of poop in a 5 pound bag.
Big money focuses on these relative strength torpedoes like a child’s magnifying glass on a leaf.
They have no choice: the performance mandate requires them to obey.
In sum, now we have glaring triple bottoms on the SPX.
They may perpetuate a test of all time highs.
I would not be surprised to see a nominal new high this week.
This ties to our idealized natural cycle of February 20.
February 20 is also a geometric market cycle of 90 days/degrees from the key November 20/21 low….just as the late January all-time SPX nominal new high was 90 days/degrees from the Primary High on October 29.
My expectation is that we get around a normal 10% correction starting before the end of February.
If October/January was a Primary High/Secondary High pattern on the dailies, it is possible that in keeping with yesterday’s charts we get another run up into the second half.
Cycles leave the door open to that possibility; however, the structure of the market from the March 2020 low suggests we have seen a culminating 5 Wave advance and that any ‘overbalance’
In price within the context of 5 impulsive waves down on the dailies confirms a 5th Wave high is in place.
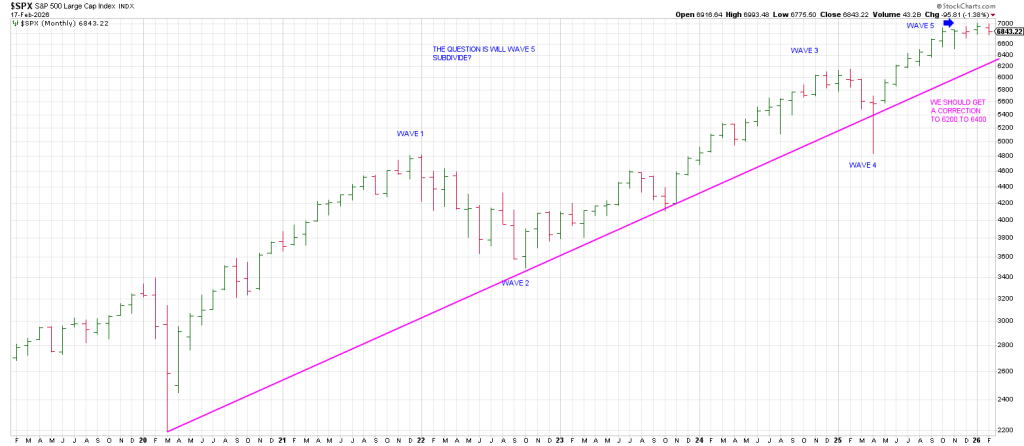
The question is does this 5th Wave subdivide following the likelihood of a downdraft to the 6200-6400 region?