“The reality is that financial markets are self-destabilizing; occasionally they tend toward disequilibrium, not equilibrium.” George Soros
“There’s no such thing as the goose that lays the golden egg forever.” Jim Simons
In January we flagged two natural/planetary cycles that synchronize with the potential for a major top in February 2026.
1) In an old pamphlet about the secret trading methods of W.D. Gann (no author named)
It states an eon is 22,228 years. This is an interesting number as 22, 228 divided by 360 is a Fibonacci fractal of 61.7. Taking a day for a year it is 22,228 days from Sept 3, 1929, to July 13, 1990. Two weeks later on August 2, 1990 Saddam Hussein invaded Kuwait starting the Gulf War. One of the upshots of the war was the start of Isis and Al Qaeda.
In reality it was the start of the modern age of terrorism.
Precisely on July 13, 1990, there was a Jupiter-Saturn opposition. W.D. Gann’s Chronocators were Jupiter and Saturn.
2) On February 20, 2020, a rage Saturn-Neptune conjunction occurs. It is a 36 year cycle.
This ties to the 1990 turn which was 36 years ago.
One-half this cycle is 18 years. 18 years ago was 2008 and the Great Financial Crisis.
This Saturn-Neptune conjunction is rare. It occurs a 0* Aries. Aries is the first sign of the Zodiac. It is W.D. Gann’s ‘Zero Point’ and the key to the Square of 9 Wheel.
There has been a Saturn-Neptune conjunction at 0* Aries as far back as 600 BC. It hit 2* Aries in 593 BC. 7 * Aries in 555 AD. 16* Aries in 232. The most recent was 11* Aries in 1703. But 0* has not happened in a VERY long time.
As you can see the current time frame is synchronous with the tops in 1929 and 1990.
Basically, Gann’s Master 60 Year Cycle.
The Japanese market topped in 1989 precisely 60 years from 1929.
2026 is a year of destiny based on the 60 year cycle as a secular bull market from 1949 ended in February 1966.
That 17 year secular bull market is mirrored by the 17 year bull market from 2009.
Back to 1990…below is a weekly chart from 1990 showing a double top followed by a 20% sell-off of 90 days/degrees into early October.
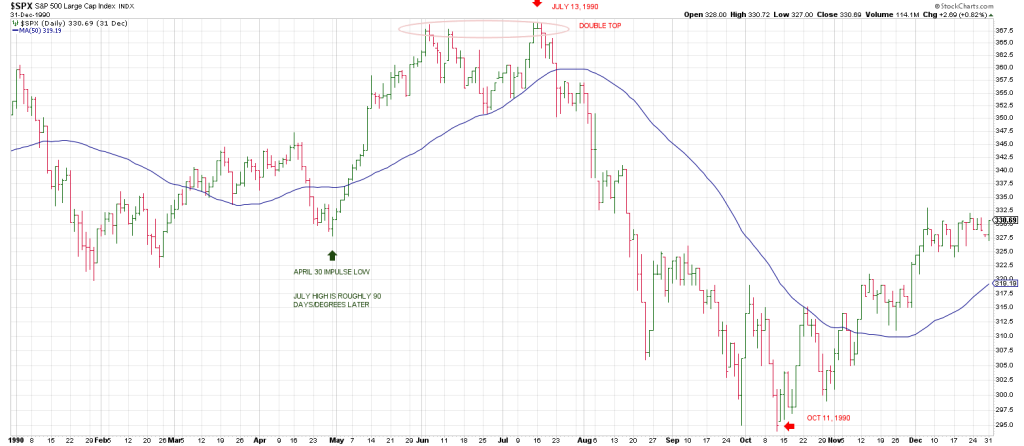
Ah, yes, October the culprit once again.
This anniversary date was to reverberate off a crash low in 1998 bear market low in 2002, the bull market high in 2007, the Primary Low (initial low in 2008), a major low in 2011, a major low in 2014, the start of the Christmas Crash in 2018, the bear market low in 2022, and 2 weeks from the start of a major upthrust in 2023.
W.D. Gann’s theory of the significance of anniversary dates seems much more than happenstance.
April is 180 degrees opposite October on the calendar.
This geometry between October and April often relates to market turns.
For example, April 1930 was the rally high following the October 1929 crash.
Throughout 2025 I pointed to a possible mirror image foldback between the year 2025 and 1929.
The Q’s struck a high on October 29, 2025 that has yet to be surpassed.
We have what may be a double top with the second high being late January, 90 days/degrees from the October 29 peak.
Does it remind you of the double top in 1990?
Checking a weekly QQQ, the big question is whether the QQQ is carving out distribution or consolidation prior to a new upleg. From my perspective, the action of the internals and the Mag 7 suggest distribution.
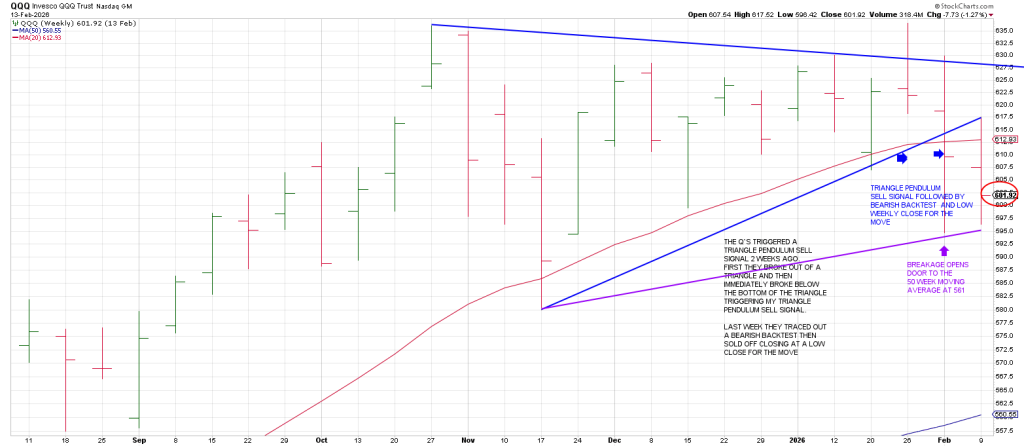
The Q’s have triggered my Triangle Pendulum sell signal on a weekly basis.
They broke out of a triangle and then quickly broke below the bottom of the triangle triggering the signal.
Now they are perched on a trendline from the important November low.
Breakage opens the door to the 50 week moving average at 561.
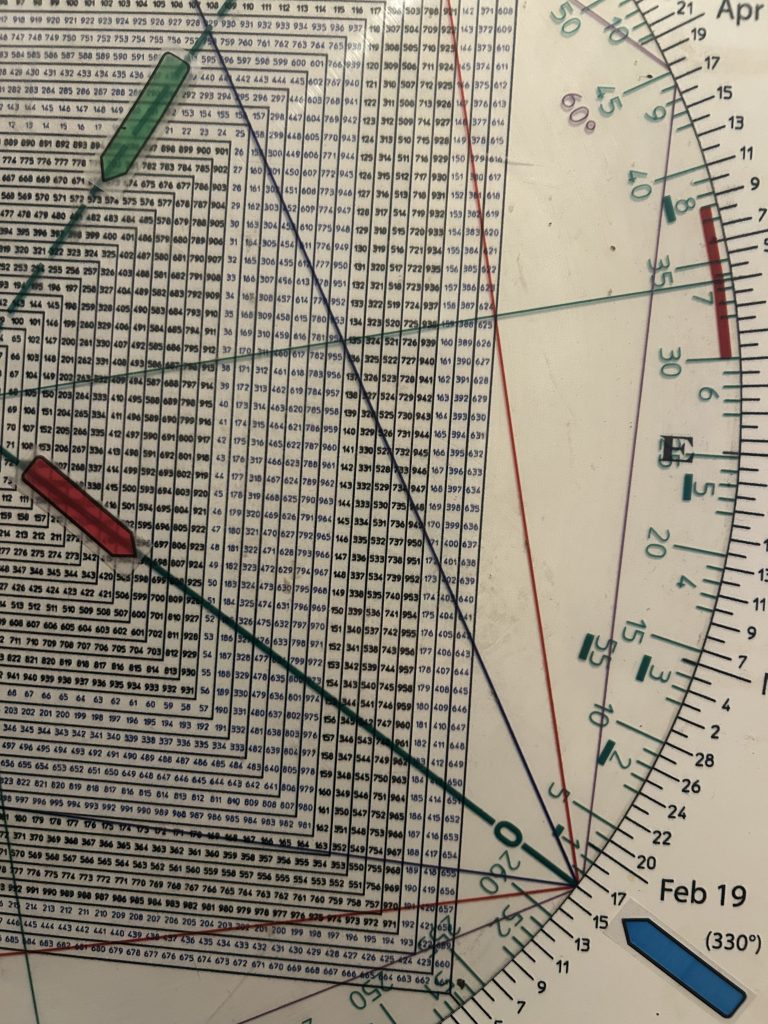
On the Square of 9 Wheel, 561 aligns with April 20 (the week of).
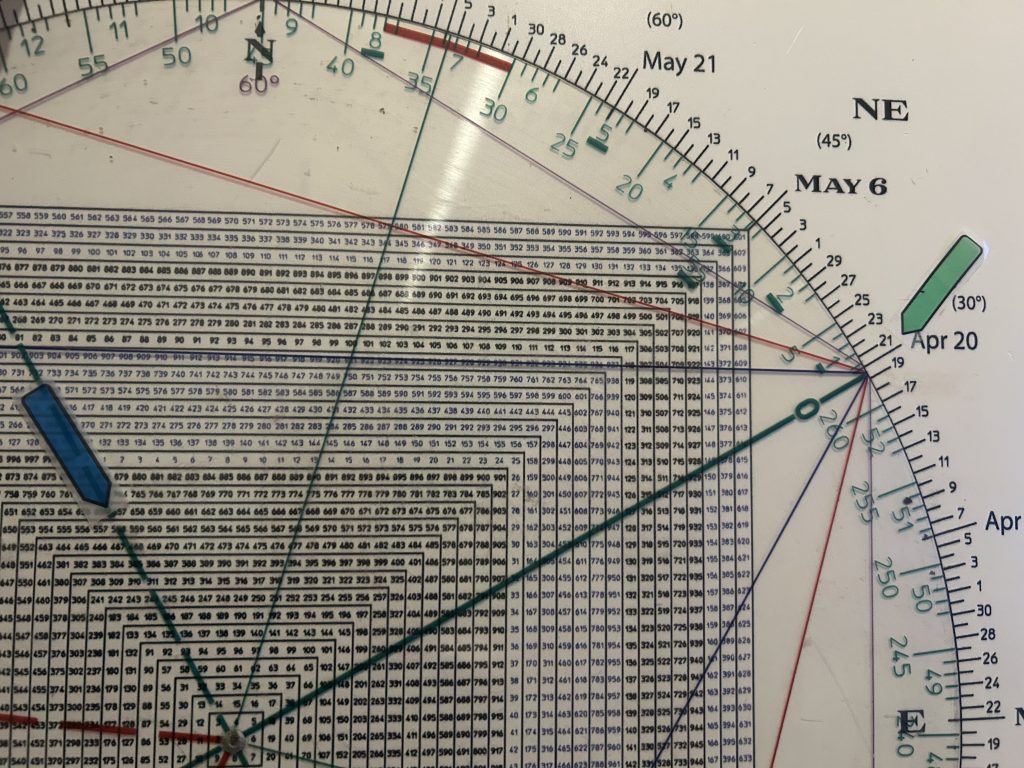
Late April is 180 degrees straight across and opposite the late October peak and 90 degrees/days from the late January peak.
The presumption is the Q’s will drop to at least the 561 region before the end of April.
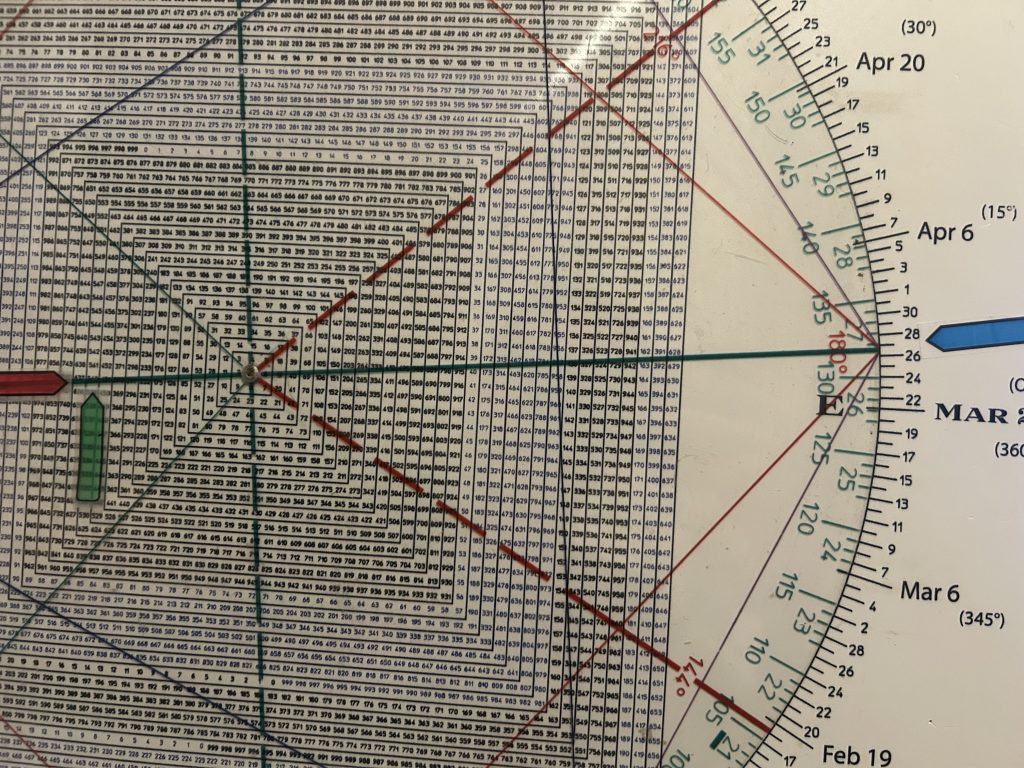
If the Q’s drop below 561 in the interim the door is open to the 540 region.
This is a full 360 degree price cycle down from the all-time high.
It is the February 2025 high.
The geometry is perfect: the QQQ found high on October 29, 2026— 360 degrees up from the February 2025 high.
With 637 straight across and opposite March 27, there is potential for a drop to 540 in the next 7 weeks…as 540 is 360 degrees down and squares-out with March 27.

Square of 9 Wheel
Purchase your own Square of 9 Wheel. Shipping to US only. Contact Jeff for shipping outside the US.
For those new to Hit and Run Trading you can grab a free ebook about how the Sq of 9 Wheel works at cooperhitandruntrading.com
Here’s what I’m watching for:
The Q’s turned the important 3 Day Chart down on February 4 with 3 consecutive lower daily lows. Then they turned the 3 Day Chart back up 3 trading days later on February 10.
That turn up defined a high immediately—a bearish signature.
When the trend is down a turn up in the 3 Day Chart will often define a pivot high.
Then Friday the 3 Day Chart turned back down as the Q’s tested the Feb 5th low.
Trade below the Feb 5th circled 3 Day Chart low of 584.76 is a blaring sell siren…especially on a gap. It opens the door to the 200 day moving average at 581.
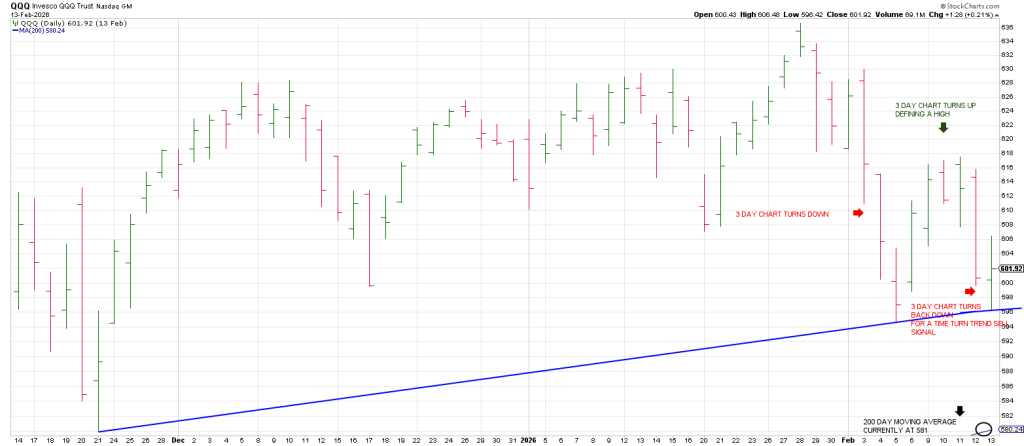
With today aligning with 597 on the Square of 9 Wheel, (where we are overnight) breakage below could get very ugly quickly…with 573 squaring out with this week.
Bottom line the market needs to hold this opening range or potentially a Trap Door opens.
Let’s look at a weekly SPX within the context of the 5 year cycle (half the Decennial Cycle).
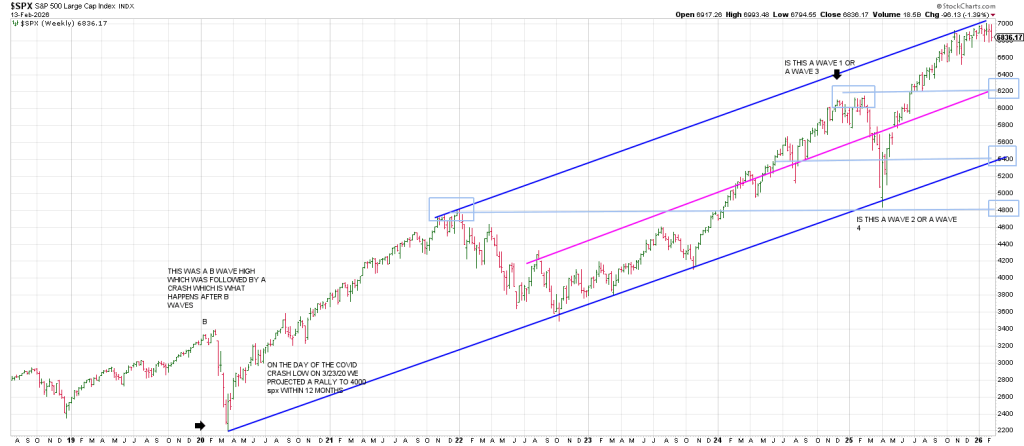
I connected the March 2020 low and the October 2022 low. The Bottoms Line hits the April 2023 low and the October 2023 low as well as the big April 2025 low.
I then paralleled a line from the January 2022 top. It hits the tops in October 2025 and January 2026.
Noteworthy is the double top signature and the vast region below until the bottom of the trend channel A decline to this lower parallel trend channel takes the SPX down to 5400.
However, keep in mind that there is a Breakaway Gap at 5700 from May 2025 as well as horizontal support at 5600. As well the as we move forward the bottom rail of the trend channel will be higher and could be at 5400 by late Spring.
A mid-channel line (magenta) comes in at around 6200 which ties to the February 2025 high.
Prior resistance should act as new support so if a sell-off to 6200 plays out any ensuing break below that level will likely see accelerated momentum to the 5600-5400 region.
Below that 4800 is support.
In sum, February 2026 is potentially a big deal.
It is worthwhile reviewing a report we wrote this year simply titled, February 2025.
On the above weekly SPX, the question is whether the Feb 2025 high was a Wave 3 high followed by a Wave 4 decline into April 2025 with a culminating Wave 5 high in progress OR
whether the Feb 2025 high was a Wave 1 followed by a corrective Wave 2.
If so that means the decline I expect of 7 to 10% will be a Wave 4 with the grand finale in the second half of 2026.
Whatever destruction occurs in 2026 sets up 2027 for a Bear Raid.