“No one knows, she comes and goes.” Ruby Tuesday, The Rolling Stones
If you listen to the mainstream financial media you will be told that the DJIA closed at a record high on Tuesday.
While that is true, it is hardly the whole story.
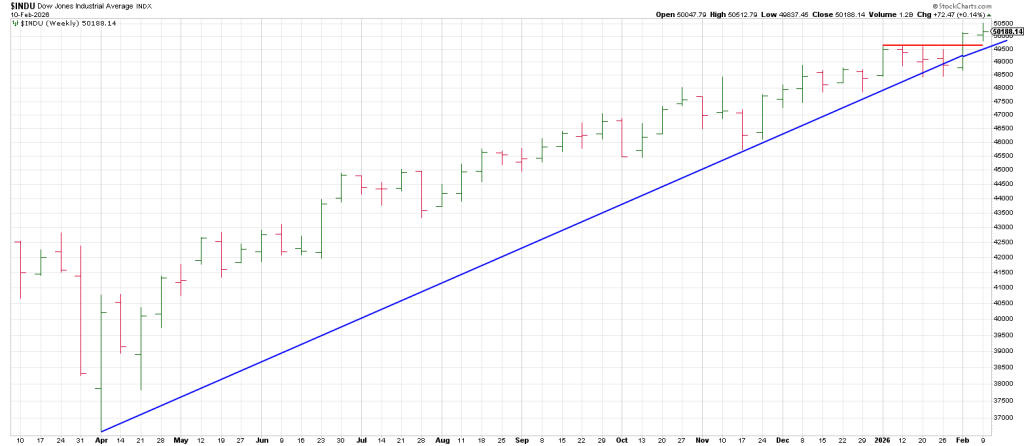
For one Tuesday the DJIA left a Lizard sell signal. It ran up to a new 10 day high (in this case a new all-time high) and tailed off with the open and close near session lows.
The MSM also flashed a headline yesterday, “Will Bitcoin Crash?”
Too absurd to comment.
Tuesday’s record close in the DJIA came with a glaring asterisk.
The most important market relationship we have been tracking has now reached a fresh extreme.
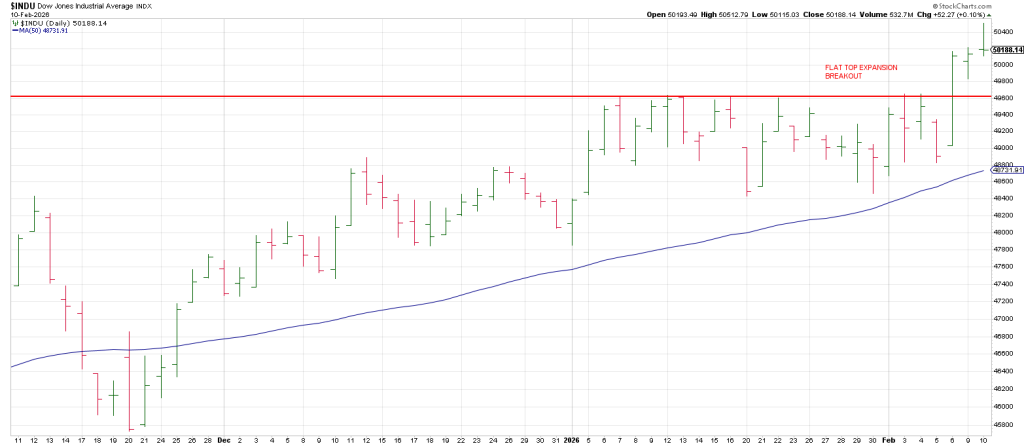
Since October 29, 2025, the DJIA has continued to grind higher, repeatedly setting new all-time highs.
Over that same period, the former leaders of this bull Market—the Mag 7 —have been locked in a persistent downtrend.
Tuesday crystallized that divergence.
The DJIA advanced another 52 points while closing at yet another record high, yet, beneath that surface strength, the Mag 7 fell another 0.16%, extending a decline that has now reached 7% since October 29…the 96th anniversary of ‘The Big One’ in 1929.
In contrast, the DJIA is up roughly 4% over the same period.
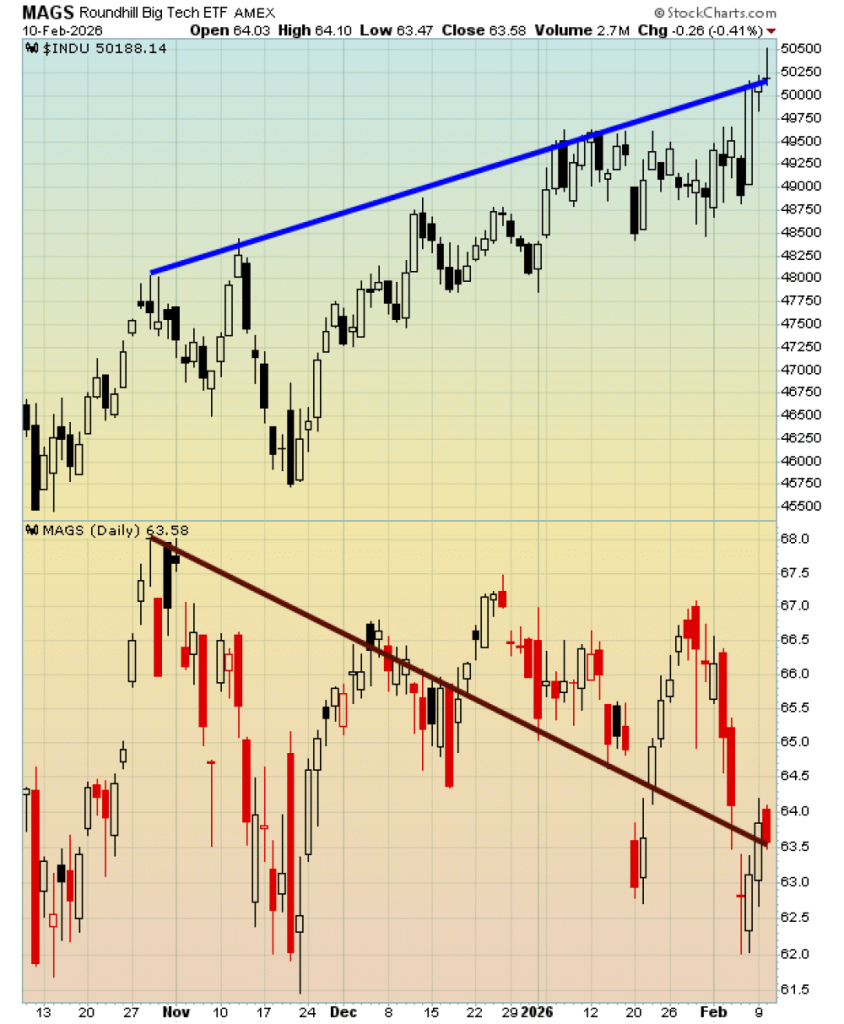
This is NOT rotation. It is deterioration.
Of course you could argue that there is a “new” Mag 7.
SNDK
LITE
MU
CIEN
WDC
TER
LRCX
If these are not a new breed of Mag 7 then perhaps they are the Last of the Momentum Mohican’s.
It must be said that of the above names, LRCX, WDX and MU each have Charlie’s Angels sell patterns—3 “tails” in close proximity—typically a sign of distribution.
Only LITE, CIEN, and TER are holding onto their runaway uptrends.
The closing price high for the DJIA in 1929 was 381.
Maybe something, maybe nothing, but 381 is 180 degrees straight across and opposite early February.
If the DJIA reversal on Tuesday follows through on the downside, this may synergistically link the two years, 1919 and 1929.
Not to throw water on Ed Yardeni who Monday said “we are in the Roaring 2020’s and the DJIA will hit 70,000 in 2029.
I’ll take the other side of that call.
If he proves to be correct it won’t happen without an intervening debacle.
What those bullish of the market call “rotation” will over coming months/years be seen for what it is “rot”.
Markets do not sustain durable highs when leadership is deteriorating.
As they say “dance with the one who brung ya”.
Historically, former leaders do not go quietly into that good night; they lead markets lower.
A general is a general is a general.
That process is clearly underway.
The above chart makes the point undeniable: one index levitating on narrowing participation while the stocks that powered the prior advance unwind in plaint signt.
The internal damage was gain visible Tuesday.
While pundits focus on another record DJIA close, NAZ breadth was negative, with 275 more stocks declining that advancing.
This occurred even as the index’s most influential names—the very stocks that once defined market strength—continued to erode.
This is how late-cycle markets unravel: not with dramatic crashes at the highs, but with widening fractures between price and participation, between headlines and reality.
Record highs achieved under those conditions are inherently fragile, vulnerable to even modest shifts in sentiment or liquidity, or an event.
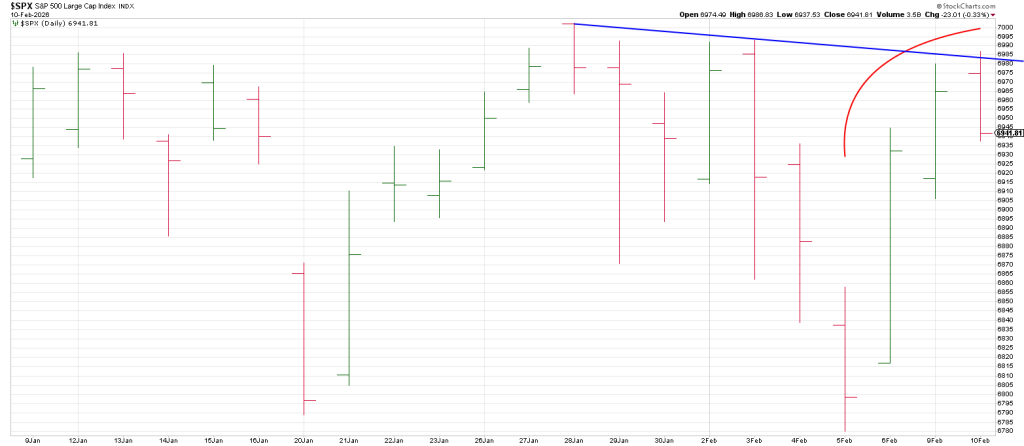
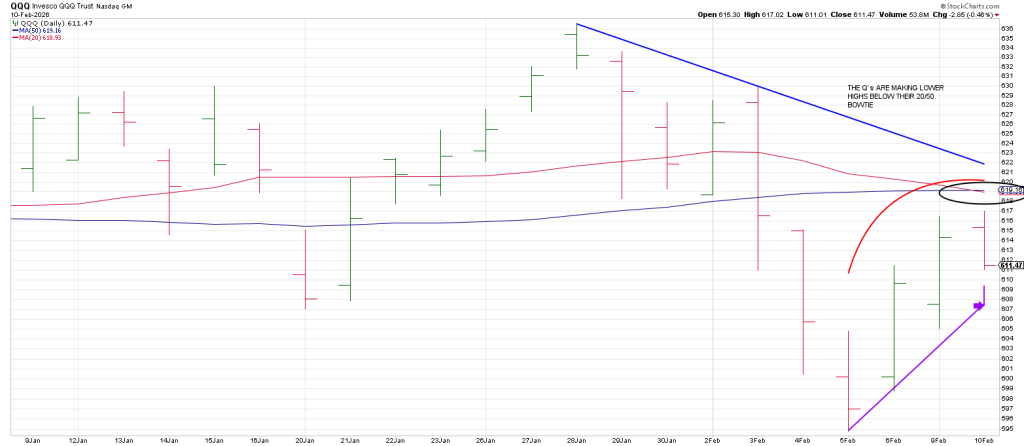
Yesterday we noted trade in the SPX and QQQ above Monday’s high would turn their respective 3 Day Charts up.
That occurred and both indexes reversed.
From a high of 6986, the SPX closed at 6941 down 23 points.
From a high of 617 the Q’s reversed to close at 611.47.
The current market has a similar synergy to 2007. The Primary Top in the DJIA in 2007 was July 17. The Secondary Top for the DJIA was on October 11—61 trading days later.
The orthodox or Primary High for the DJIA currently was November 12, 2025.
Today is 61 trading days later.
As we know the DJIA left a signal reversal bar on Turnaround Tuesday.
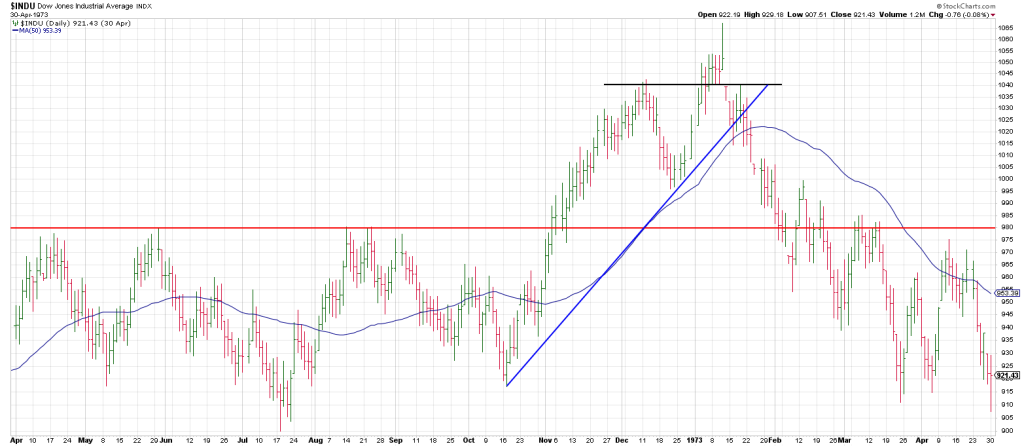
The DJIA staged a short-term breakout in January 1973. It was the top preceding a major bear market.
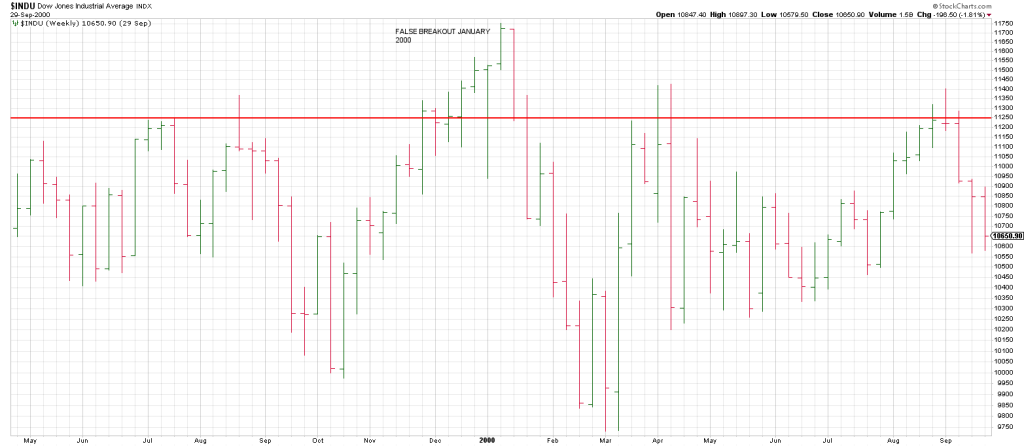
The DJIA staged a short term breakout in January 2000. It was the top preceding a major bear market.
If the DJIA should slide back below the recent breakout at 49,650 and follows through, caution is warranted.