Below is a daily LITE which was a long swing idea for Monday.
It triggered us long at 560.
We sold 1/3 at 581.50/
Our trailing stop was hit at 583.
Trim and Trail, Hit and Run.
Let’s walk through the setup.
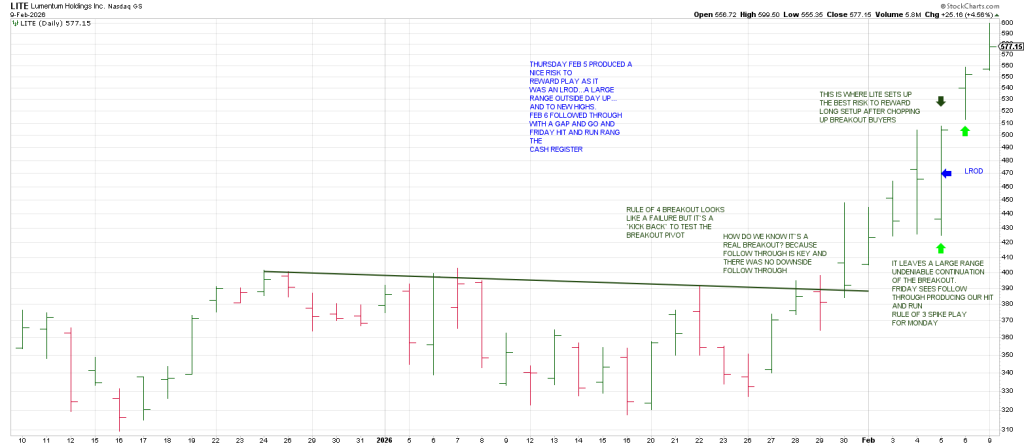
LITE left a Rule of 4 Breakout (a breakout over triple tops pm January 30 but tailed off leaving a large range signal reversal bar.
It looked like a failed breakout but often times stocks will ‘kick back’ to test the breakout pivot which is what happened with LITE.
A tell that it was a genuine breakout was that it never followed through from the Jan 30 reversal.
It left a large range Undeniable’ continuation of the breakout on Thursday and Friday saw upside follow through producing out Hit and Run Rule of 3 Spike play for Monday, February 9.
In sum, Thursday Feb 5, produced a nice risk to reward play as it was an LROD …a large range outside day up (and to new highs).
Feb 6 followed through with a Gap and Go and Monday Hit and Run rang the cash register.
Hit and Run members are long SHOP from last week at 114.50.
SHOP had massive volume on the Feb 3 plunge suggesting a Selling Climax at least for the near term.
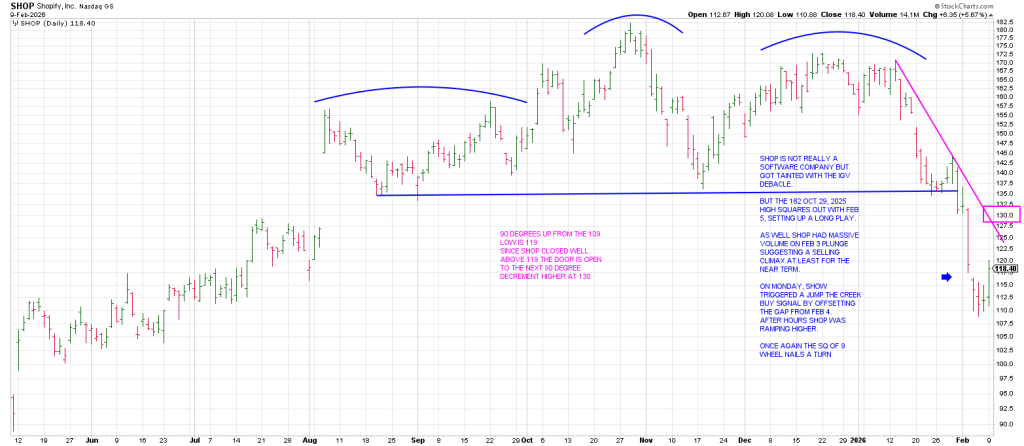
The key was that the 182 Oct 29 high squares –out with Feb 5th, setting our long play.
On Monday SHOP triggered a Jump the Creek buy signal by offsetting the gap from Feb 4.
After hours show was ramping higher closing at 122.50 (+ 10.40).
The Square of 9 nailed the turn.
90 degrees up from the 109 low is 119.
Since SHOP closed well above 119, the door is open to the next decrement of 90 degrees higher at 130.
Below is a daily MU. Before the open we flagged MU as a short.
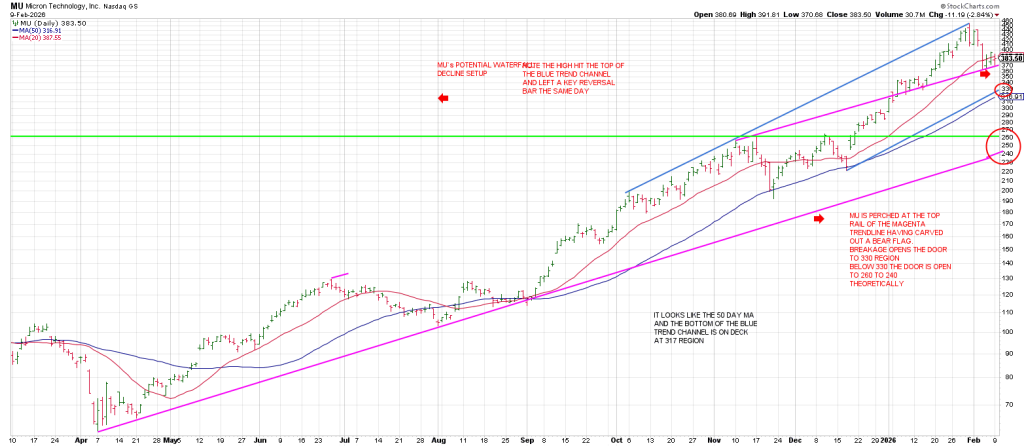
Notice that the high at the top of the blue Tops Line was a Key Reversal Day.
Currently MU is perched at the top rail of the magenta trend line having carved out a Bear Flag.
Breakage opens the door to the 330 region.
Below 330 the door is open to 260 to 240 theoretically.
This is a trend line from the April low.
On Friday, ORCL left an NR 7 Day, the narrowest range in 7 days.
These contractions in range typically see an expansion in range in the next few days.
On Monday morning before the open on the Hit and Run Private Twitter Feed ORCL was flagged as a long.
OCRL exploded after gapping up.
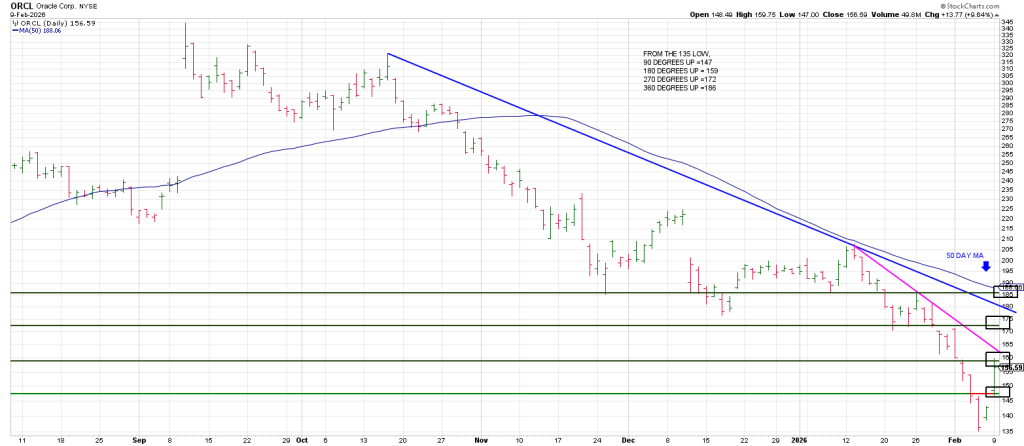
From Friday’s 135 low:
90 degrees up = 147. ORCL knifed through 147
180 degrees up = 159. ORCL struck a high of 159 on Monday.
270 degrees up = 172 where there is an open gap from a little Bear Flag.
360 degrees up = 186 which ties to the declining 50 day moving average.
Notably the last time ORCL tested its 50 day line was on January 13 which produced the last leg down.
You’ll notice we don’t use any indicators on these plays.
Our belief is that indicators are more descriptive than predictive.
The Square of 9 Wheel is predictive.
Pattern is predictive.
Observation is predictive. After the ‘Wheel’ the most powerful tool is observation—looking for relative strength when the market is weak or selling off intraday.
Or relative weakness, when the market is strong.
Speculation is observation, pure and experiential. Thinking isn’t necessary and often just gets in the way.
Below is a daily QQQ.
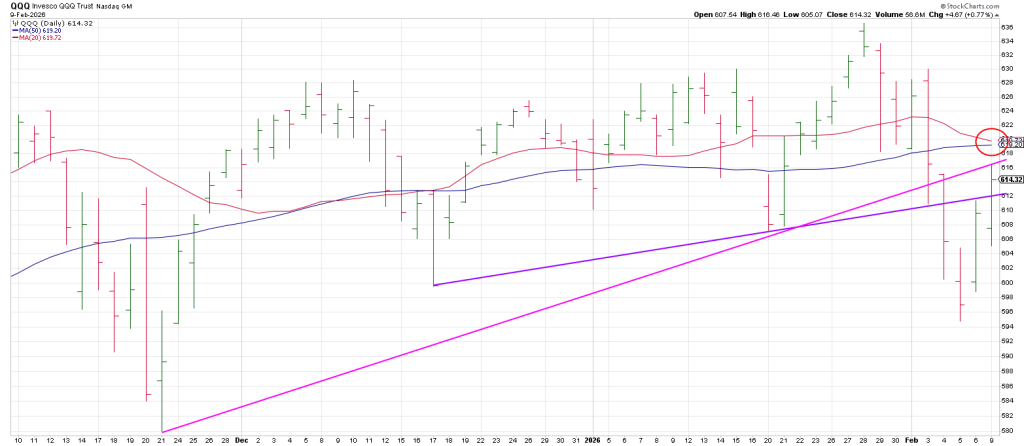
The Q’s turned their 3 Day Chart down on February 4.
Yesterday it carved out two consecutive higher daily highs producing my Minus One/Plus Two sell setup.
This is because 3 consecutive lows satisfies the Minus One part of my Swing Method.
Any time you get 2 consecutive higher daily highs when the 3 Day Chart is pointing down satisfies the Plus Two part of this Swing Method.
As well, just above is a 20/50 Bowtie, a ‘pinch’ of the 20 and 50 day moving averages.
Yesterday the Q’s backtested a broken trend line from the November 20/21 low.
However, the Q’s cleared a broken trend line connecting the December 17 and January 20 lows.
Breakage back below the trend line from the Dec and January lows puts defense on the field.
Trade above Monday’s highs today will turn the important 3 Day Chart back up —in the region of the 20/50 Bowtie.
It’s a pretty short setup.
Caution is warranted if the Q’s rollover from that juncture.