“Everything is going in the wrong direction
The doctor wants to give me more injection” Connection, Rolling Stones
Yesterday we showed the chart below of the SPX’s TWO Rising Wedges.
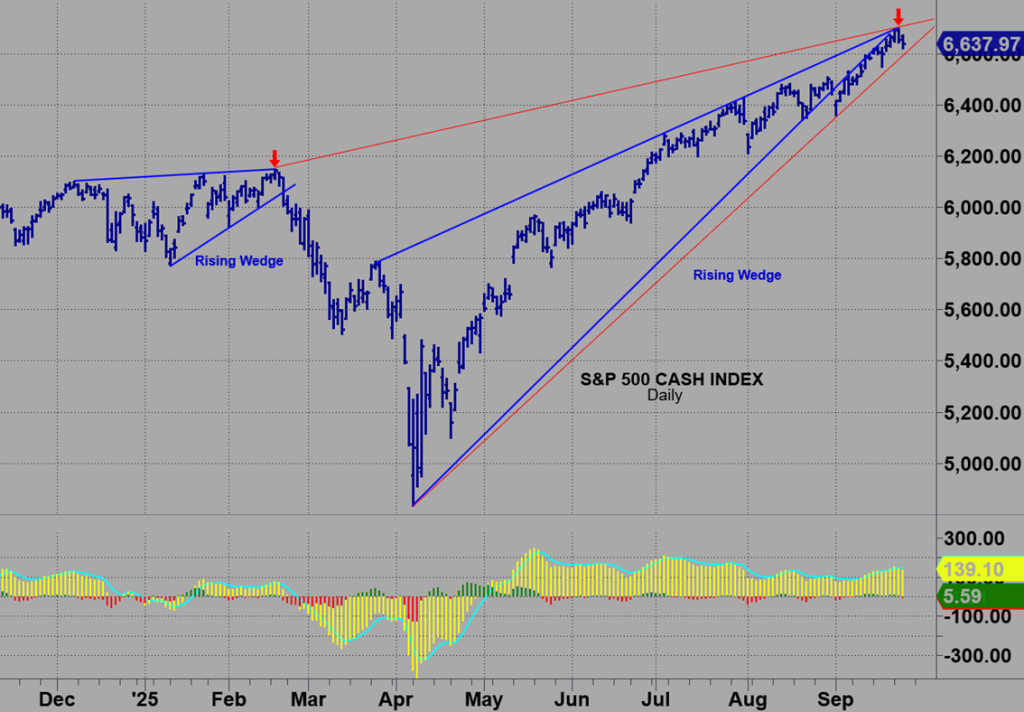
The Tops Line of the first Rising Wedge (red) starts at the Feb 2025 high.
The Tops Line of the second Rising Wedge (blue) starts in March in the middle of the spring downdraft.
With Wednesday’s reversal from a record high the SPX is threatening to break the red Rising Wedge.
Declines emanating from Rising Wedges or Ending Diagonals are typically fast and sharp.
The expectation is this will be no different.
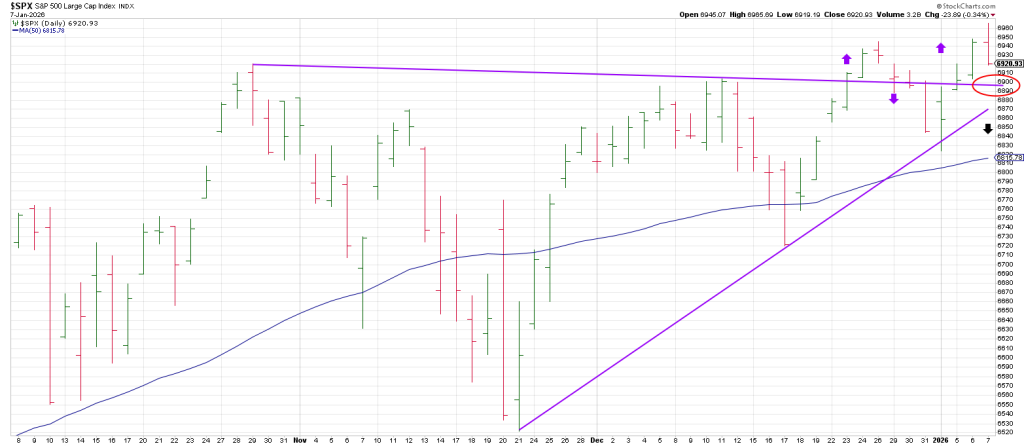
This week should tell the tale because the SPX broke out from a trend line from the October high on December 24 and failed and then broke out again on Tuesday. It looked like the second mouse would get the cheese for the bulls; however, given yesterday’s signal reversal bar is on the threshold of another failure.
A second mouse should get the cheese for the bears.
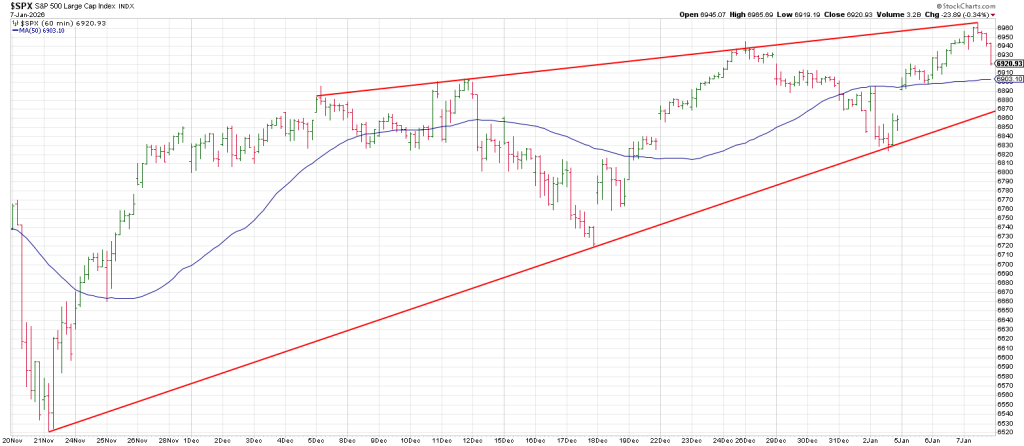
Drilling down to an hourly SPX from the important November 21 low shows a bearish reversal of fortune will play out on breakage below the 6860-6870 region.
For its part the DJIA closed at a record high on Tuesday but left a Gilligan sell signal yesterday by gapping up to a new 60 day high and closing at/near session lows.
Still, the Q’s remain below their October 29 record high.
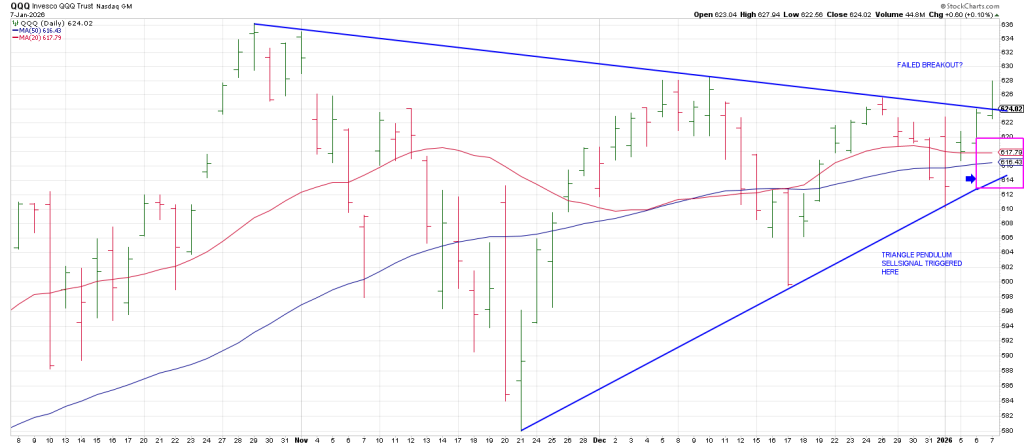
They broke out of a symmetrical triangle Wednesday morning but tailed off leaving a Lizard sell signal which should be an indication that a drop back into the triangle is on deck.
That’s a yellow flag.
A failure back below the bottom of the triangle triggers what I call a Triangle Pendulum sell signal.
Allow me to explain. A Triangle Pendulum sell signal occurs when an item breaks out the top of a triangle and them quickly reverses to drop out the bottom of the triangle.
We are not yet testing the bottom of the triangle but in my experience when price breaks out and them immediately reverses back into the triangle it is a warning that a failure below the bottom of the triangle is on deck.
Fast moves come from false moves is the blaring warning.
It is fitting that the SPY struck a high of 693.96 on Wednesday before reversing.
After the close a fellow trader and Hit and Run member sent me the following note.
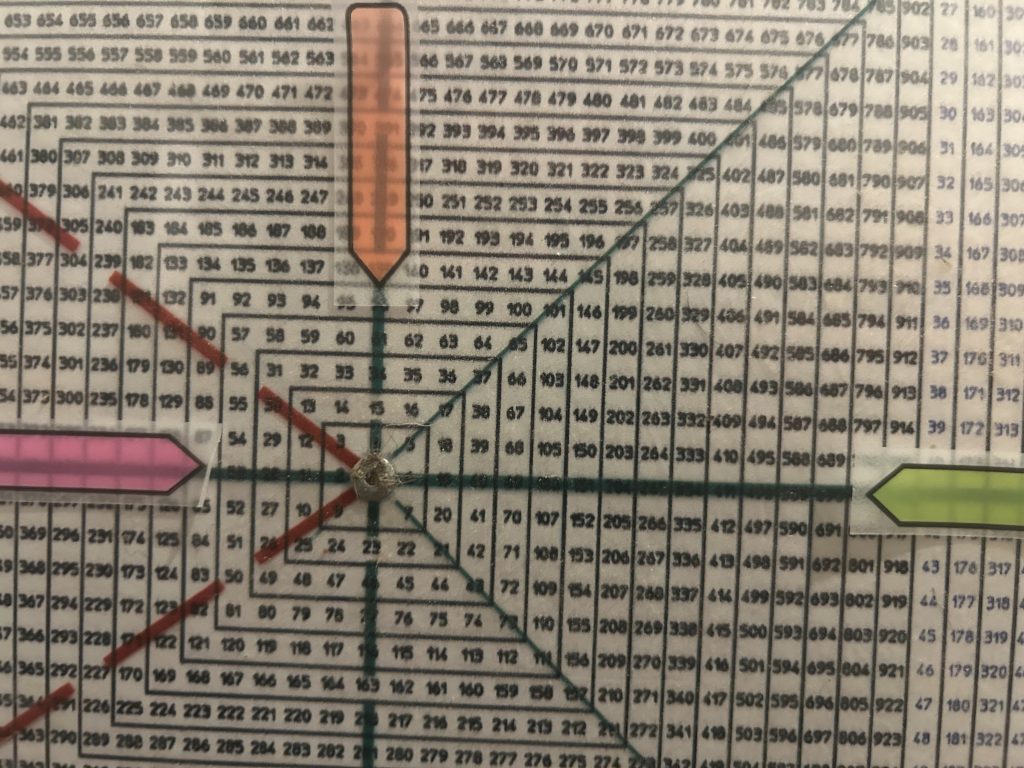
693 squares the 666 SPX bear market low from 3/6/09.
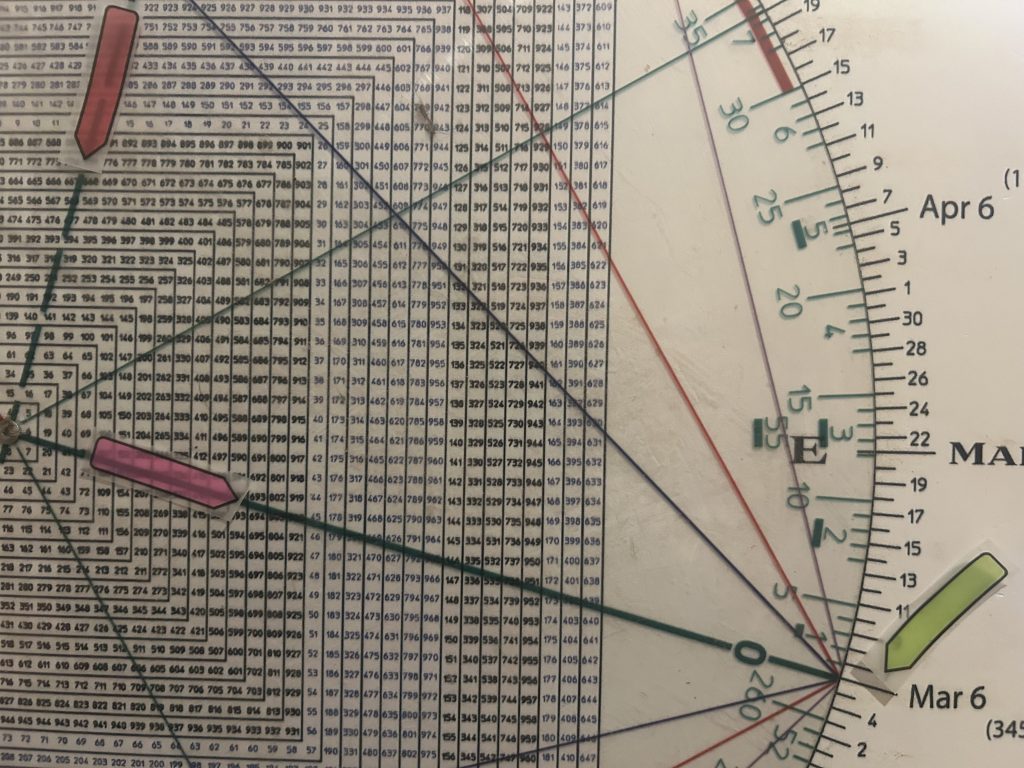
Maybe something, maybe nothing, but Nicola Tesla believed 3 6 9 held “the key to the universe” due to their presence in natural patterns, energy and vibration.
As well, it is fitting that if the market is cobbling out an important top that the SPX closed at 690 (rounding).
As offered in yesterday’s report, we are 53 years from the January 11 false breakout top in 1973 which heralded a near two year bear market decline of 50%.
53 is straight across and opposite 690 on the Square of 9.
53 squares out with 96.
We are 96 years from 1929.
This synergistically relates two of the biggest tops in the last 100 years, 1929 and 1973 with this 6900 region that the SPX has been trying to clear for two months.
How many attempts does the SPX get before it retreats?