The following chart is a daily Bitcoin from the October 2022 low produced on Friday January 2, 2026.
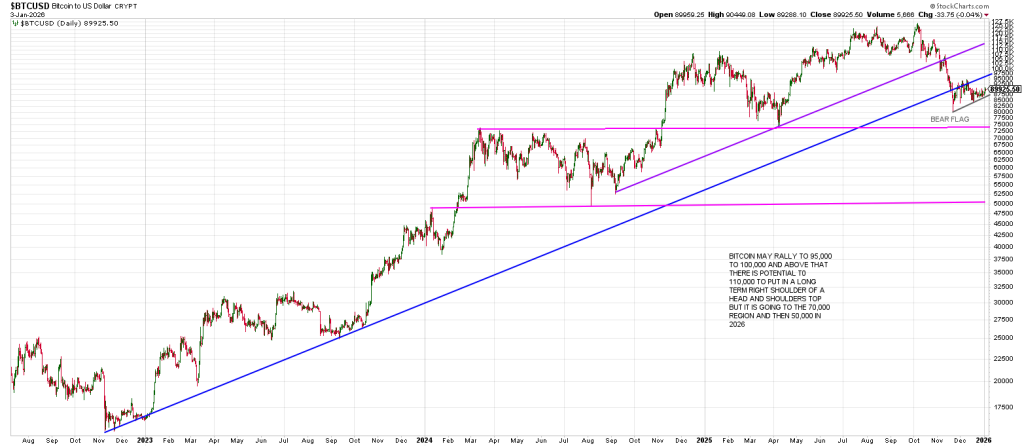
In October 2025 we flagged a Megaphone Top in Bitcoin at 128,000. Guess what, bitcoin dropped to 80,000 in late November.
1) Notice the Rule of 4 Sell signal, the broken purple 3 point trend line, from the summer of 2024 was broken with authority in October 2025.
2) Bitcoin quickly violated the long term blue Bottoms Line from the October 2022 low triggering a larger Rule of 4 Sell signal.
3) It has been working on a Bear Flag for over a month.
Our projection off the all-time high was 87,000.
This is a 360 degree decline on the Square of 9 Wheel.
Bitcoin undercut 87,000 sliding an additional 90 degrees to 80,000.
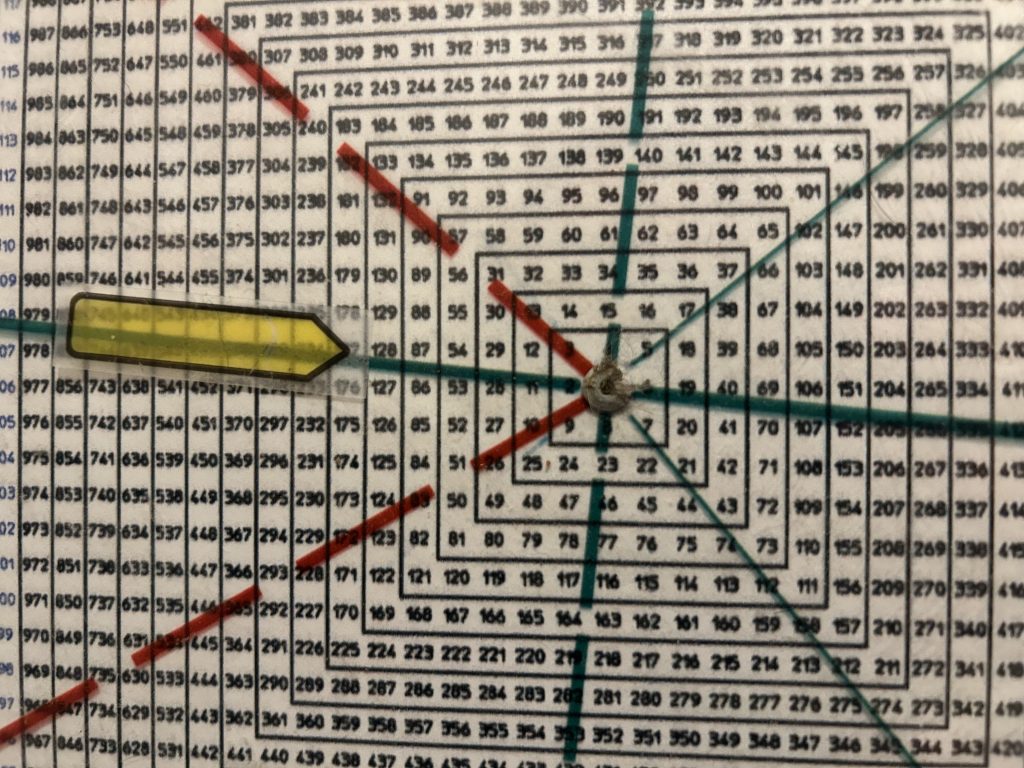
Breakage below 80,000 opens the door to 540 degrees down from high which is 70.000/
The geometry of this 70,000 region is proved by the March-June 2024 highs and the March 2025 low (top magenta horizontal line).
A failure below 70,000 opens the door to 50,000 with 54,000 aligning with 720 degrees or two full price cycles down from 128,000.
Bitcoin rallied on Monday in the context of its Bear Flag and may extend to the 95,000.
Above that there is potential to 100,000 to 110,000 which is a backtest of the blue Bottoms Line.
I’ll believe it when I see it.
Be that as it may, the next rally should produce a Right Shoulder of a large Head and Shoulders Top.
The downside projection from the H&S is around 30,000…the highs in 2023.
If Bitcoin should trade back into the Bear Flag (below 92,000) caution is warranted.
Drilling down to a daily Bitcoin from the 2025 low, shows the Megaphone Top we flagged in September.
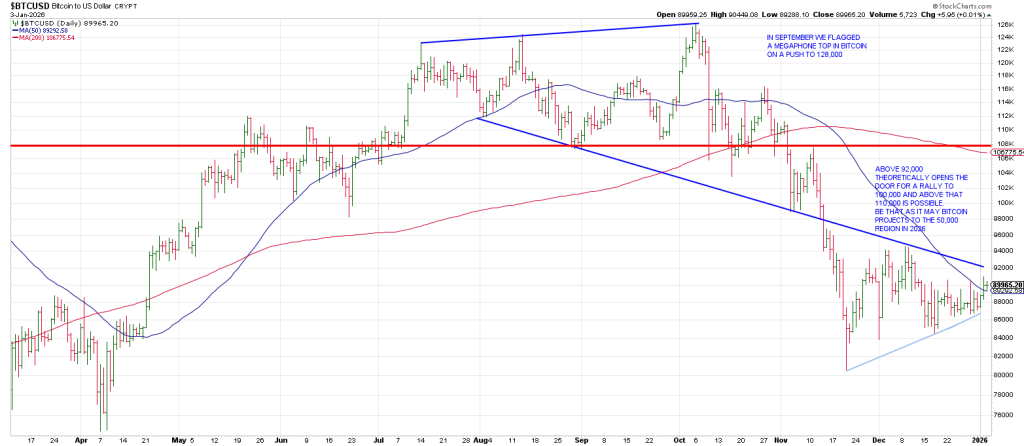
Bitcoin has pushed above the top of the Bear Flag as suspected.
A 90 degree rally off the 80K low equates to 90,000.
A 180 degree rally gives 99,000.
Notice that Bitcoin plunged when it broke the Neck Line (red) of a smaller Head and Shoulders top in November.
That break produced a projection to 88,000.
In sum, Bitcoin looks like it carved out a 5 Wave decline from its October high and is in a Wave 2 countertrend rally.
The next leg down will be a dramatic Wave 3 debacle.
Below is a weekly silver from the 2008/2009 low.
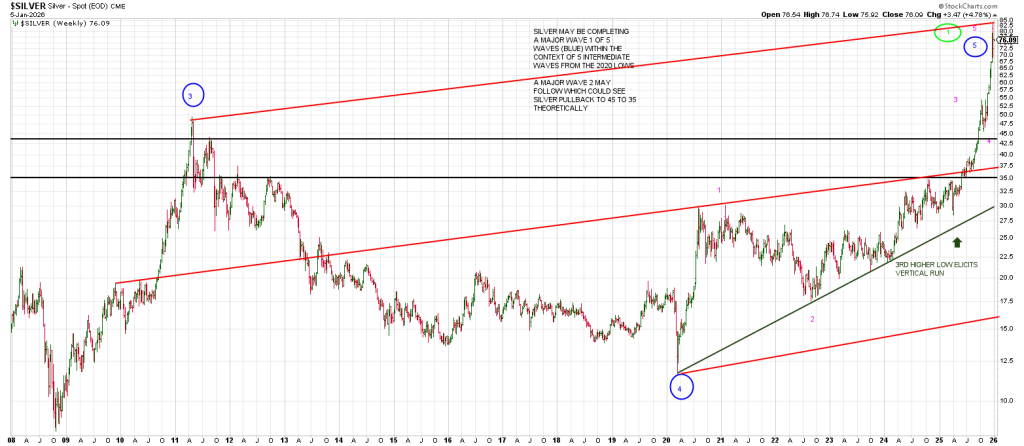
My take is the advance into 2011 was a Wave 3 followed by a Wave 4 down into 2020.
Silver went vertical when it broke above the middle red trend channel.
The geometry of the channel is proven as the top of the channel connects the 2011 high and the current high.
Notice the parallel line from the 2020 low.
Is it possible a bust correlated to a market bust could see a drop to the 16 region if 36 to 37 fails?
If the stock market should crack, people will sell what they don’t want to.
I don’t think there were many, if any, market participants in 2011 who thought that silver would embark on a 9 year bear market down to 12.
Never confuse your best interests with your position.
That said, I think the recent vertical run id putting in a 5th Wave high which in turn is a larger Wave 1 high (green).
This suggests a large correction is on deck sooner than later which will see a large Wave 2 pullback.
Theoretically that pullback could see the 45 region. Approximately a 50% pullback from the current high struck recently.
Below is a daily SPX from late November 2024 showing the A B C correction into April 2025.
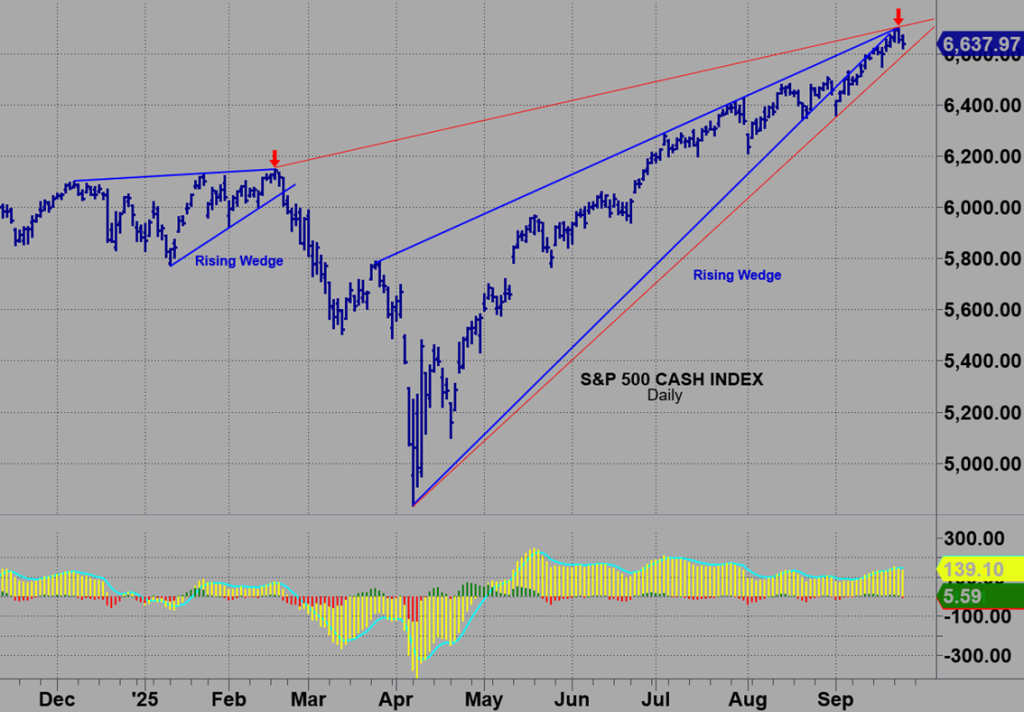
The large blue Rising Wedge was broken in September and the SPX was grinded back up into the bottom of the apex of the Rising Wedge.
The red lines also form a Rising Wedge. I connected the April low and the early September low for the bottom of the red Rising Wedge.
Then I connected the Feb 2025 high with the current high producing the top line of the red Rising Wedge.
Arguably, connecting the February high to the current high is arbitrary.
Except for one thing. It ties to the intersection of the two blue lines.
The geometry works.
Notice how sharp the drop was following the early 2025 Rising Wedge.
That Rising Wedge was relatively small in comparison to the massive 9 month Rising Wedge from April.
Is this a time to go AI…All In?