“You miss 100% of the shots you don’t take.” Wayne Gretzky
“Oh, daddy, proud of your planet
Oh mummy, proud of your sun.” 2000 Man, The Rolling Stones
We’ve been looking at the possibility that the market might be working on a mirror image foldback to 1929 throughout 2025.
Now more than two months after topping on October 29, the third of the three historic crash days in October 1929, the leading index, the NDX still has not exceeded the high struck on October 29, 2025.
The longer that date holds as a high, the eerier it becomes.
Indeed if you squint, the NDX shows a pattern “in the spirit of” three lower highs since October 29, 2025.
Fast moves come from 3rd lower highs.
And, we know that just below current levels, a daily Rule of 4 Sell could be triggered on breakage below Friday’s low.
As well the NDX all-time high is 26,182, Moving the decimal point to work with the Square of 9 Wheel we use 261/262 which is opposite mid-January.
Checking a weekly QQQ the ETF for the NDX shows a Megaphone Top.
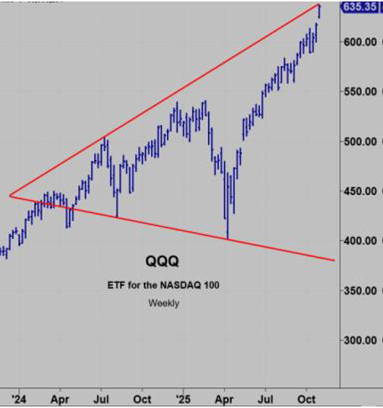
If the daily Rule of 4 Sell is triggered on trade below 610 the door is open to a drop to the bottom of the Megaphone Top. In the 380 region.
My cycle work suggests this potential is a real potential.
We’ve mentioned the 5 year cycle several times in this space last year.
The 5 year cycle is half of the Decennial Cycle used by W.D. Gann.
5 Waves of the 5 year cycle is 25 years which is one-half the 50 year Jubilee Cycle.
This year the U.S. will celebrate its 250th anniversary. 5 Jubilee Cycles.
The chart below is a monthly semi-logarithmic chart of the DJIA on a closing price basis.
The actual cycle used in the chart is 307 months.
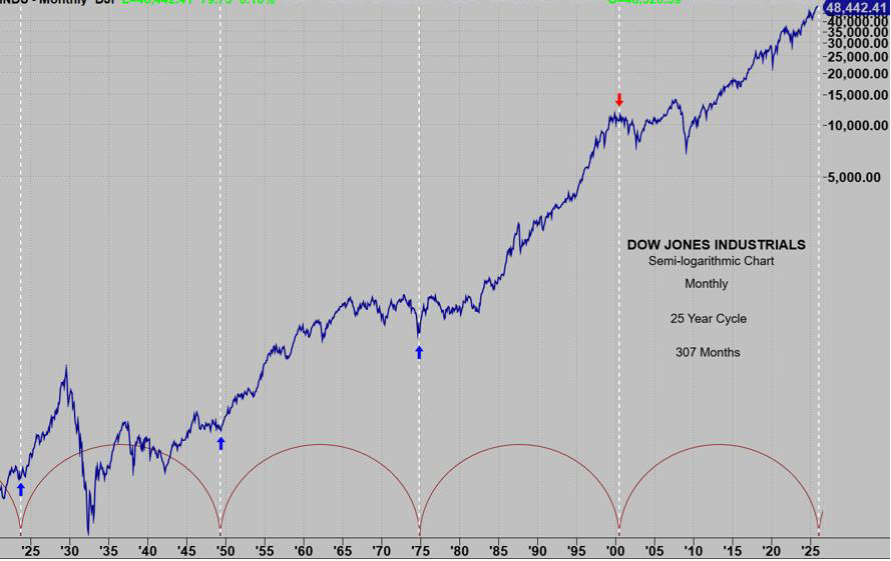
The white vertical lines and arrows show where these cycles fall on the chart.
The first 3 hits launched huge up moves starting with 1924.
1924 is actually when the Roaring Twenties started.
The vertical advance lasted 5 years into 1929.
This mirrors the 5 year run from 1932 to 1937, the 5 year run from 1992 to 2000, the 5 year run from 2002 to 2007,
We have been in a vertical advance since 2020.
The 4th hit was at the dot.com bubble top.
When is the next hit February 2026.
The chart below is a monthly SPX from the 2009 bear market bottom.
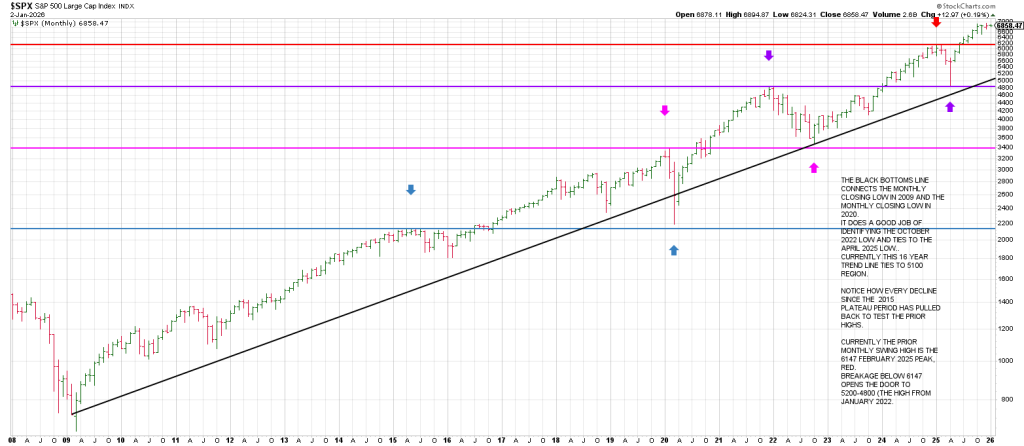
Notice how every decline since the 2015 “plateau period” has pulled back to test the prior highs.
Prior resistance became new support.
1) the 2020 decline pulled back to the 2015 highs…blue arrows.
2) the 2022 decline pulled back to test the 2020 high—magenta arrows.
3) the 2025 decline pulled back to test the January 2022 high.
I drew a horizontal red line across the February 2025 high.
In a continuing bull market the presumption is a pullback finds support in the 6125 region, the early 2025 highs.
What happens if the cycles are telling the truth? What is the downside potential?
Breakage below the Jan/Feb 2025 highs opens the door to the 5200-4800 region.
This is the purple horizontal line which ties to the April 2025 low and the Jan 2022 top.
Importantly it also ties to a Bottoms Line from the 2009 low. This black bottoms line is a monthly closing trend line connecting the Feb 2009 low (the closing monthly low of the Bear) and the closing monthly low in March 2020.
Notice how this same line caught the October 2022 Bear low.
In sum, we have a 16 year 3 point monthly trend line.
Trade below the long term support defined by this trend line confirms a major long term top.
Below 5000, we are in a major Bear Market that will play out as much in time as in price.
I do not think the 2 to 3 year cyclical bear markets most market participants have become used to over the last generation will be the what to expect because the structure is such that a Super Cycle Top is on the table. The last one we got was 1929.