August/September has seen blow-offs in gold.
In 2011 it had a Buying Climax in early September.
Ditto August 2020.
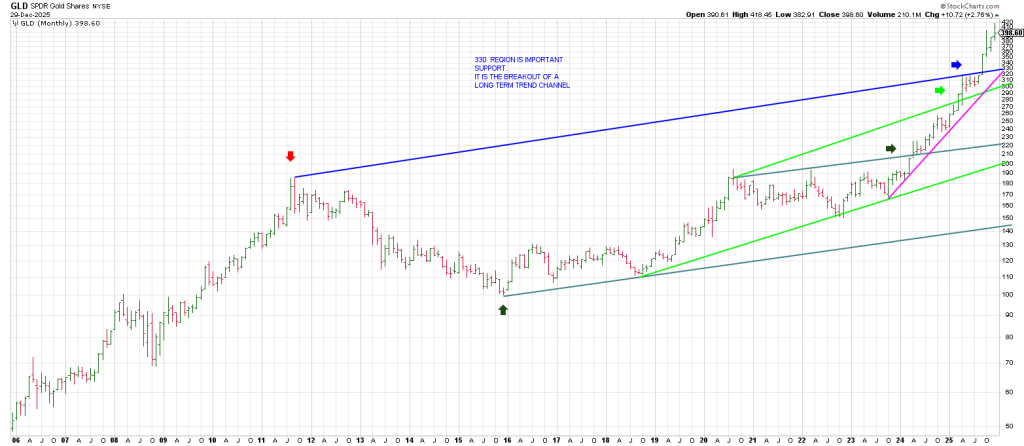
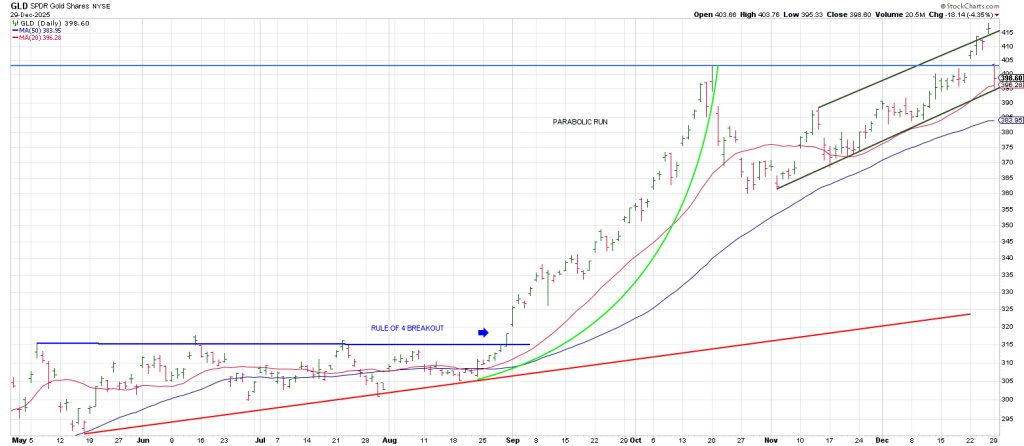
In 2025 it broke out of a flat top and embarked on a parabolic run at the beginning of September.
The vertical run ended with a large range outside down week on the week of October 20.
You don’t kill a 10 year bull without a “test”.
GLD rallied back to test/Pinocchio the October 403 peak.
It gapped up last week striking an all time high of 418.45.
Notice how GLD eclipsed the top of a two month trend channel before reversing with authority on Monday
With a large Breakaway Gap back through the trend channel leaving a massive Island Top.
As we flagged last week, from the major 150.50 low in October 2022, 4 revs of 360 degrees or a Fibonacci 1440 degrees up gives 410.50.
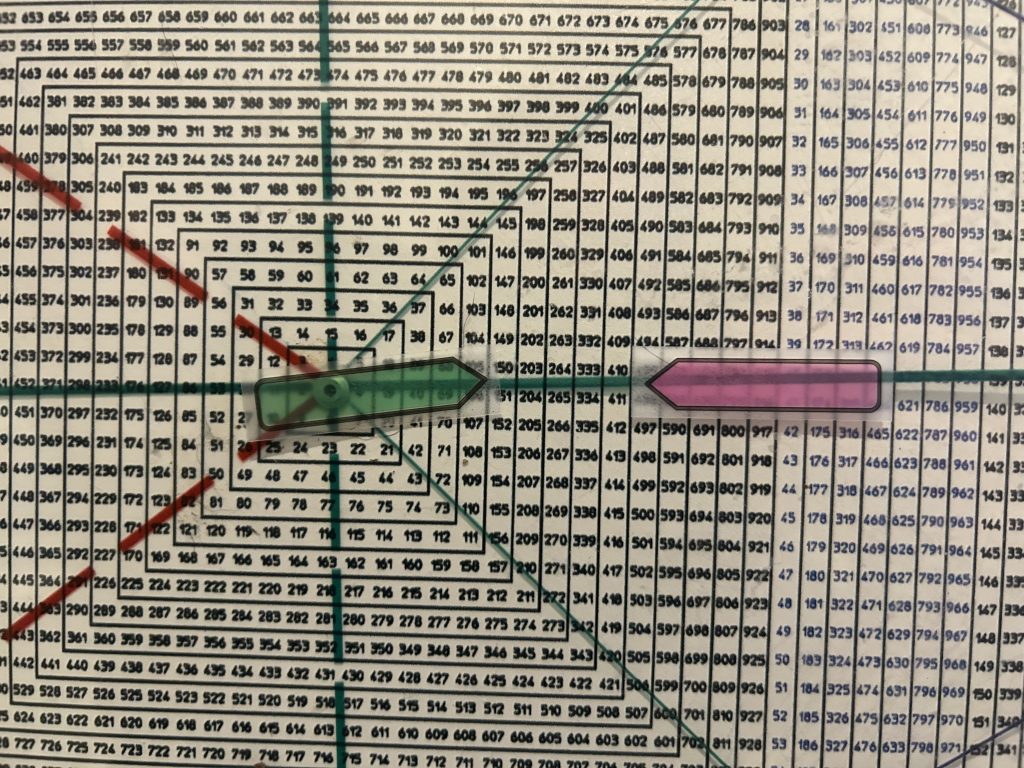
GLD saw a one-day spike above 410.50 on Friday which looked like a continuation run was on the table…until Sunday night.
Gold and silver were both up big Sunday night until the rug was pulled.
For its part silver was up over $5 Sunday night hitting 82 before reversing.
It came very close to the idealized 85 projection shown in the silver chart yesterday.
No one sells the kind of size needed to turn both markets like an 18 wheeler, unless it’s orchestrated. An ambush.
Be that as it may, the Spike & Reversal came precisely 10 years or 3600 days/degrees from the late December 2015 bear market low.
Yes. Gold has been in a bull market for 10 years. The Decennial Pattern is exercising its influence after setting the hook with what looked like a Cup and Handle breakout last week.
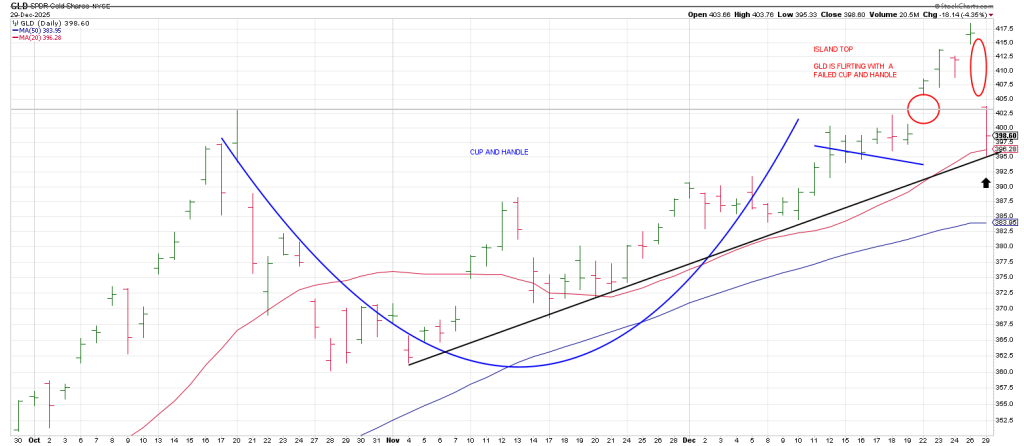
Yesterday’s Gap and Go to the downside sealed the deal with a gap below the October 20th 403 high perpetuating a test of the 20 dma.
In so doing GLD also tested the bottom of a channel from November.
Given the climax of the parabolic move at the October 20 top, one has to consider two possibilities:
1) Is the pullback from the Oct 20 peak an A Wave decline followed by a B Wave to a nominal new high last week?
If so after a bounce off the bottom of the channel and the 20 dma, the expectation is the door is open for a further drop—at least down to the 360 region.
2) 360 degrees down from Frida’s 418 high is 341.
418 aligns with mid-February. So as long as 418 remains the high, mid-Feb is on the radar as a pivot.
As well, 90 days/degrees from the October 20 initial high ties to January 20.
January 20 time frame is on the radar.
Notice that the October 20 end of the Parabolic Run in gold ties closely to the October 29 top in the Q’s.
While the SPX has seen what so far has been a marginal new high above their October 29 high, the index is flirting with a false breakout.
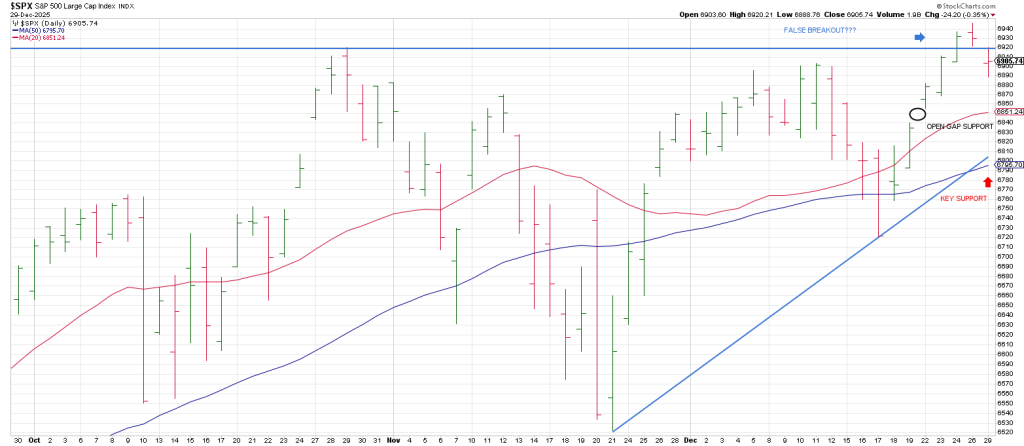
Speculation doesn’t distinguish what table its gambling at.
The proximity of the late October peaks in gold and QQQ are not just coincidence.
Silver’s Buying Climax over the weekend may sound an alarm on the SPX.
Notice that while silver does show an Island Top, it tailed back up toward session highs on Monday closing above the open.
Perhaps silver has an agenda to fully satisfy the 85 square-out.
A new high here in silver that is a fake-out would hurt the most bulls and bears alike.
Is it possible Monday was “just” a shakeout in the metals?
Anything is possible in markets, but is it probable?
The odds suggest after Snapback that there is work to do.
At this juncture, the door is open to a larger wave 4 correction (in time and price).