“Someone painted “April Fool” in big black letters on a “Dead End” sign” Just Dropped In, First Edition
“The Law of Vibration enabled me to accurate determine exact points to which stocks or commodities should rise and fall within a given time. The working out of this laws determines the cause and predicts the effect long before the Street is aware either.” W.D. Gann
Below we will show you exactly why the QQQ bottomed in early April and why it topped at 637 on October 29th.
When you consider the high anxiety surrounding the Tariff Tantrum back in March and April this year,
It’s remarkable where the market is set to end 2025.
Let’s look at the leader, the QQQ.
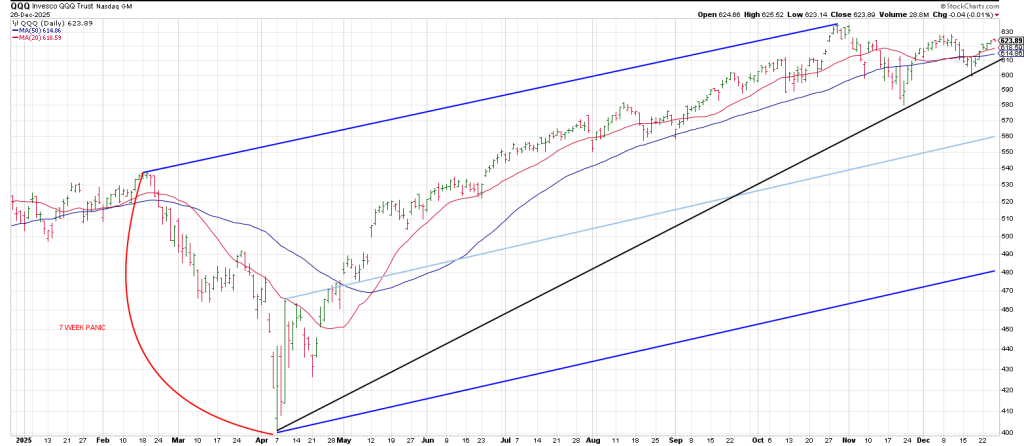
From a high of 540.81 on February 19, 2025, the Q’s bottomed at 402.39 on April 7th SEVEN weeks later in keeping a the 7 to 8 week Gann Panic Window.
A perfected 540 degree cube-out from the 541 high gives 411.
So the Q’s overshot the mark a tad.
However, the closing low for the move was 422.
Split the difference between the November 20/21 bottoming pattern and it was a bull’s eye. Literally.
I think it worth noting that the Feb 19th 540.81 high is on the Autumnal Equinox on September 21 which means
The QQQ all-time high square December 26, Friday 540.81 squares Dec 26.
In other words the 2025 pre-panic high squares out with December 26.
This is going to be pivotal as well get into later.
The February 19, 2025 high was exactly 5 years from the February 19, 2000 pre-crash high once again proving the uncanny nature of W. D. Gann’s anniversary date forecasts.
From the Feb 19t, 2020 high of 237.47 the Q’s dropped just shy perfected 450 degree cube-out on the Square of 9 Wheel at 154, stopping at 165.
Notice how 237 vectors the Feb 19, 2020 high for a Time/Price pre-crash square-out.
Let’s analyze the Q’s in 2025 through the lens Gann’s Law of Vibration.
April 7 low 402.39
High October 29 high 637.
1) From the closing low for the move on April 8, at 410, the Wheel shows that 637 is straight across and opposite, 900 degrees (two price cycles of 360 degrees + 180 degrees) .
2) April 7, the low, is opposite 634 which ties closely to the 637 top)
3) 404 (which ties to the 402.39 low) is opposite October 29, the day of the high….so far.
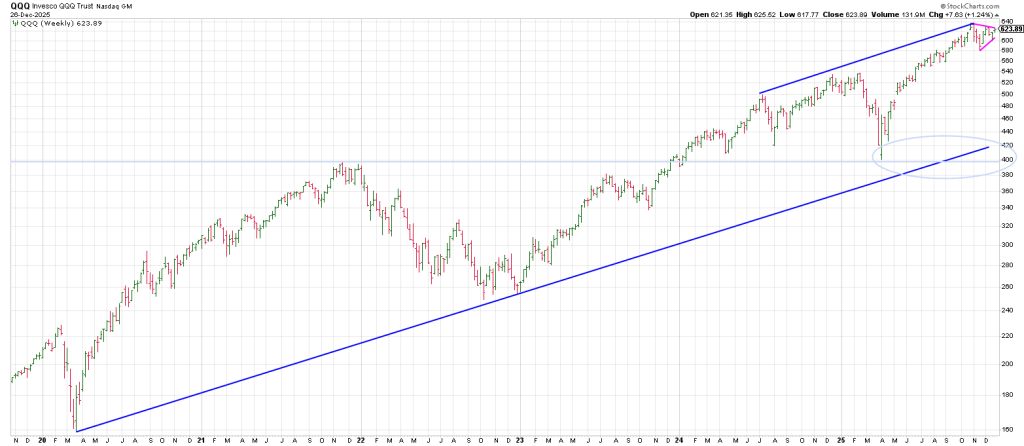
The current picture on the Q’s shows a weekly triangle.
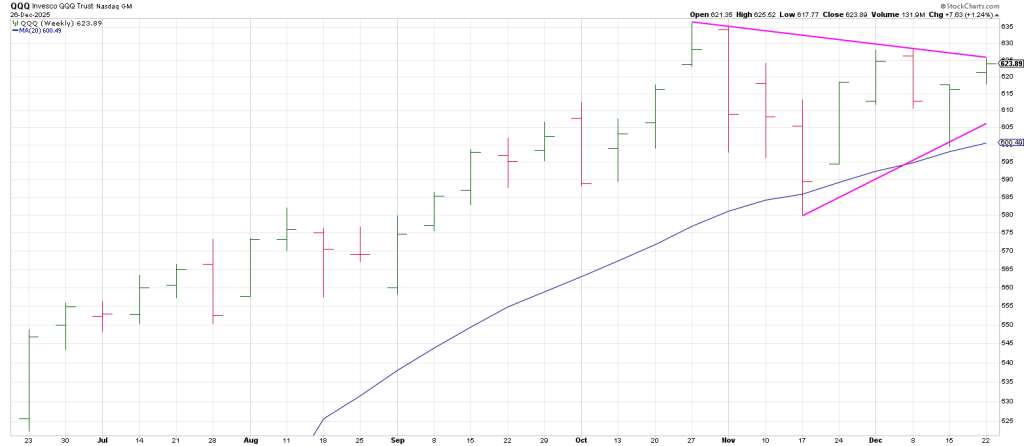
Following the October 29 all-time high, the Q’s turned their 3 Week Chart down.
This occurs with 3 consecutive weekly lower lows.
The normal expectation would be for at least a Knee Jerk rally at least, even in the context of a change in trend from Bull to Bear….especially as the Q’s also satisfied a weekly Holy Grail buy setup as well.
This is a test of the rising 20 week moving average.
Subsequently the Q’s rallied scoring two consecutive higher weekly highs putting them in the weekly Minus One/Plus Two sell position.
My -1/+2 Swing Method (or +1/-2 in the case of a bullish setup) produced a pullback.
Once again the 20 week ma acted as support.
The question is does a breakout perpetuate a test/Secondary High or do we get an impulsive new leg up?
As well we must be mindful of a possible Triangle Pendulum pattern playing out.
Allow me to explain.
A breakout through the top side of the triangle that reverse in short order through the breakout and then the bottom of the triangle triggers a Triangle Pendulum sell signal.
These are typical sharp moves because fast moves come from false moves..ie, a potential initial false move out of the triangle.
Given a possible major time/price square-out caution is warranted.
The nature of this square-out is that the parabolic boom and bust in 1929 was 96 years ago and 96 is 180 degrees straight across and opposite December 26.
Remember the all-time QQQ price high also squares out with Dec 26.
We have a synergistic cluster which typical increases the odds of a turning point.
Think about this: the October 29 QQQ peak of 637 is precisely 360 degrees up from the February 19 peak.
This unequivocally shows the power of the Principle of Squares.
The QQQ has advanced 58.30% in SEVEN months, close to a Fibonacci 1.618 extension.
That relationship produced the current correction/triangle in the Q’s
The potential for a possible flush-out into the 7th week from high was on our radar; however, a pullback held at the 20 week moving average once again and we turned up.
The implication looks like a breakout of the top of the triangle especially given some setups we have posted on the cooperhitandruntrading.com Private Twitter/X Feed.
But, again given the cycles we want to be mindful of a false breakout that leads to a Triangle Pendulum sell signal.
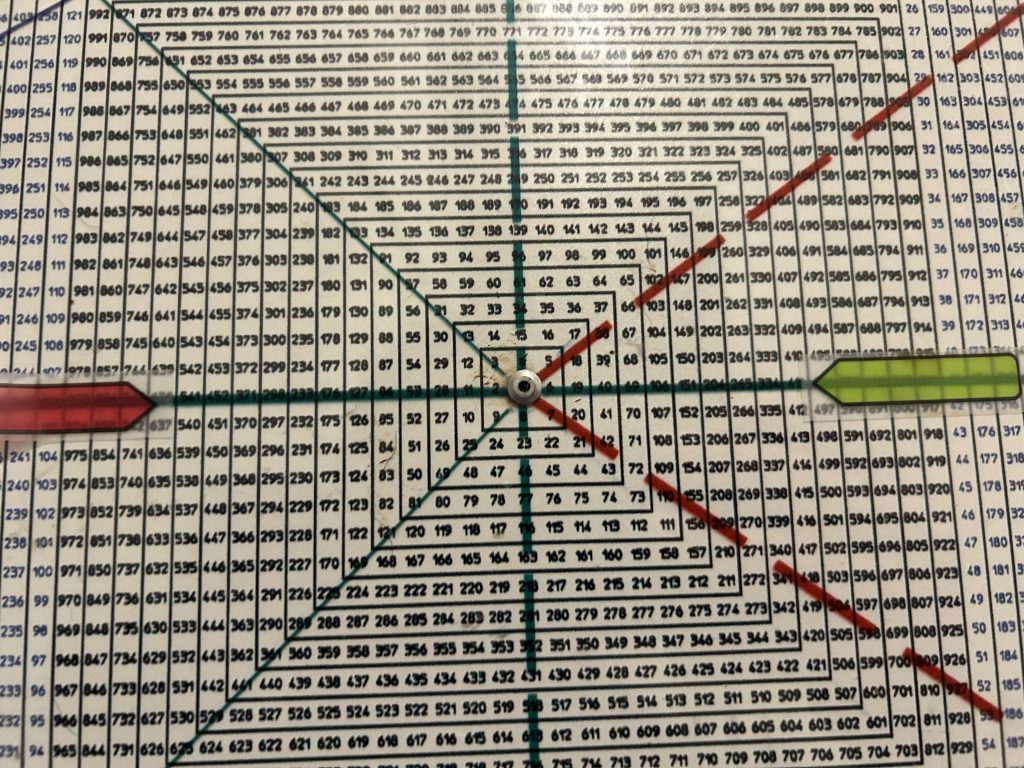
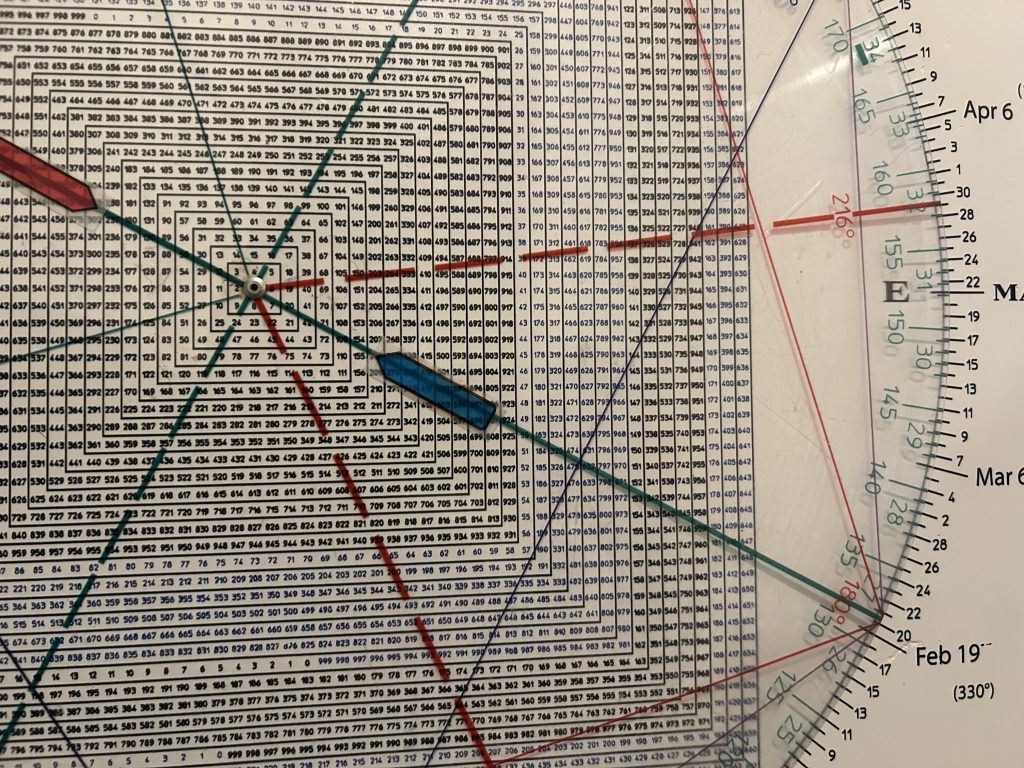
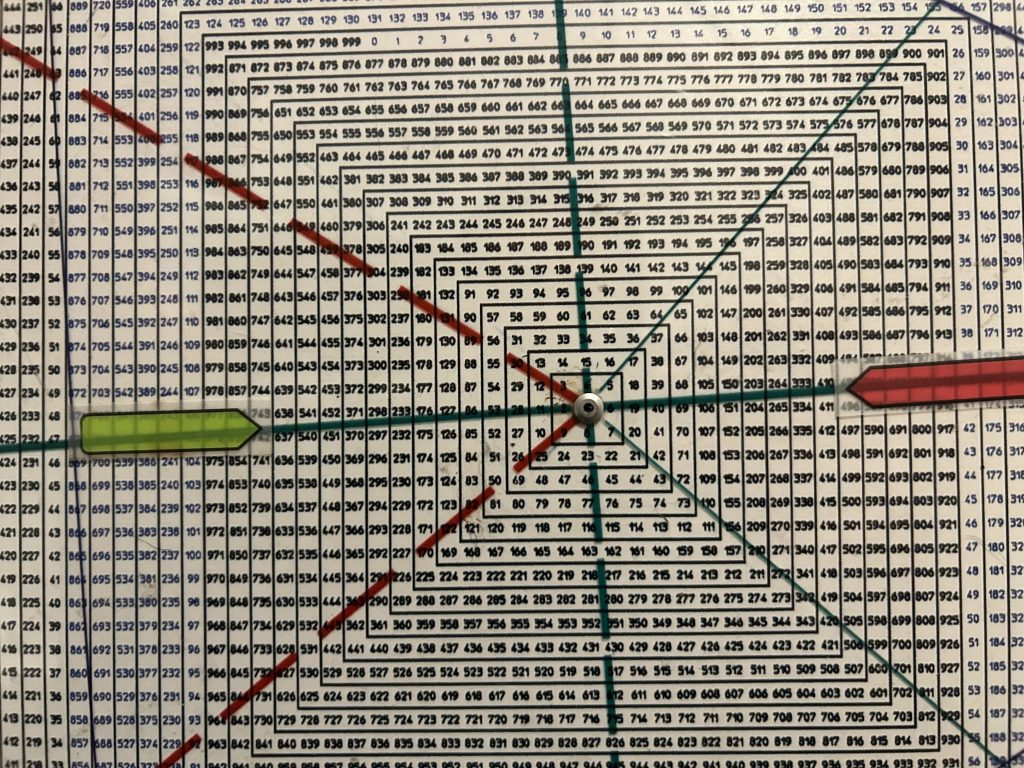
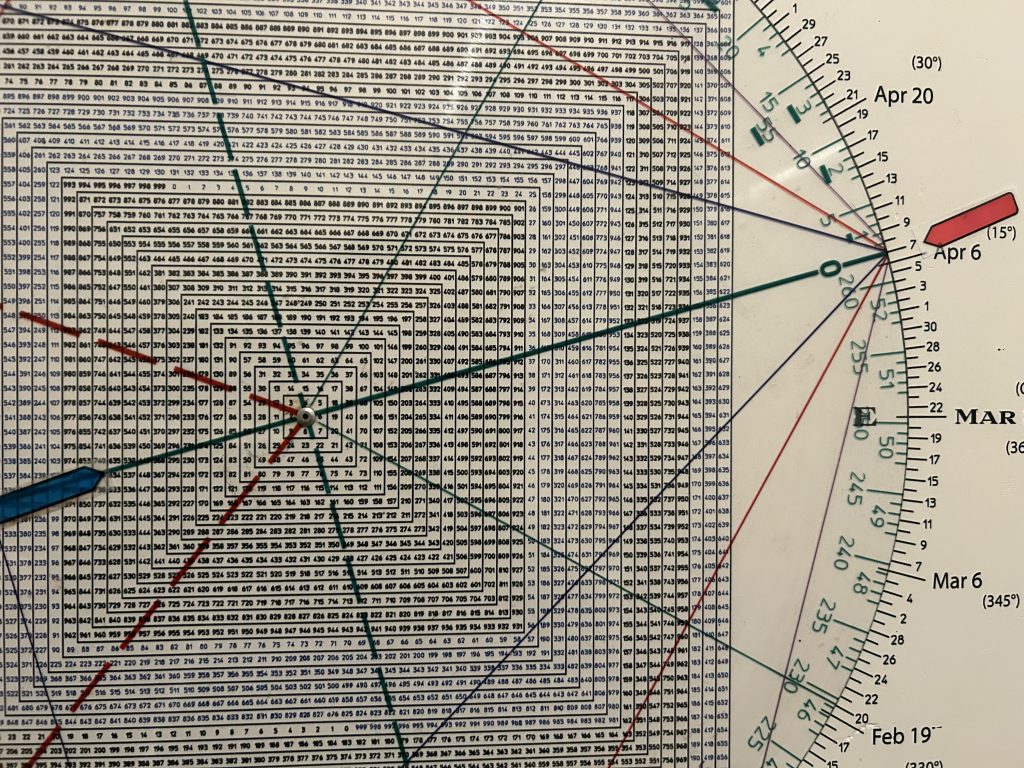
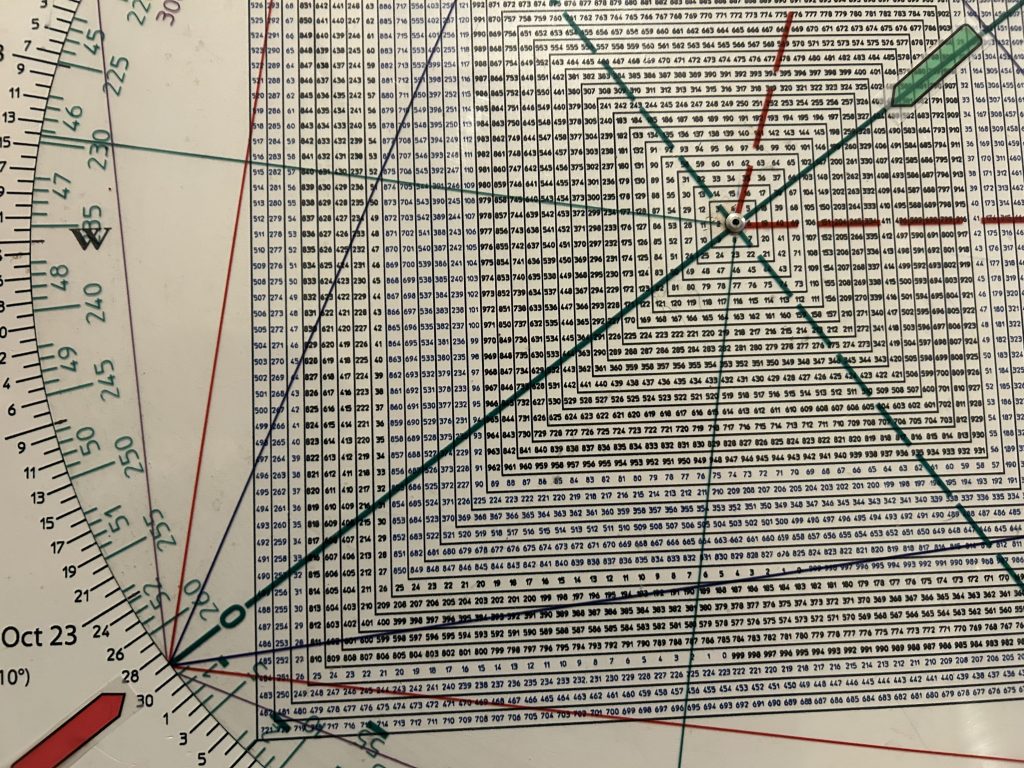
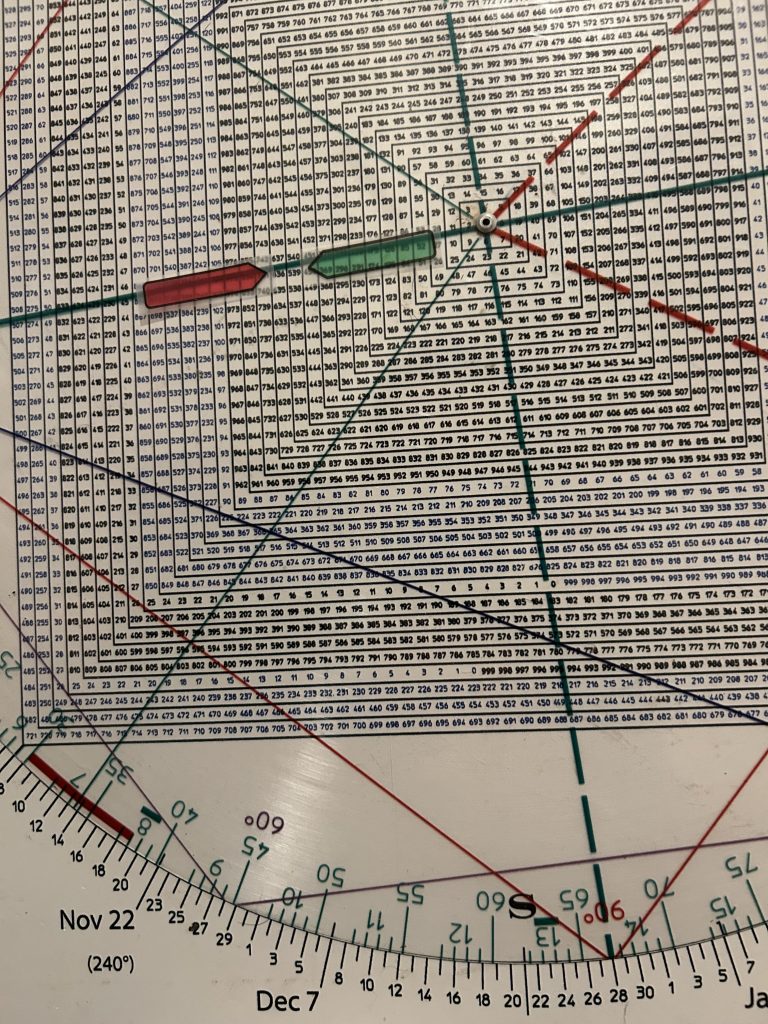
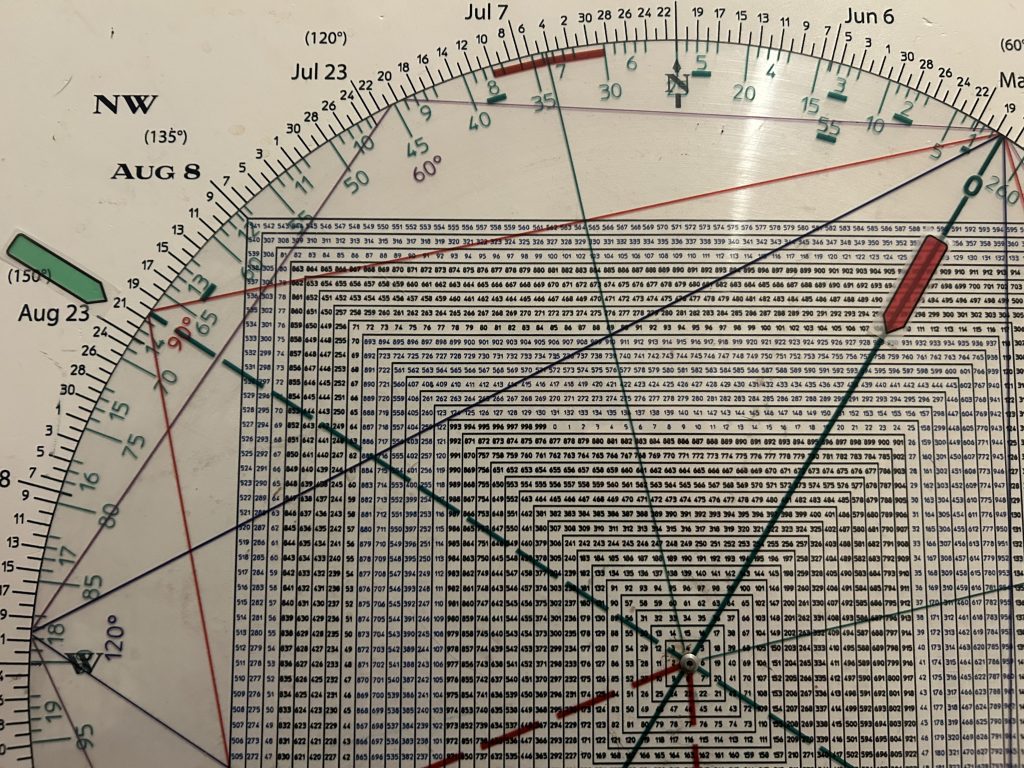
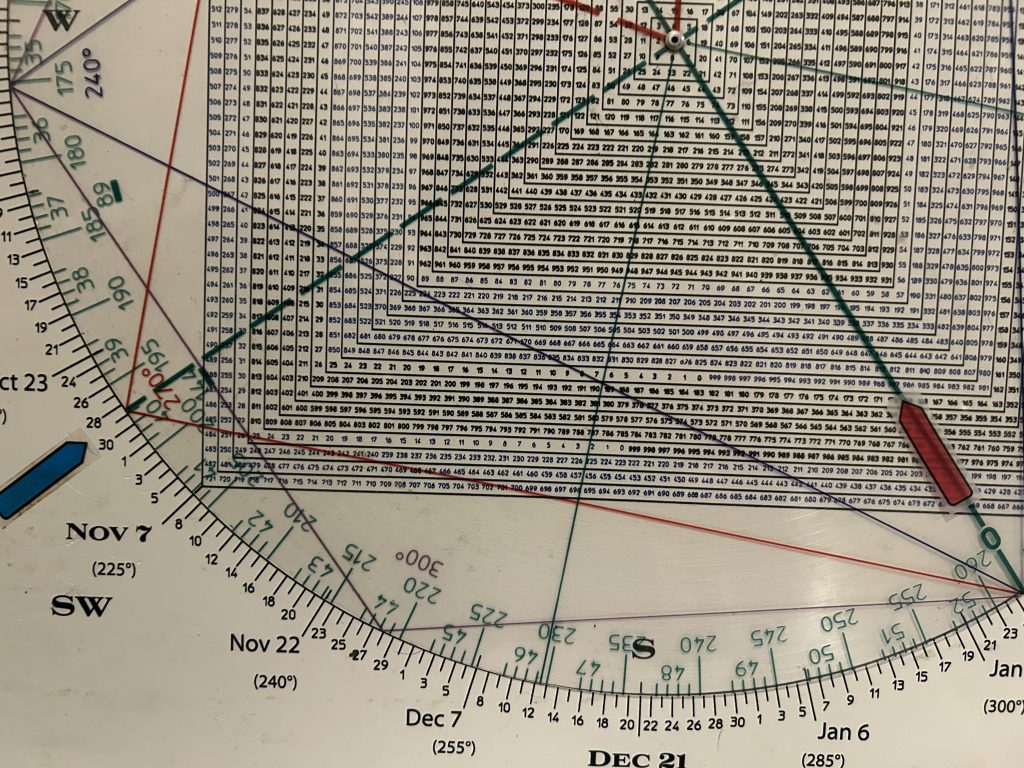
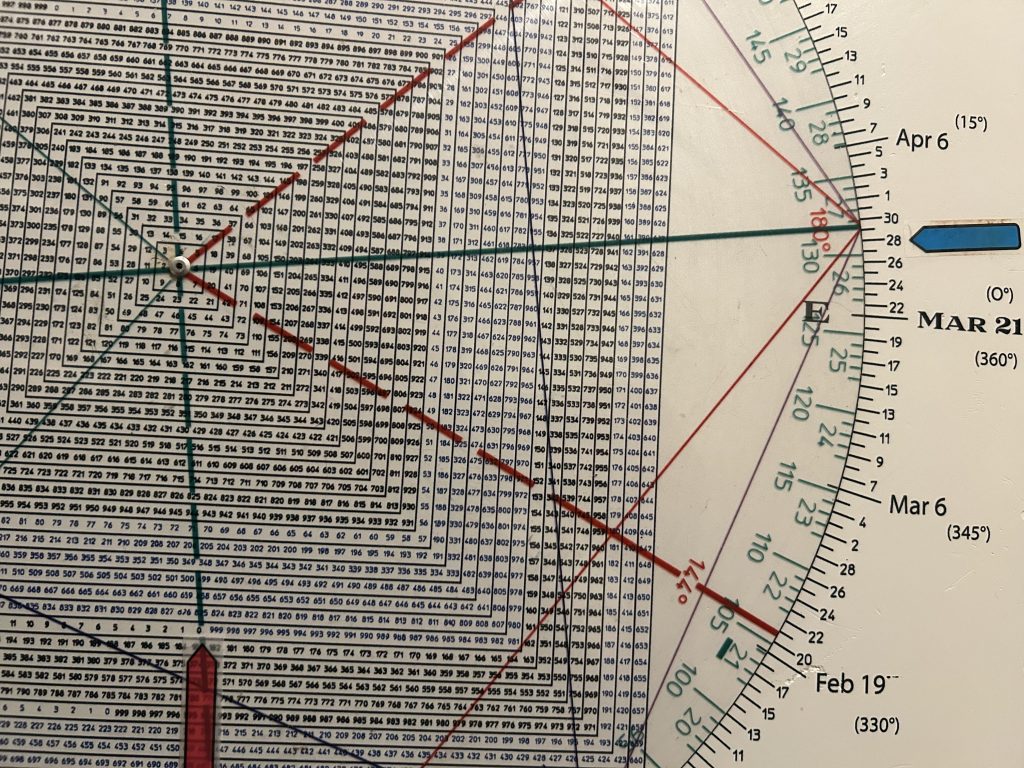
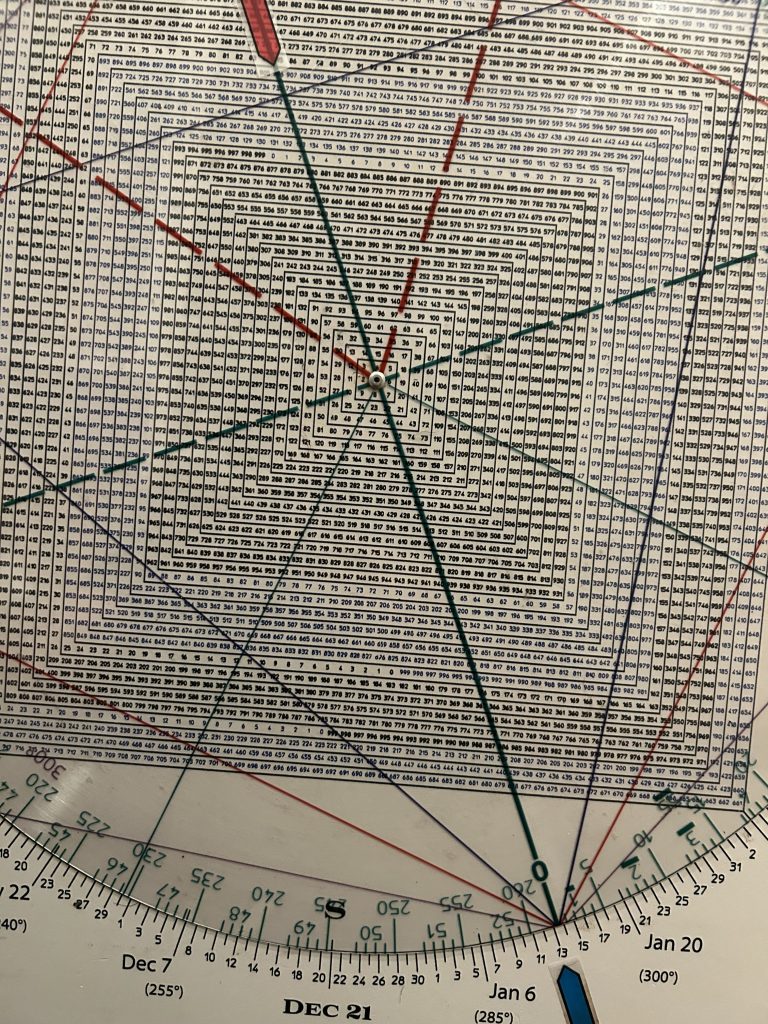
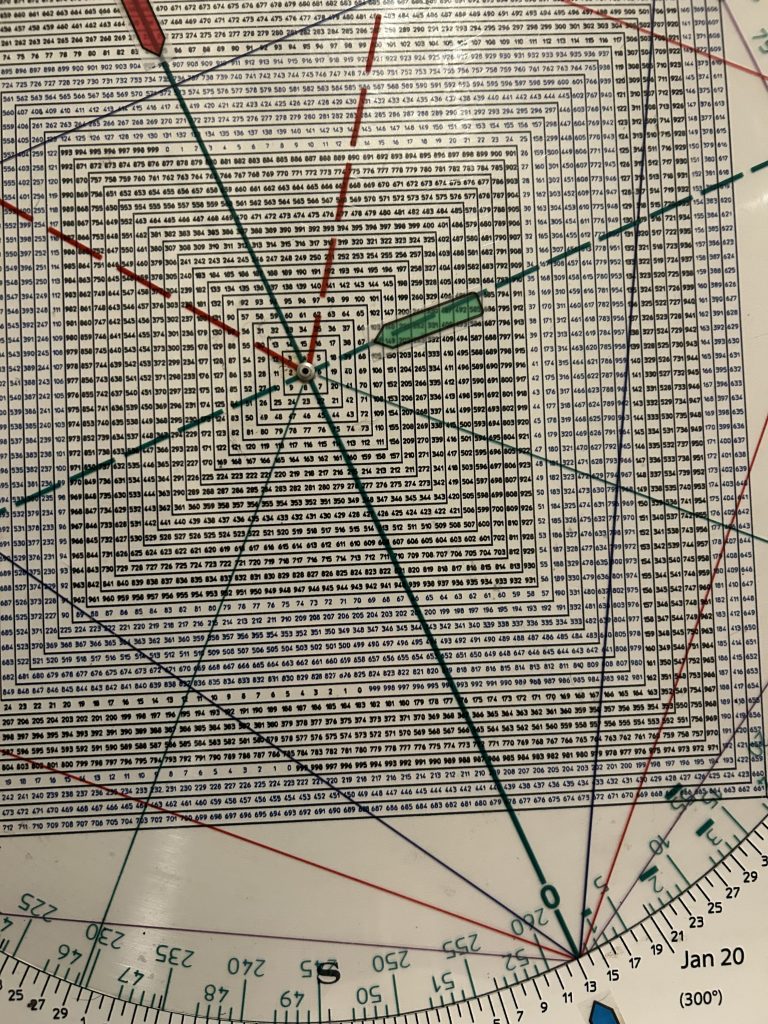
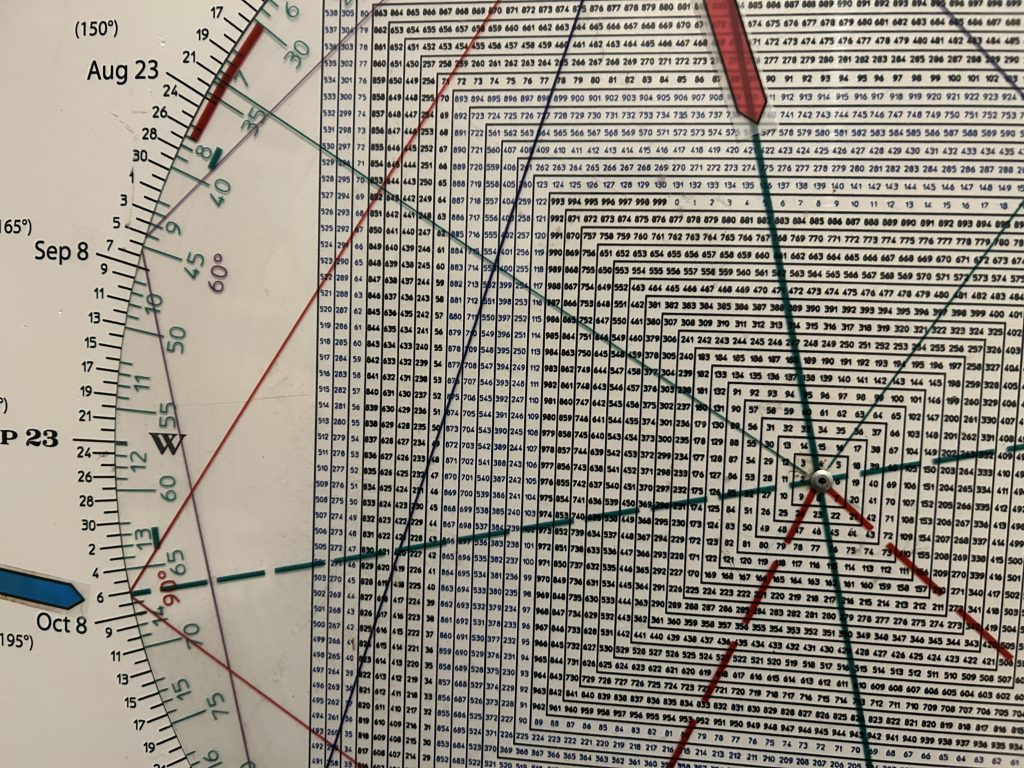
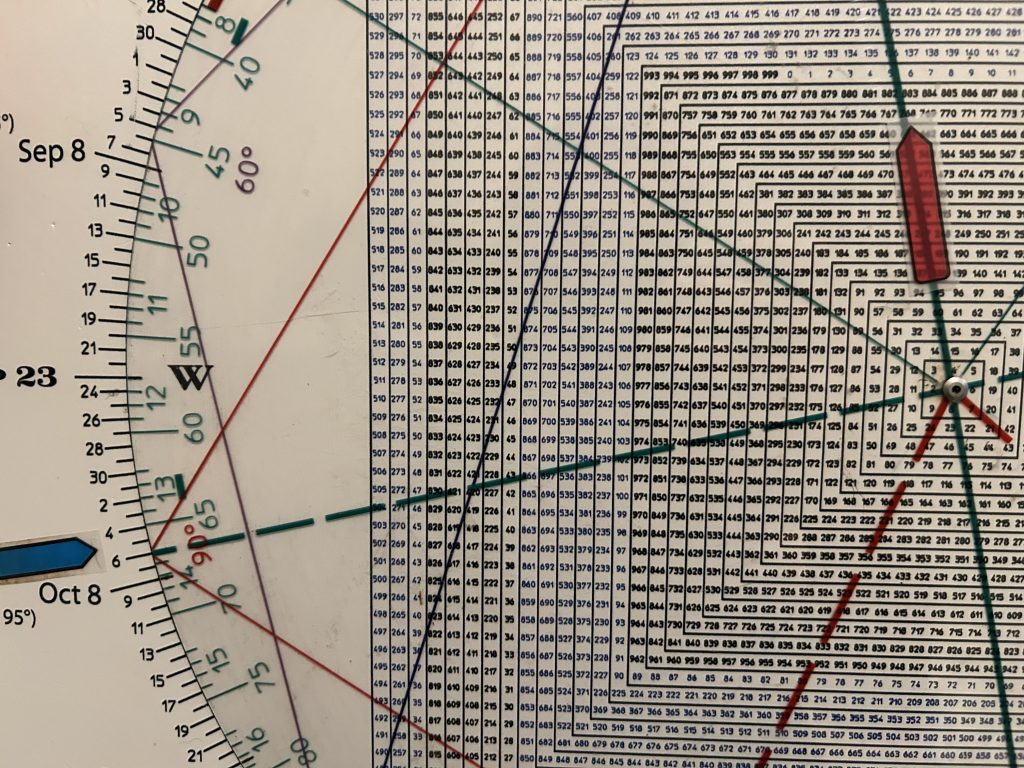
One of the methods I use to forecast major turns is square-outs with the current year.
I do this by using the number grid in the Square of 9 as a year.
Gann stated, “Vibration explains every possible phase and condition of the market. If we know the cause of the effect, then there can be no doubt about predicting the future even of effect. I have always looked for causes and when once I determine a cause I can always be sure of the effect or future event which I predict.”
For example the number 1929 simply becomes the year 1929.
Let’s see how this method has played out.
The year 1929 squares late August, the 1987 top and the year 2000 Secondary Top when the NAZ went on to mirror the drop from 1929.
It also is opposite the 2008 November crash low.
The year 1987 squares October 29, The Big Kahuna in 1929.
A major high was struck on January 11, 1973.
1973 squares late August, the 1987 pre-crash high, late November, the 2008 Lehman Crash bottom, and late May the pivot high prior to the Lehman Crash.
The year 2000 squares out with late March. The SPX top was March 24th.

The year 2020 squares mid-February, the pre-Covid crash high.
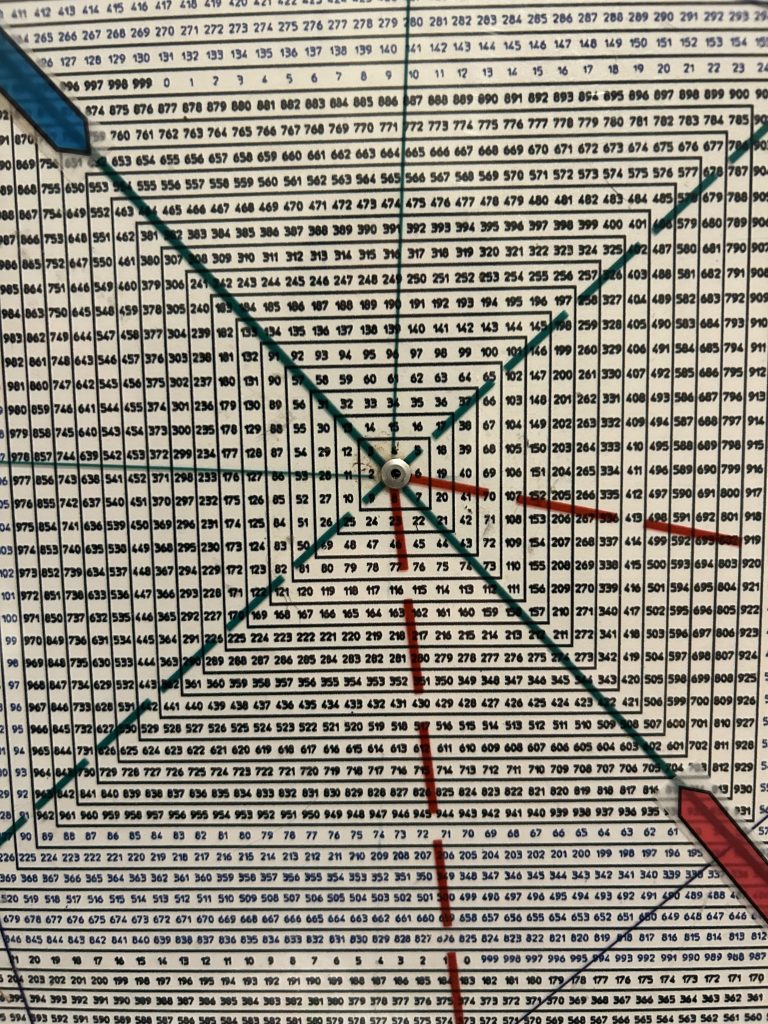
Pulling the lens back, there was a Panic in 1907.
However, the high preceding that crash was in mid-January 1906.
The year 1906 is opposite January 11.
Interestingly this ties to the date of the high 1973 before a 50% drop.
This was a period of 67 years.
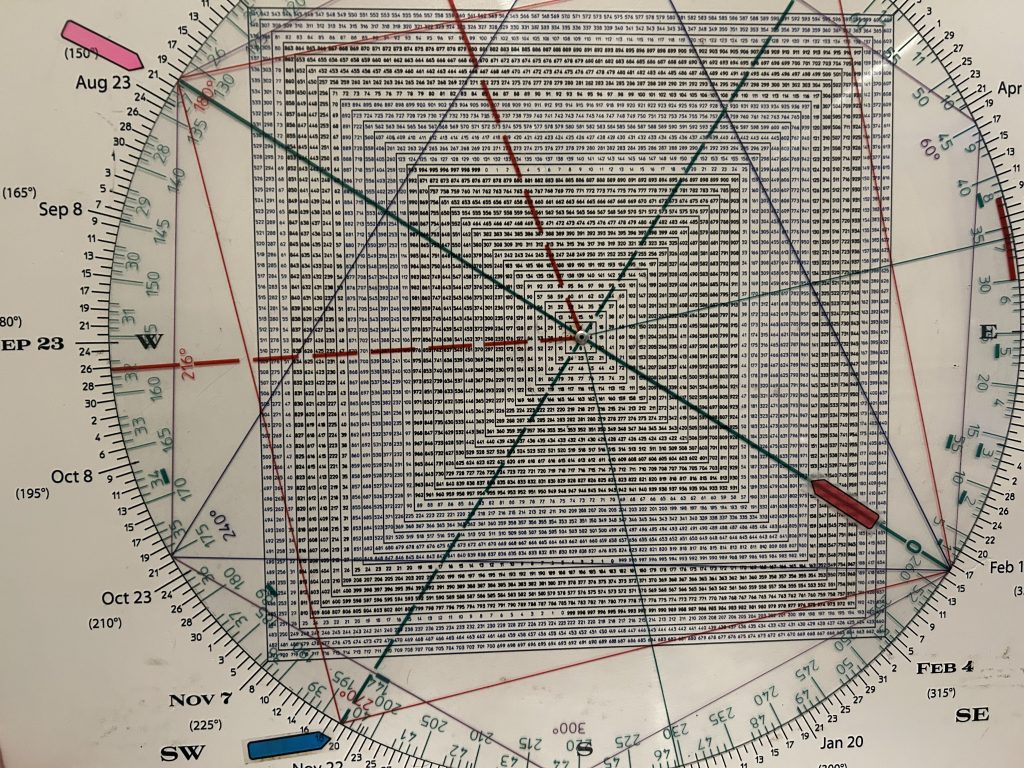
On the Square of 9 image below note that in addition to 1906 being opposite January 11 that both square 67 the number of years between the two peaks.
So a square-out/vibration of the RANGE.
You can’t make this stuff up.
The high in 2007 was SPX 1576 in early October
1576 squares early October
The low in 2002 was SPX 768 in early October.
768 is also square early October.
Notice that 1576 high in 2007 is 6 revolutions in price up from the 768 low in 2002.
They are 5 years apart in sync with the Decennial Cycle with which we will have a lot more to say in tomorrow’s report.
As well, remarkably 2009 was the bear market low and
2009 squares out with March 6.
At the same time, the year 2009 is opposite the 666/667 bear market low with 666/667 squaring March 6 for some powerful synergy.
16 years later the market is still making new highs.
What does the Law of Vibration suggest for the year 2026?
In fairness to our subscribers we will be showcasing that in tomorrow’s subscriber report.
This is the method by which I was able to forecast:
1) The 2000 top to the week.
2) The August 31 Secondary High to the day.
3) The 2002 low to the day.
4) The 2007 high to the week.
5) The pre-crash Covid High to the week.
6) The Covid crash low to the day.
7) The 2022 late Dec/early Jan high
8) The March 6 2009 low to the day.
In sum, we have a cluster of intermediate and major cycles on deck. due to exert their influence.
All market turning points are contextual within the background conditions of sentiment, valuation and breadth.
As Gann stated, “When Time is up the trend turns.”
The Law of Vibration furnishes unmistakable proof of history repeating itself and shows that cycle theory and harmonic analysis is the only thing we can rely on to see the future.
“By a study of the Time Periods and TIME CYCLES you will learn why tops and bottoms are found at certain times and why Resistance Levels are so strong at certain times and bottoms and tops hold around them.” W.D. Gann.
Those conditions are present, but they were also present in January 2000 and the NDX rallied nearly 50% in 7 weeks before the Climax Run culminated.
While there are some analysts who believe the market is poised to go parabolic to SPX 9000, there is strong evidence that risk is ripe going into 2026.
A long term yearly DJIA shows the index has just eclipsed the top rail of a 96 year channel.
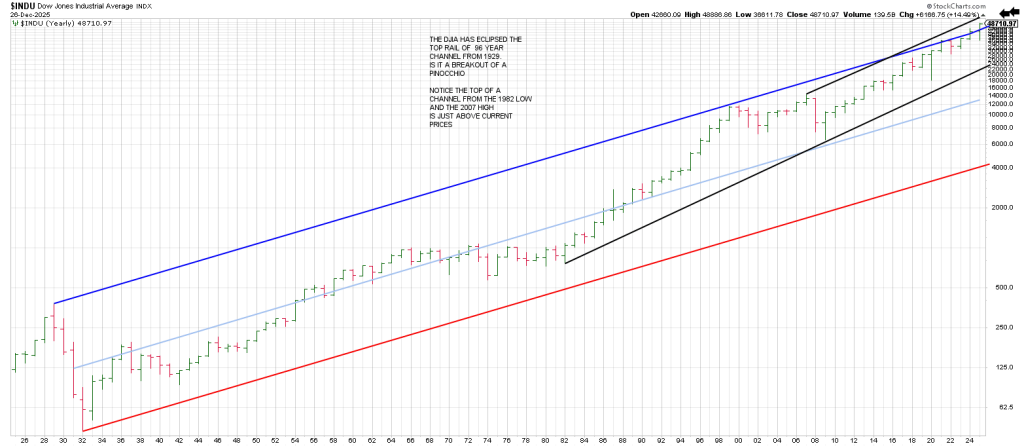
That said, the top of channel from the 1982 low and 2007 high is just above current prices..
It is important to understand where we are within the bigger picture trend.
The conclusion is we are concluding a nearly 100 year Super Cycle Bull Market.
The last Super Cycle top was 1929. This cycle is one degree larger.
The risk in a secular bear market is a 50% decline.
Below that opens the door to a Super Cycle decline.
Before new readers jump to the conclusion that I am an perma-bear, I want to note that when we flagged the day of the Covid Crash low on March 23, 2020 at 2191, we forecast a run to 4000 SPX in less than a year.
From that March 2020 low, the DJIA in clearly in a 5th and culminating wave that could end at anytime.
Wave 1 is from March 2020 to Dec 2021.
Wave 2 correction is into October 2022.
Wave 3 advance carried into November 2024-February 2024 ( a 3 month distribution phase).
Wave 4 correction ended in April 2025;
Wave 5 started with the largest 1 month impulse in the entire bull market from 2009.
The thrust did a good job telegraphing the 7 month momentum that followed.
The SPX turned its Monthly Swing Chart down in November and immediate resumed the advance.
That is the normal expectation following such accelerated momentum.
The November 2025 low was 6521. Moving the decimal point to work with the Square of 9 Wheel we see that 180 degrees straight across and opposite 652 is 704 (7040) which ties to the end of January.
Momentum into January opens the door to 7040.
Given we are in a 5th wave, if the 7000 region is struck, we must watch the price action for a potential major top.
Tomorrow’s report will showcase the SPX Maginot Line where we get initial confirmation that a major top is in.
“I had my foot on the gas as I left the road” Just Dropped In, First Edition X Willie Nelson
Silver.
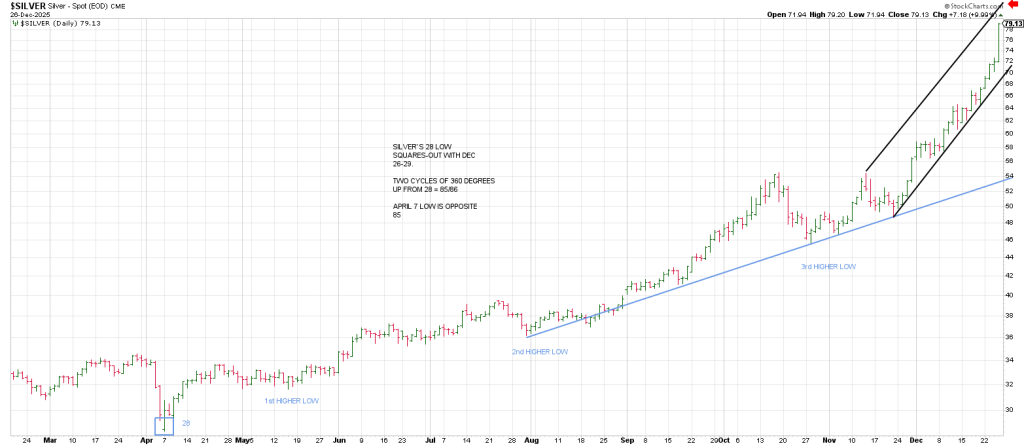
Silver’s 28 low squares out with Dec 26-29.
Two cycles of 360 degrees up from 28 = 85-86.
April 7 low is opposite 85.
Interestingly silver struck a new record high over its historic 50 high in October, pulled back to backtest the 50 region and embarked on a parabolic run.
The top of the parabolic channel ties to this 85 region.

Square of 9 Wheel
Purchase your own Square of 9 Wheel. Shipping to US only. Contact Jeff for shipping outside the US.