“There’s pigeons down on Market Square…” Mary Jane’s Last Dance, Tom Petty And The Heartbreakers
“Seen through the lens of human perception, cycles are often viewed as less symmetrical than they are.” Howard Marks.
The SPX tested its 50 day moving average on Tuesday and reversed leaving a Lizard buy setup:
It was a new 10 day low with the open and close at/near the top of the day’s range.
It was the first test of the 50 dma following the index reclaiming it on November 25.
The 3 Day Chart is still pointing up as the SPX does not have 3 consecutive lower intraday lows.
Remember the 3 Day Chart is not based on closes…just the actual lows or highs (in the case of the 3 Day Chart turn ups).
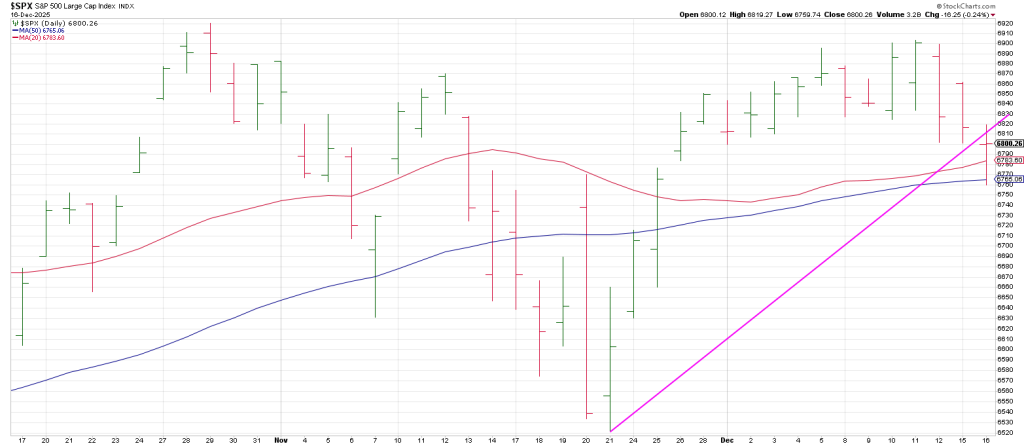
A bull looks at the picture and sees a possible misshapen Cup and Handle.
A bear looks at the picture and sees a Secondary High and a rollover.
So it will be important to see if the SPX produces any traction from the pattern.
Given the Gann Panic Cycle and the analogue shown in yesterday’s report a turn up of the Daily Swing Chart here could play out. But what happens then is critical.
That would be my expectation with the index closing near session highs on Tuesday.
It would be easy to accomplish.
It will be what happens after a “1 or 2 day turn up here” that tells the tale of the tape.
A turn up that rolls over back below the 50 dma demands extreme caution from my perspective.
The QQQ has an altogether different picture.
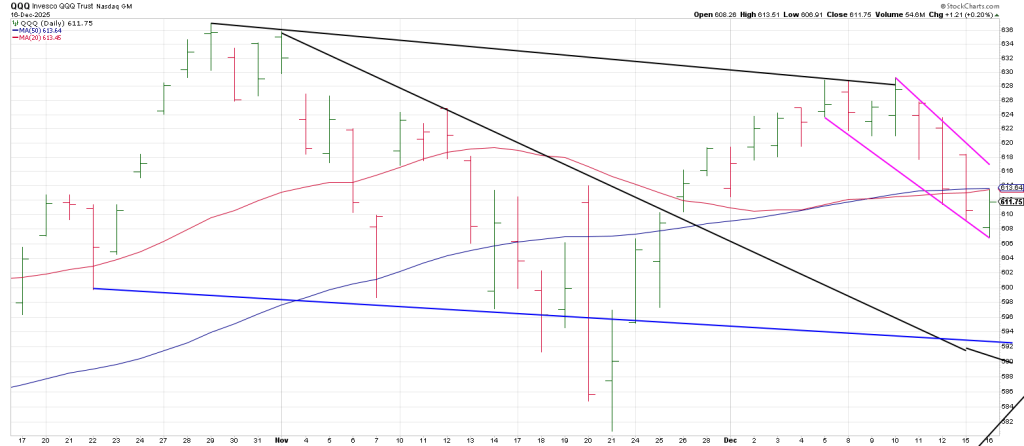
The Q’s rallied to a lower high on December 5 and rolled over turning the 3 Day Chart down immediately. Bearishly the Q’s pushed lower closing below their 50 dma for two consecutive sessions…Monday and Tuesday.
The Q’s backtested their 50 dma in the wake of Tuesday’s late rebound.
The SPX used its 50 day as support while the Q’s have hit their head on what appears to be resistance at the 50 dma —until proven otherwise.
We are in the heart of the Gann Panic Zone now so any rollover from here could see accelerated momentum to the downside.
Pulling back the lens shows the Q’s hanging by a tread above a Bottoms Line connecting the April low and the November 21 low.
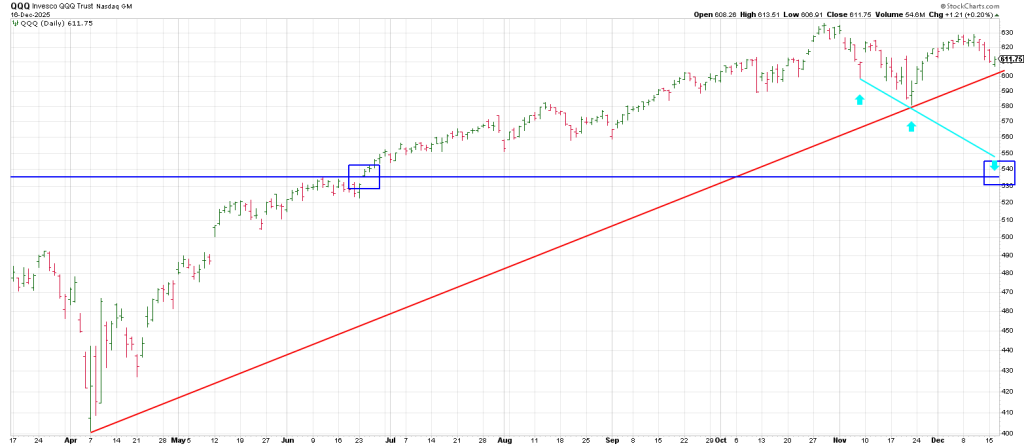
The normal expectation would be that a 3rd tag of the line perpetuates at least a knee-jerk rally.
But you never know.
If the line gets kissed and we get perfunctory rally and then we get a break of what would be a 3 point of the Bottoms Line, it opens the door to a drive to the 200 day moving average —currently at 551.
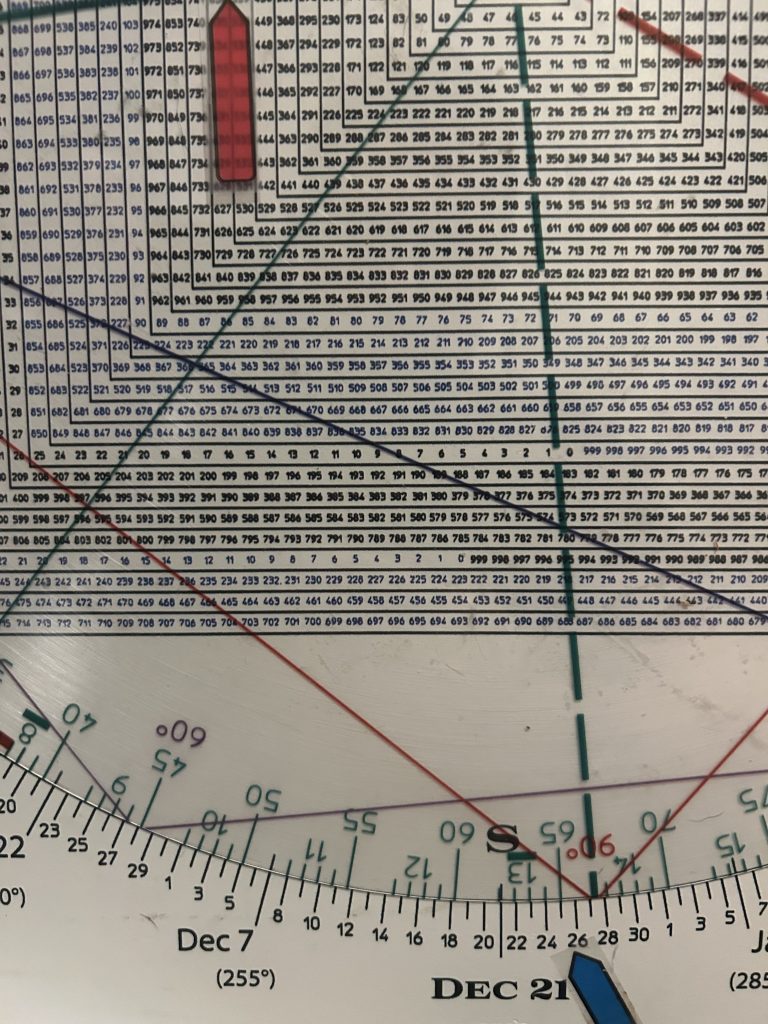
Interestingly 360 degrees down from the 637 all-time high is 540 which closely ties to the 551 region.
Further, 637 squares-out with December 26.
So we have a Time/Price setup for late December for a drive to the 200 dma.
December is also on the radar because the Bank of Japan is expected to raise rates, again, on December 19.
So what?
Japan is the largest holder of U.S. debt.
Every recent Bank of Japan rate raise has been followed by a sharp sell-off in bitcoin.
There are a lot of “long-term” holders of bitcoin who may be forced to be sellers of other assets.
At the same time, bonds are reflecting mounting stress.
Why?
The spread between the 10 year and 2 year U.S. Treasury yields is spiking.
This reflects whether smart money thinks the future will be stable or volatile.
While short term rates remain high relative to the last decade, long term yields are lifting.
It matters for stocks because equity accidents start in rates…every time since 2000.
At the same time this stress is building with smart money demanding more protection (higher yields) further out in time, fund managers are the most bullish they been in 3 ½ years according to BofA.
That’s not all—cash holdings have plummeted to the lowest on record.
Stocks may ignore a rising 10 year-2 year spread signaling risk repricing,, but history shows markets eventually follow rate signals not narratives when cycles turn hard.
And the litany of cycles we’ve outlined in this space throughout the last six months are exerting their downside influence.
In sum, I don’t think people are ready for what is likely to happen over coming days/weeks/months.
Two Secular Bull Cycles are converging in early 2026 over the last 120 years.
The action here into year end is setting the stage.
This coincides with the AI Bubble.
The Dot-Com Bubble was mostly equity. When it popped, market participants got hurt, but the system survived.
Now, AI is built on debt. A lot of it.
Companies are borrowing hundreds of billions betting that if they build it profits will come.
Between private equity, insurance companies and banks, there is a multi-trillion dollar bet into tech loans.
At the same time the consumer is tapped and tipping over.
Foreclosures are up. Car repos soaring. Credit card delinquencies are ramping.
This is before any AI debt repercussions hit.
Throw in tech debt and you can hear the bear coming out of hibernation…not just for a quick salmon.
The stage is set for a Super Cycle Top:
We are 96 years from the last Super Cycle Top in 1929.
On the Square of 9 Wheel 96 is straight across and opposite from late December.
Bitcoin is joined at the hip with NAZ risk-on.
I called the top of Bitcoin at 128K and said it was “Hiroshima”
Calling for 70K. Then 54K.
We hit 80K so far…probing the low from April. After striking an all-time high, bitcoin has given back almost all this years gains.
Bitcoins drop since October is just setting stage for across the board risk off in 2026.

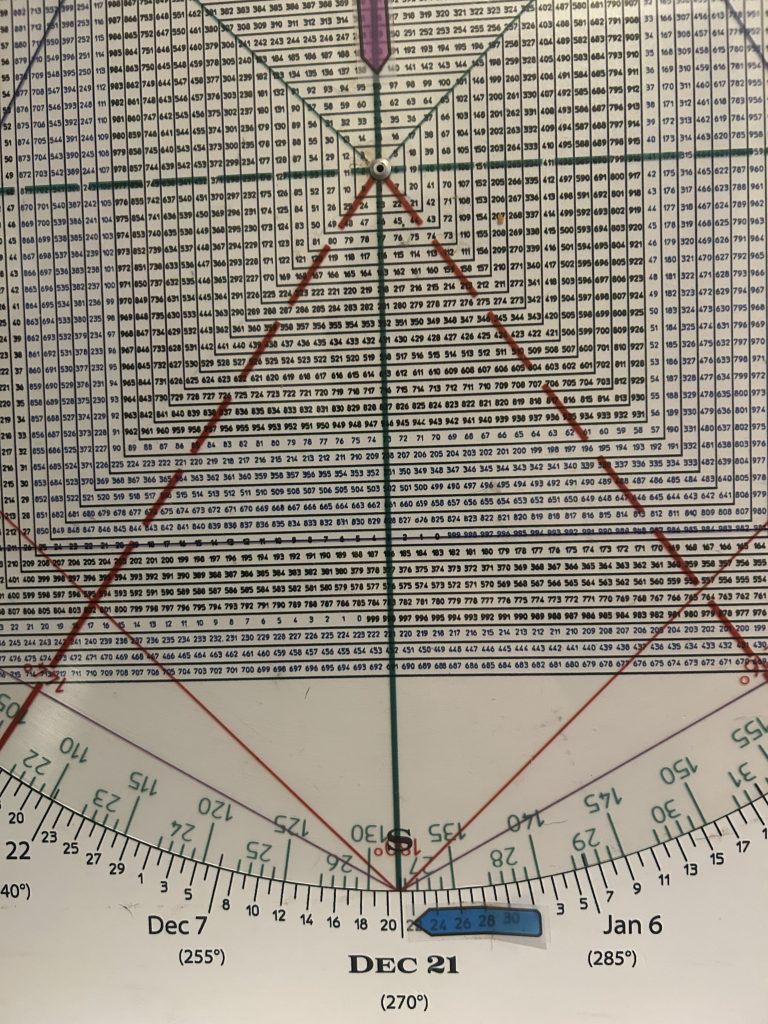
Square of 9 Wheel
Purchase your own Square of 9 Wheel. Shipping to US only. Contact Jeff for shipping outside the US.