“Can you feel it coming in the air tonight?” In the Air Tonight, Phil Collins
“After many years of studying Wall Street’s victors and victims, I must conclude that the American public still insists on losing its savings every time the old hook is baited with the immortal easy-money worm. After every smash the blame is laid on the hook and not on the hunger.” Edwin Lefevre
Now that we are in the very heart of the Gann Panic Window which is 7 weeks from high (October 29) this year, I want to drill down into the cycle once again
Let’s compare the pattern of the DJIA in the fall of 1929 to that of the QQQ here in the fall of 2025 as the Q’s currently are the leader.
Below is a daily DJIA from 1929.
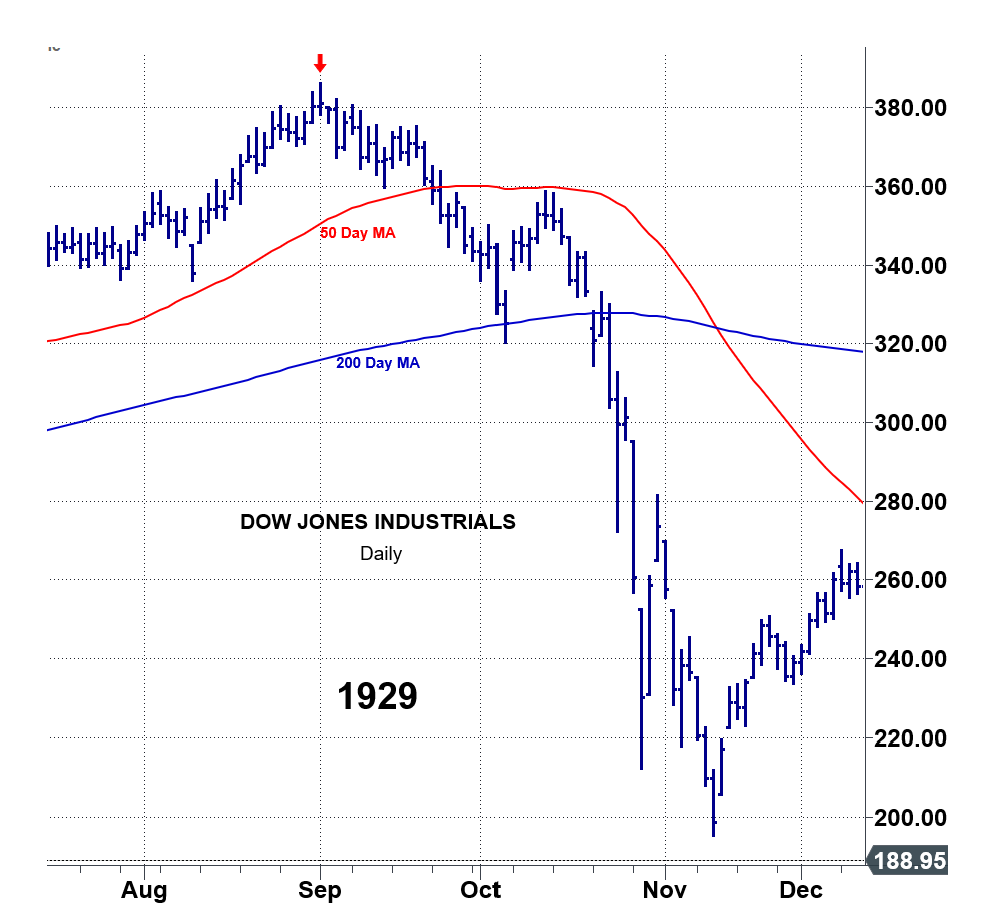
Notice that the crash itself started on the 36th day from high.
The 36 trading day is the one day turn up on the dailies that satisfied Phil D Gap following the Breakaway Gap below the 50 day moving average.
Up until that point it looked like the DJIA “may have” been putting in a double bottom.
The DJIA dropped to its 50 DMA initially in early October.
The normal expectation following a vertical run is that the first test of the 50 dma would produce a rally. It did. The DJIA gapped up the next session initiating a 5 day rebound.
Interestingly the DJIA never turned its 3 Day Chart back up in that rebound.
It did produce a Minus One/Plus Two, Holy Grail sell setup (a backtest of the 20 day moving average) at the rebound peak.
The DJIA turned down from that backtest of the 20 dma.
The notion of a double bottom at the 50 dma, didn’t really stand up because the test came on a gap BELOW the 50 day.
Be that as it may the bulls likely took hear in the fact that the second break of the 50 dma may have been an Undercut & Rally pattern as the DJIA stabbed up through the early October low the next session.
It was a pyrrhic victory: the DJIA filled the open gap and turned down with authority the next day, October 23, telegraphing the Great Crash.
October 24 was the first of the 3 crash days.
October 28 and October 29th completed the turbulent trifecta.
The aforesaid one day rally into the open gap on 10/22 was the 35th trading day from high.
The 36th trading day from high (6 squared) announced the crash was on.
Interesting as the 7 squared or 49th trading day from high was the low on November 13.
Below is a daily QQQ from October.
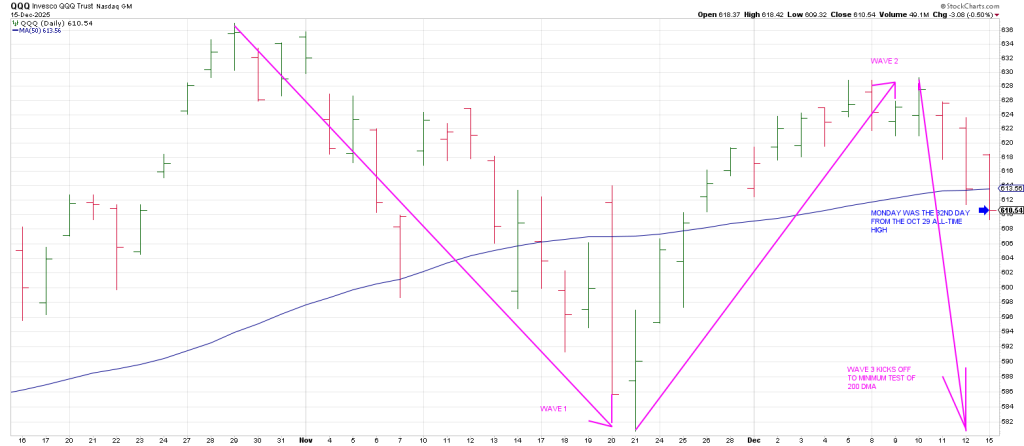
Monday was the 32nd trading day from high.
That does not necessarily mean that the script will be followed to a “T”.
Mr. Market is a great one for adlibbing.
If an air pocket is on the table it can start at any time. The market is not a Rolex.
In fact Friday may have been the POR: the Point Of Recognition.
The SPX dropped 100 points on Friday before trimming those losses slightly.
Monday’s report stated that with the Q’s hitting their 20/50 day moving average Bowtie we could get a rally attempt. We did.
The market gapped open; however bearishly the Q’s found high on the open and closed near session lows— CLOSING below its 50 day moving average.
Day 36 is falls on this week—on Friday.
To recap, yesterday I stated my expectation for a 2 to 3% one day decline this week. But again it could happen on any day.
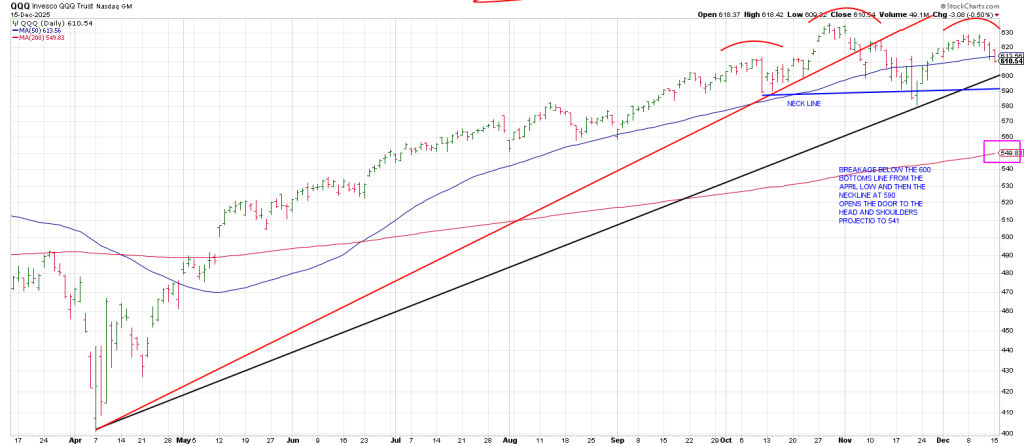
A 360 degree decline from the 637 all-time high is 540. This ties to the 200 day moving average.
A 540 degree cube-out is 495
Interestingly this ties to the large Breakaway Gap to the topside on May 12.
The October 29 time of the high squares out (opposition) with 580.
This was the Time/Price square-out directly down from the all-time high at 580 on October 21.
This is the Cause of the sharp rally into December 5.
Where now?
First, it indicates breakage below the last swing low at 580 is a big deal
It is/will be.
604 squares October 29.
The Q’s closed at 610.54 on Friday.
The indication is breakage below 604 opens the down door…perhaps to the basement.
The next square-out with Oct 29 is the aforesaid 580 October 21 low.
The next Time/Price square-out is 556.
Below that is 532, then 510 and then 488.
These numbers square-out with the Oct 29 all-time high.
For several months I have been warning that we may be following a mirror image foldback to 1929.
With the high in the QQQ (and the SPX) coming on October 29 this year mirroring the Great Crash on Oct 29, 1929—the synergy is eerily undeniable as glamor generals have been freefalling of late:
AVGO is the latest culprit joining the ranks of ORCL, SNOW, CRDO and NBIS to mention a few.
Hit and Run members shorted it at 348.25 on Friday covering the last tranche at 340.40 yesterday.
One of the factors pointing to crash potential in December is that we are 96 years from 1929.
On the Square of 9 Wheel 96 is straight across and opposite December 21.
Yesterdays report walked through the significance of December 21 which was the Great Jupiter/Saturn Conjunction on Dec 21, 2020.
Next week will be 5 years or 1800 days/degrees (5 Waves of 360 degrees) from this Gann Time Factor (Jupiter/Saturn).
In other words we are opposition The Great Conjunction which may exert its downside pull.
All the major 90 degree geometric running forward and backwards for the last 7 years have defined meaningful turning points
Further we are 7 Gann Panic years from the Xmas Crash in late December 2018.
It feels like this thing’s gonna crash.
In sum, from the Oct 29 ATH, the Q’s broke a Bottoms Line from the April 7 low in mid-November.
The Q’s then proceeded to rally to the underbelly of this Bottoms line and rolled over on Friday.
Monday they closed below the 50 day moving average.
In one respect the current structure is weaker than that of 1929 counting from the top.
The QQQ breakage below their 50 day moving average occurred earlier in this cycle than in 1929.
As well the initial break below the 50 day was larger and longer…versus the nominal one day break below the 50 dma in early November 1929.
That said the subsequent rally by the Q’s above their 50 day moving average —off the November 21 low—looks remarkably like the rounding shoulder traced out in mid-October 1929.
It may be a blaring alarm for those with ears to hear and eyes to see.
Conclusion, the Q’s look like they are being magnetized to last ditch support at a Bottoms Line connecting the April low with the late November low.
That Bottoms Line comes in at 600 this week.
600 QQQ defines a Bottoms Line connecting the April low and the late November low.
If the Q’s hit 600 ish and hold it will install a 3 point trend line.
Maybe that elicits a one day rally like 1929? Maybe this morning’s jobs report elicits a rally?
Be that as it may, if we get a meager rally off a possible 3 point trend line, an ensuing break of this 3 point trend line, given Time, Price and Pattern will trigger a Rule of 4 sell and likely announce the crash of 2025 is on.
Oh Lord.
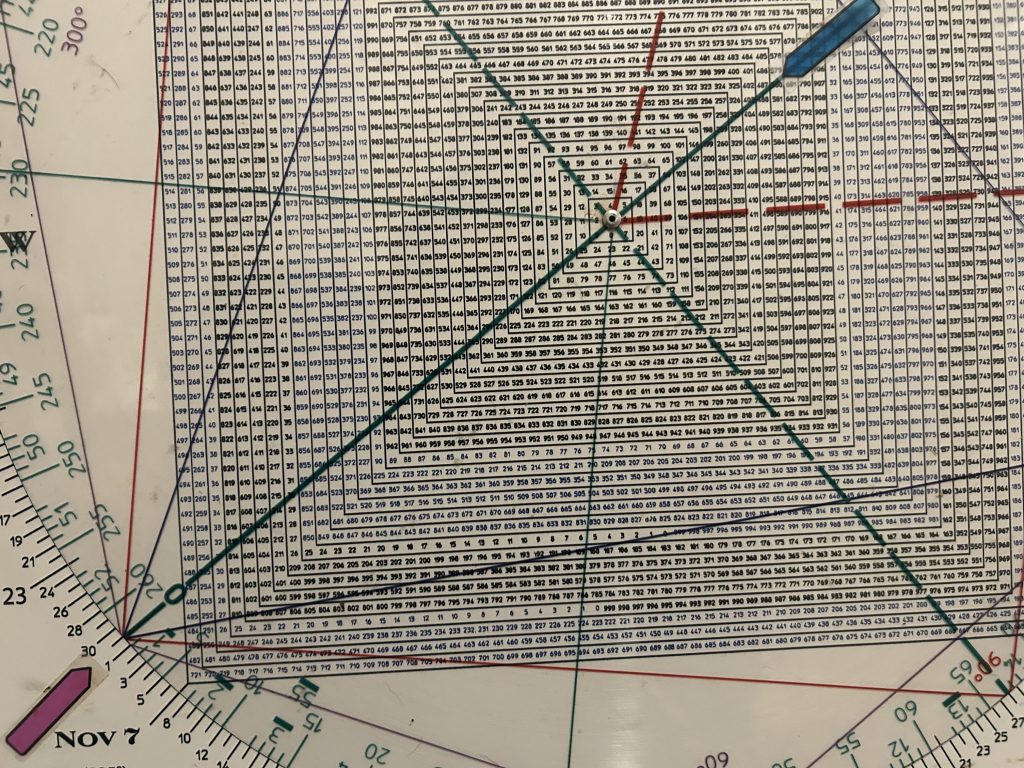
The great value of the Square of 9 Wheel is that it integrates Time and Price…allowing us to truly measure risk. And if you can’t measure risk, you can’t manage risk.
Most traders adhere to the adage that only price pays.
Gann told us that, “Time is more important than Price.”
A free ebook on the magical Square of 9 is available at cooperhitandruntrading.com where the Wheel is available for purchase.

Square of 9 Wheel
Purchase your own Square of 9 Wheel. Shipping to US only. Contact Jeff for shipping outside the US.