“You get a shiver in the dark.” Sultans of Swing, Dire Straits
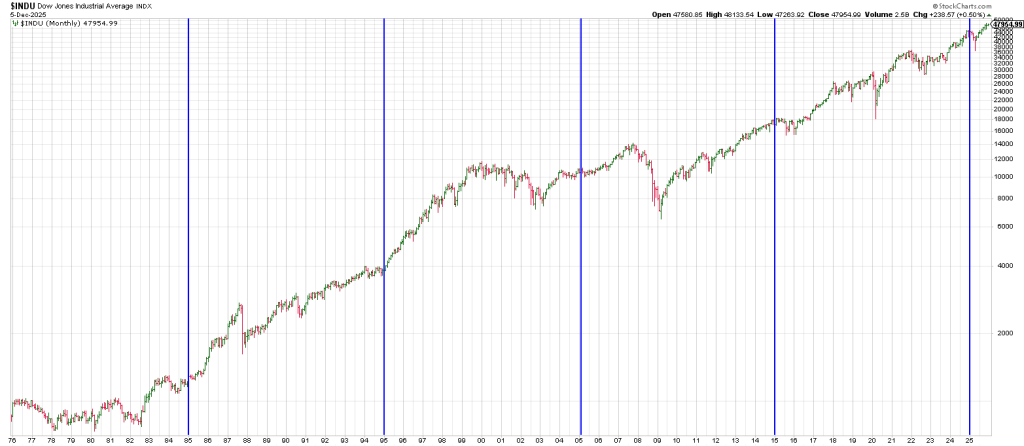
W.D Gann called years ending in “5” the Year of Ascension.
Years ending in 5 are up years almost without exception through the entire history of the DJIA.
1995 was a Lockout Rally.
1985 saw a 30% rally.
1975 was a vertical rally following the major low in October-December 1974.
1965 was the last ditch run into the Secular Bull Market Top in Feb 1996.
1955 was a strong bull year following the DJIA’s recapture of the 1929 high the prior year in 1954.
The DJIA was up roughly 30%.
The two exceptions to the Year 5 Ascension were recent, 2005, when the DJIA fell 0.6%, and 2015 with a 2.2% drop.
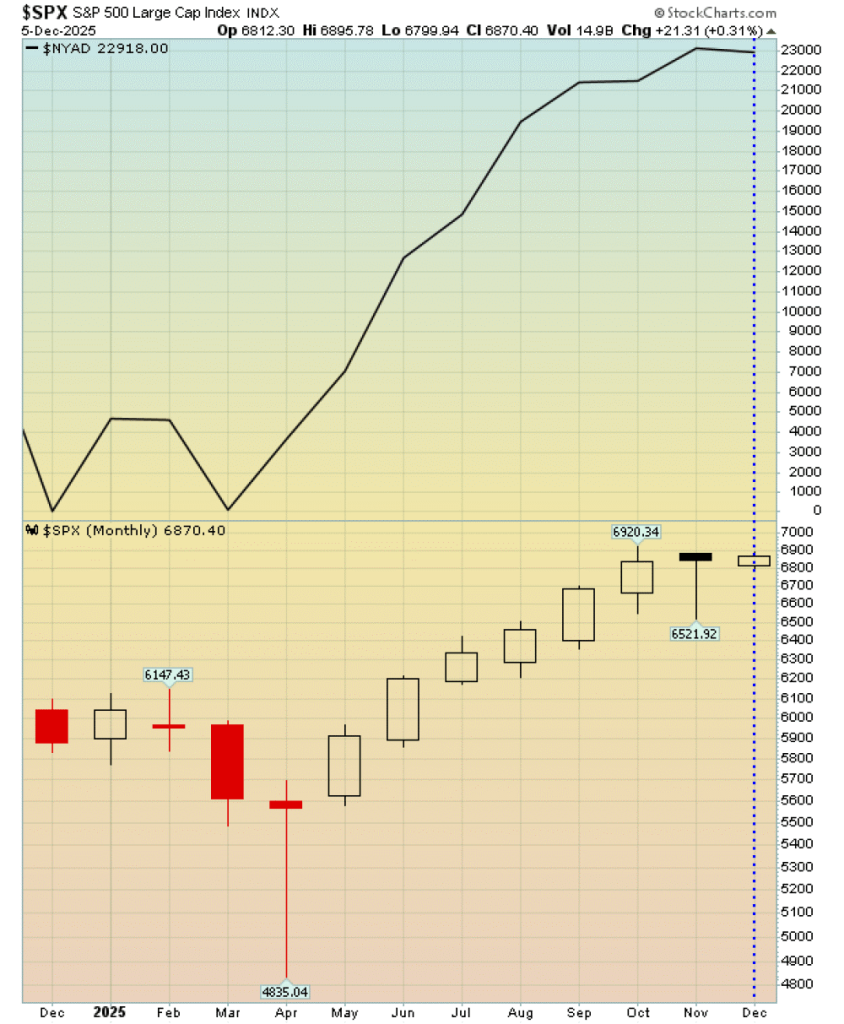
So far in 2025 the stock market is on track with its normal year 5 behavior with a 12.5% gain through December 4.
Even a Gann Panic before the end of the year is unlikely to derail a strongly up year 5.
And as we know the panic window is swung wide open now which we’ll get into below.
So since 2000, the Years Ending in 5 Decennial Pattern is proving to be a bullish “third time is a charm” after the two duds, 2005 and 2015.
The Year 5 bullish pattern was interrupted earlier this year when the market threw a Tariff Tantrum.
The tantrum was a Gann 7 Week Panic. Since the successful test of the lows and impulse up on April 22, the Year 5 bullish pattern has been a Tractor Beam.
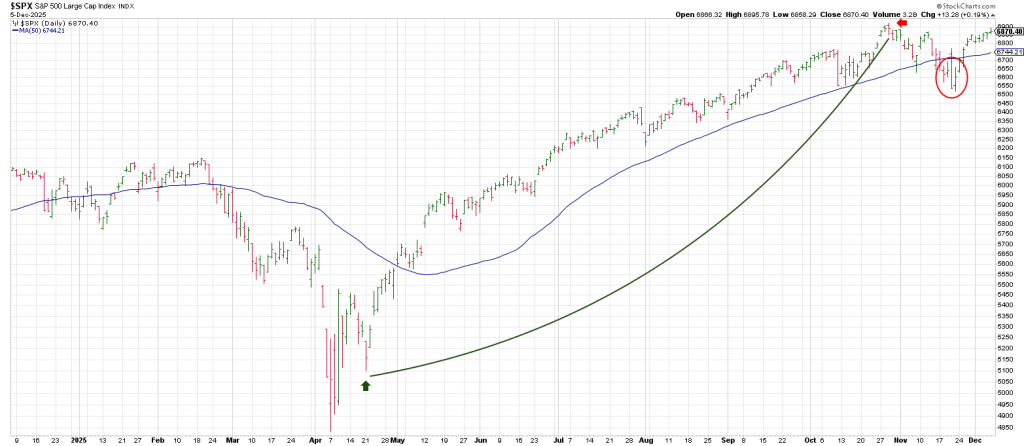
The SPX 50 DMA has been violated only once, in November, following the October 29 top synchronous with the 96th anniversary of the 1929 crash (the 3rd in a serious late October crashes that year).
However, the SPX reclaimed its 50 DMA quickly turning its 3 Day Chart back up on November 26 at a price of 6776.18. That price is likely to be pivotal this week if we get a pullback.
Here’s why.
The SPX kissed the top of the trend channel show last week in this space and ‘tailed’ off leaving a Lizard sell signal.
This is a new 10 day high with an open and close near session lows.
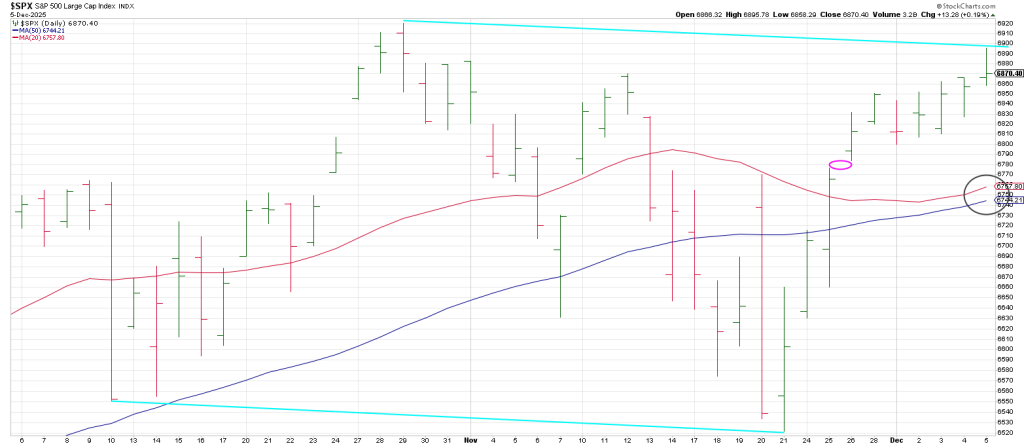
If we get downside follow through from this signal bar reversal the likely short term target is a 20/50 ma Bowtie at 6745-6755. As well there is an open gap at 6776.
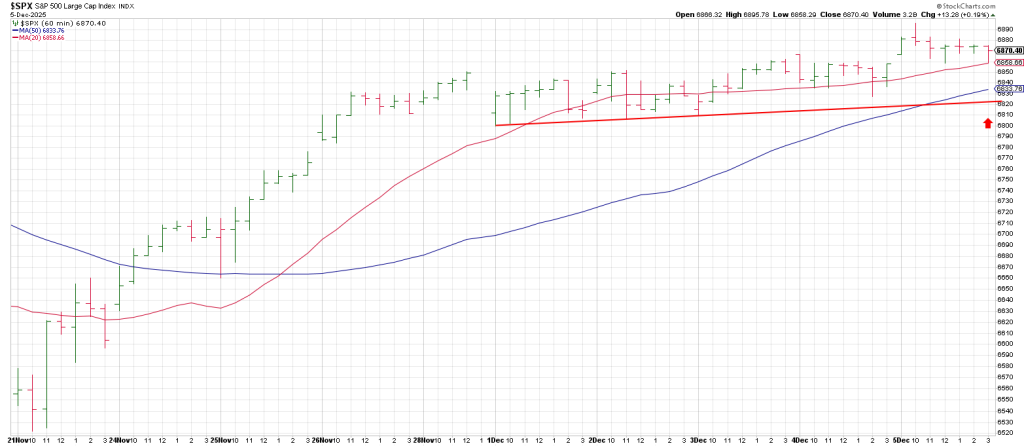
Breakage below this 6830 pivot triggers an hourly Rule of 4 Sell per above chart.
While its “only” an hourly setup, small steps often lead to big moves.
This could be especially true because
1) The Street is loaded for a Santa Rally. Performance Pressure is front loaded and should Santa’s Sleigh hit a air pocket, players could sell first and ask questions later.
2) We have the potential for the Gann Panic Zone to exert its influence to the downside.
We are 40 calendar days from the high (Oct 29). This is the time frame of the last pivot high prior to a waterfall decline IF one is on the table. It equates to October 4, 1987 when incidentally there was a big rally to a lower high before the rollover into Black Monday, October 19.
Ditto 1929 when there was a rally phase to a lower high in mid-October following the September 3 top that year. The rest was history. Literally.
That said, if we get a pullback to the well-defined support at the 6750 to 6850 (50 hour ma) to 6830 (the hourly 3 point trendline) that pulls the rubber band back we could get a rally into year end.
Of course that constitutes a pullback of 100 SPX points plus which would produce some nice short-side plays as well as some potential nice swing setups IF the support holds and we turn up.
Here are the geometric time turns.
1) From the 4/22 impulse up, 190 days/degrees gave the October 29 top.
2) From the May 12 impulse up, 180 days/degrees ties to the November 12 top which perpetuated the slide below the 50 DMA. So this is an important near term cycle.
3) From the June 23 upside impulse 180 days/degrees later gives Dec 23
4) From the important August 1 fake-out low 90 days/degrees later we got the October 29 all-time high. So this also is an important cycle to watch. 180 days/degrees later gives February 1. My expectation is that the SPX 200 DMA is tested between now and end of February as offered last week.
5) From the Oct 29 ATH 90 days/degrees gives January 29. This late January/early February cluster is going to be important. If we are making lower lows and lower high in January, the expectation is a flush-out into this time-frame.
6) From the November 20-21 low, 90 degrees is February 20-21. This also is 360 degrees from the major February 19, 2025 pre-crash high. February is a cyclical cluster which must be on our radar. It should be easy to see which way the play is going into 2026.
IF the Gann Panic Window delivers a swan dive, the time frame to look at is the 7th to 8th week from high. In other words 7 to 8 weeks (49 to 55/56 days from the October 29 ATH)
Alternatively, could late January/early February be a high? Of course. On the Gann Master 60 Year Cycle, a Secular Bull Market Peaked the first week of February 1966. This underscores the aforesaid late January/early February short-term cycles flagged above. So this is our Roadmap for coming months.
Because these shorter term cycles are synchronous with the Master 60 Year Cycle caution is warranted…be it a pop into January/Feb or accelerated downside momentum starting any time from here.
Further we are 18 years, (the Rahu Cycle) from the 2008 late November Primary Low of the Great Financial Crisis.
That was when the NAZ struck low with the key Generals/Mags making low. It was the low around the world. March 2009 was an Undercut low.
One-half the Master 60 Year Cycle is February 1996—30 years ago.
The DJIA rallied sharply from November 1994 to February 1996 where it flat-lined and ultimately flushed-out into July 1996 (180 days/degrees later putting in a significant low eliciting a 2 year (720 day/degrees) run into July 1998.
A 90 day/degree pullback from July 1998 played out into October 1998 prior to the Run for the Roses into March 2000.
My point is if the Master 60 Year Cycle is going to exert its influence, the next few years should see the Bear come out of hibernation.
They next several years could be the most volatile of our lifetime.
We should see a crash in 2026-2027.
Gann spoke about anniversary dates in in chapters 8 and 9 in his books 45 Years in Wall Street and How To Make Profits in Commodities. Respectively.
The simple rule with anniversaries is this:
Markets will often reach extreme high or low on or about the same day of the month in different years.
For example:
The Panic of October 1907
The October 1917 crash
The October 1987 great crash.
The October 1997 Asian Currency Crisis
The October 2007 pre-Great Financial Crisis high
As the bell rang in January 2008 the selling for the bear market kicked in.
This January will be 18 years (540 degrees on the yearly cycle and the Rahu Cycle).
Following the 96th anniversary of the October 29, 1929 top this past October, we see that 96 on the Square of 9 Wheel is opposite December 21.
This ties to the end of the Gann Panic Window counting from October 29.
The end of 2025, the start of 2026 is significant cyclically.
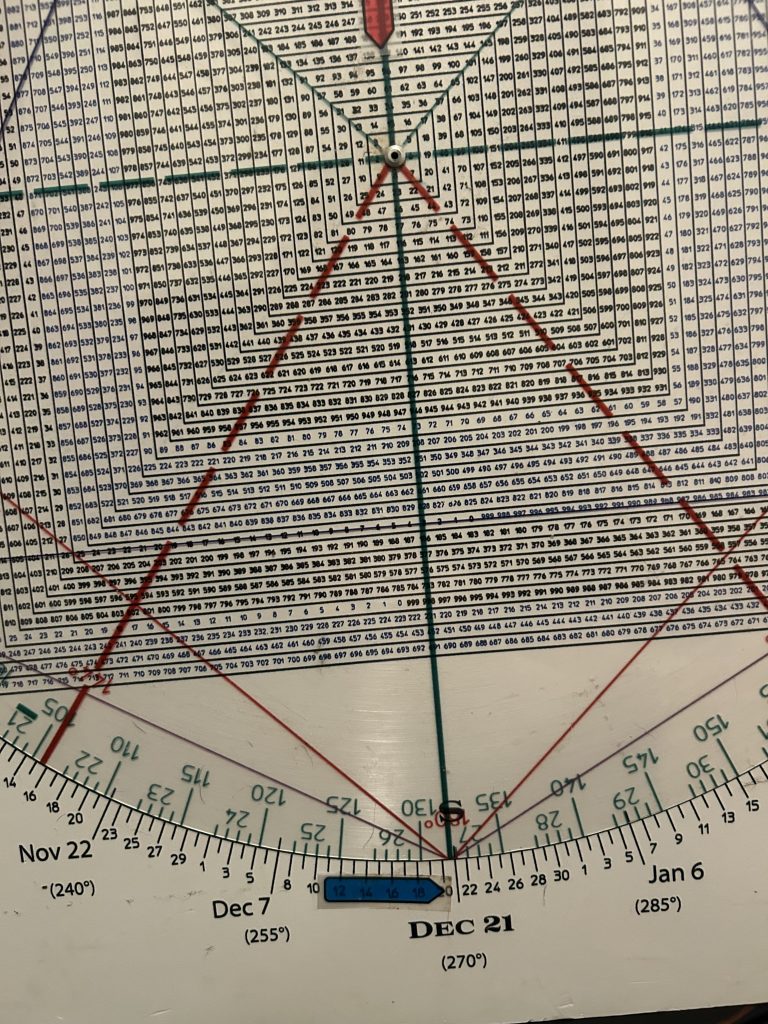

Square of 9 Wheel
Purchase your own Square of 9 Wheel. Shipping to US only. Contact Jeff for shipping outside the US.
Is there a logical reason why the anniversary dates and the Decennial Pattern and the Master 60 Year Cycle should matter and produce similar behaviors?
This is something that has been going on as long as the market.
There must be something to it…even if it defies your sense of logic.
As Gann stated, “History repeats for those with ‘eyes to see’.
Gann pointed to the cycles revealed in The Bible in his coded novel, The Tunnel Through The Air.
Among Gann’s most important work was in his insistence that historic price patterns repeat in varying
Intervals.
Gann detailed out 20 Year, 30 Year and 60 Year Cycles being very important for market trends.
It’s not that pat. There are other cycles as well that can open the door to market moves.
“Cycles in business and the Stock and Commodity Markets have always repeated and always will. Nature’s laws are unchangeable and no man or set of men can change them. The New Dealers have not proved that they can stop inflation. They claim that they can prevent DEPRESSION and PANICS, but no one has succeeded in doing it in the past and the next few years will prove that our government leaders cannot stop a DEPRESSION by WASTE and SPENDING…” W D Gann, quote from the late 1920’s.
The above words are pertinent, as we head into Fed Day this week where the consensus is for a rate cut, the bulls are chomping at the bit that this will fuel more rally. However, the consensus is that it will be lip service and that the Fed will be on hold until a new Fed Chair takes the reins in May…5 months that may prove to be a time where the economy may be begging for Powell to cut when he is not inclined to do so.
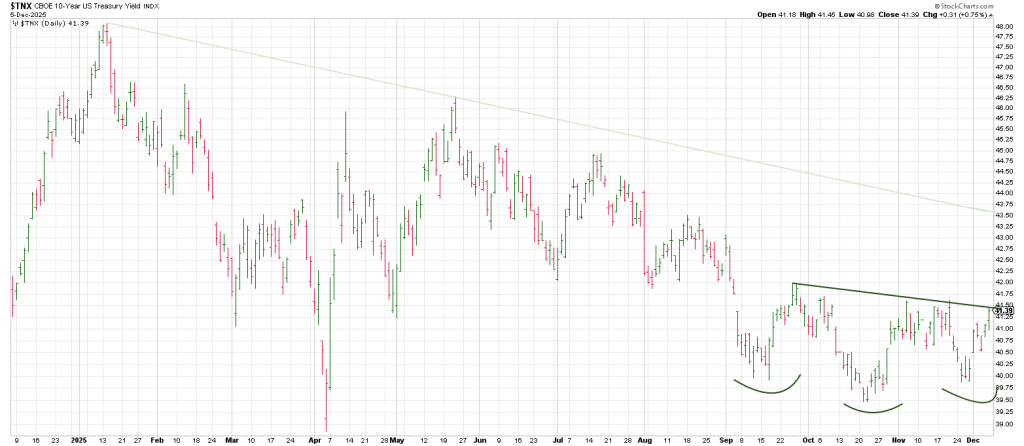
Interestingly TNX dailies show a possible inverse Head and Shoulders suggesting higher yields.
A monthly TNX shows a 26 month triangle starting from October 2023.
The last two months showed very narrow ranges.
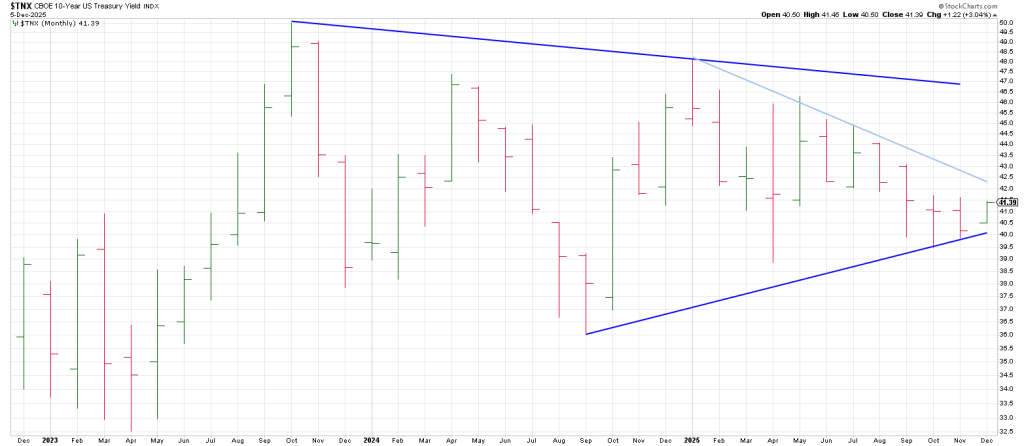
When TNX emerges from this coil it is likely to be a strong directional move affecting equities.
In sum, in addition to the geometric cycles noted above as well as the Gann Panic Window, there are natural cycles that point to a downturn starting from Dec 9th:
The Sun, Mercury, Venus and Mars are direct in a kind of mini Harmonic Convergence mirroring the top in August 1987.
History suggests the combined effect should see volatility and volatility indices rise.
We will be looking at UVXY today.
We may get a flash crash.
Supporting this idea is that net breadth has deteriorated sharply.
The chart below covers NYSE weekly net advances and declines for every calendar week from January 1 through December 7, 2025.
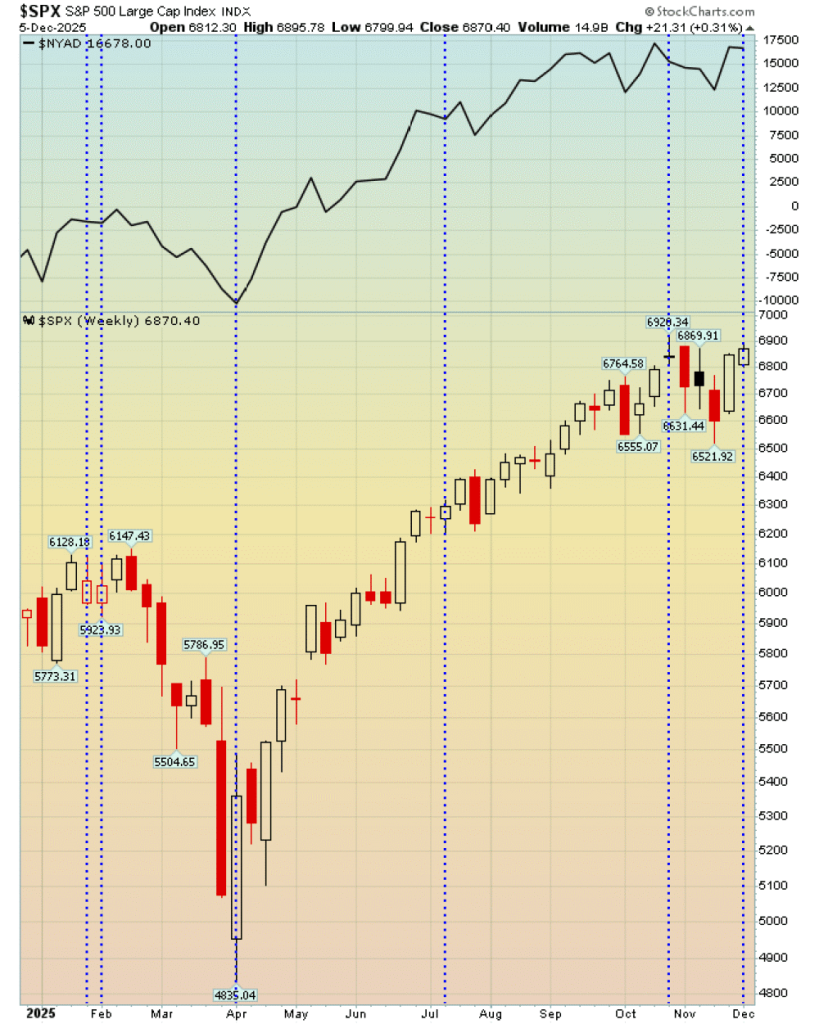
In 2025 there were exactly 6 weeks when NYSE declines exceeded advances while the SPX still finished higher.
Those weeks ended:
Jan 27,
Fe 3,
July 14,
October 7
And most recently Dec 1.
Each instance served as a direct warning of a sharp selloff.
The first two occurred immediately ahead of the February-March collapse, which drove the SPX down 25% in just weeks.
The week ending July 14 preceded a sudden 250 point break only days later and another abrupt 250 point decline followed the week ending October 27.
The latest signal—the week ending December 4—aligns perfectly with the internal weakness we’ve been flagging of late.
However, there is an even more serious warning.
Until this month there had not been a single moth in 2025 where the SPX rose while NYSE net advances were negative. Until now.
Through the first week of December, four of the last five sessions recorded negative breadth despite four of those five sessions producing SPX gains.
December’s net advances stand at -634 while the SPX is up 58 points. This divergence is even more extreme than what existed in early February ahead of the tariff crash.
“It’s raining in the park but meantime
South of the river, you stop and hold everything.” Suntans of Swing, Dire Straits