Monday is Dec 8. It is opposite the 667 SPX Bear Market low in March 2009.
As well early December squares the March 6, 2009 Bear Market 2009 low.
The fact that we have this dual synchronicity is interesting.
A price of 694 or 6940 squares this early December time frame.
The implication is that we get a nominal new all time-high…and that this high mirrors the false new high in October 2007 which was a nominal new high above the July Primary High that year.
Further this time frame ties to when the last strength, the last pivot high is struck in the context of the
Gann Panic Window.
As offered yesterday this is October 4 in 1987 and mid-October in 1929.
In both instances the strength disabused market participants of the risk ramping beneath the surface.
In fact the early October 1987 rally saw the largest one day rally in terms of points in the DJIA to that point in history.
You can just imagine how that twisted and skewed psychology to bullish at exactly the wrong time.
That’s the perversity of Mr. Market in spades.
A diabolical dude.
How will we know if a new high is a blaring siren in this time frame.
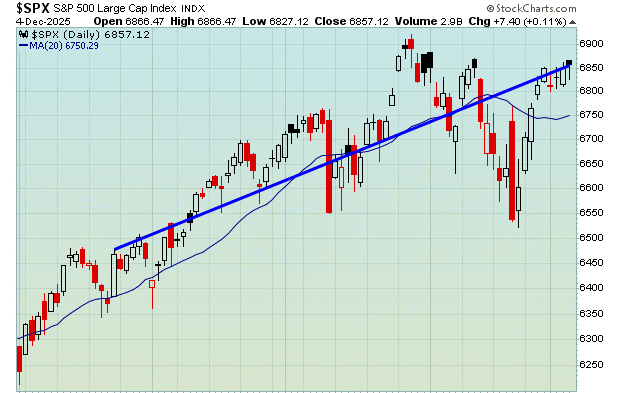
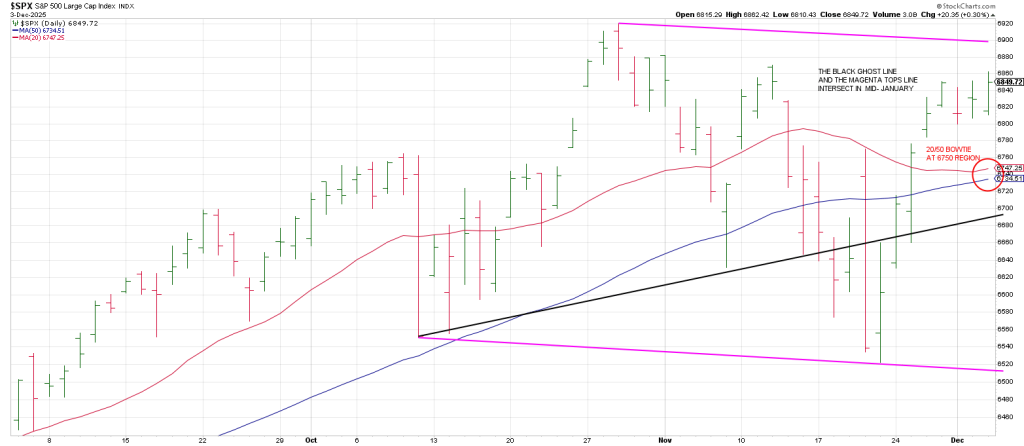
If the SPX is goosed above the descending channel show yesterday (see again below) and jackknife back into the channel caution is warranted.
If the SPX in turn then follows suit and dives below the bottom of the channel, duck.
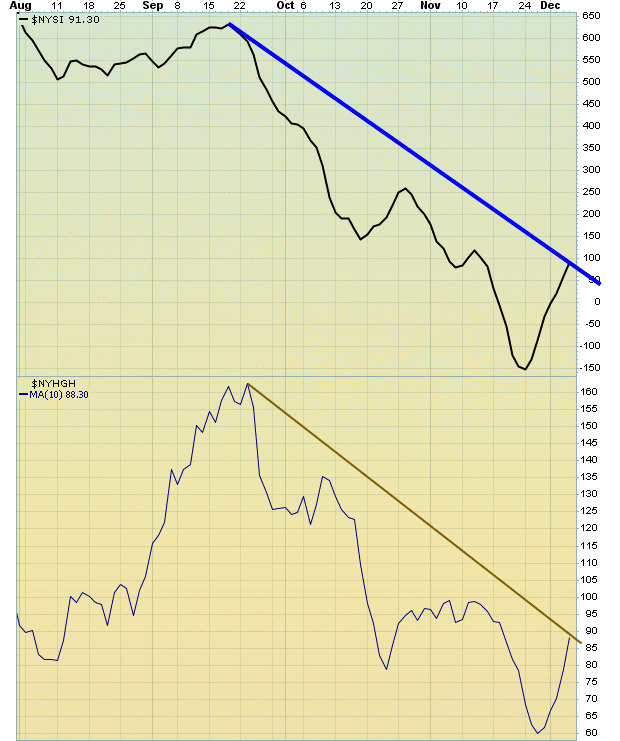
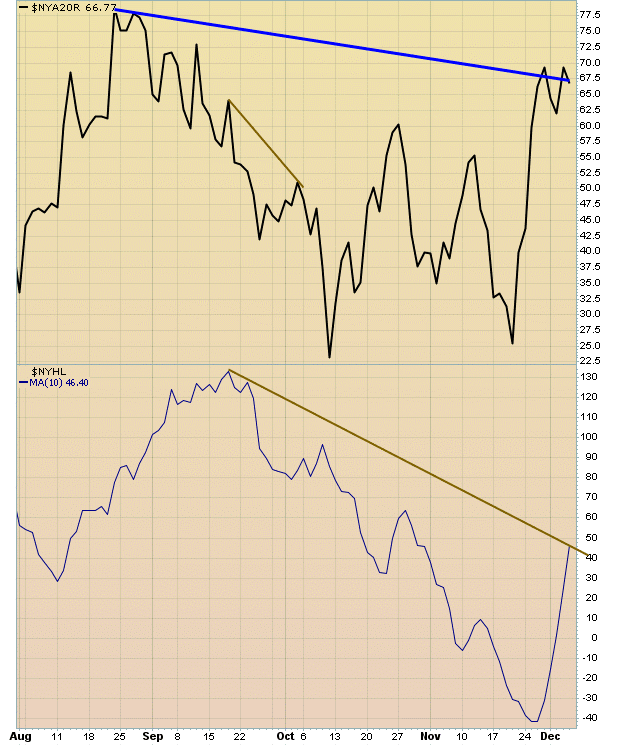
In sum, for the past three months the SPX has been locked in a 300 point band between 6600 and 6900, even as breadth has deteriorated sharply.
The weakness extends far beyond daily net advances.
The McClellan Summation Index has dropped 600 points, NYSE New Highs have been cut in half, the percentage of NYSE issues above their 20 day moving average has fallen by 17%. NYSE new highs minus new lows has declined by two-thirds.